Abstract
Study Objectives:
Adenosine modulates sleep via A1 and A2A receptors. As the A1 receptor influences CaV2.1 channel functioning via G-protein inhibition, there is a possible role of the CaV2.1 channel in sleep regulation. To this end we investigated transgenic Cacna1a R192Q mutant mice that express mutant CaV2.1 channels that are less susceptible to inhibition by G-proteins. We hypothesized that Cacna1a R192Q mice could show reduced susceptibility to adenosine, which may result in a sleep phenotype characterized by decreased sleep.
Design:
R192Q mutant and littermate wild-type mice were subjected to a 6-h sleep deprivation, treatment with caffeine (a non-specific adenosine receptor antagonist which induces waking), or cyclopentyladenosine (CPA, an A1 receptor specific agonist which induces sleep).
Measurements and Results:
Under baseline conditions, Cacna1a R192Q mice showed more waking with longer waking episodes in the dark period and less non-rapid eye movement (NREM) sleep, but equal amounts of REM sleep compared to wild-type. After treatment with caffeine R192Q mice initiated sleep 30 min earlier than wild-type, whereas after CPA treatment, R192Q mice woke up 260 min earlier than wild-type. Both results indicate that Cacna1a R192Q mice are less susceptible to adenosinergic input, which may explain the larger amount of waking under undisturbed baseline conditions.
Conclusion:
We here show that adenosinergic sleep induction, and responses to caffeine and CPA, are modified in the R192Q mutant in a manner consistent with decreased susceptibility to inhibition by adenosine. The data suggest that the A1 receptor modulates sleep via the CaV2.1 channel.
Citation:
Deboer T; van Diepen HC; Ferrari MD; Van den Maagdenberg AMJM; Meijer JH. Reduced sleep and low adenosinergic sensitivity in Cacna1a R192Q mutant mice. SLEEP 2013;36(1):127-136.
Keywords: Adenosine, calcium channel, sleep regulation
INTRODUCTION
Sleep is regulated by homeostatic and circadian processes.1 In mammals sleep homeostasis is reflected in the slow-wave activity ([SWA] electroencephalogram power density between ˜1-4 Hz) of the non-rapid eye-movement (NREM) sleep electroencephalogram (EEG). In all mammalian species investigated thus far, SWA in NREM sleep increases as a function of prior waking duration.1–7 Mathematical models, simulating this sleep homeostatic process (Process S), have been applied successfully in human,8 rat,9 and mouse.5,10 The circadian process is controlled by a pacemaker located in the suprachiasmatic nucleus (SCN) of the hypothalamus11 and provides the homeostatic process with a circadian time frame.
There is evidence supporting an important role for adenosine in sleep homeostatic regulation. Animal studies have shown that adenosine levels rise during waking and decline during sleep.12–14 Moreover, administration of adenosine and adenosine receptor agonists and antagonists change the expression of sleep and wakefulness.15 The cellular effects of adenosine are mediated through four different G-protein coupled adenosine receptors (A1, A2A, A2B, and A3).16 Of them, the A1 receptors are widely expressed in the brain (cortex, thalamus, hippocampus, basal ganglia17,18), and it is generally assumed that adenosine affects sleep via the A1 receptor.15 In addition, the A1 receptor is coupled to inhibiting G-proteins17 and stimulation of A1 receptors inactivates CaV2.1 and CaV2.2 calcium channels.19,20 CaV2.1 channels are predominantly localized at presynaptic nerve terminals throughout the brain and play a key role in mediating neurotransmitter release.21,22
To investigate the role of the A1 receptor in relation to the CaV2.1 channel function, we studied sleep and sleep regulation in a transgenic mouse model expressing mutant CaV2.1 channels with a R192Q missense mutation in the pore forming α1 subunit.23,24 The R192Q mutation reduces G-protein-mediated inhibition of CaV2.1 channels25,26 and, in humans, causes familial hemiplegic migraine type 1 (FHM1),23,24 a monogenic subtype of migraine with aura characterized by disabling attacks of headache, autonomic dysregulation, and neurological aura symptoms that in FHM patients are particularly severe and cause hemiparesis.27,28 These Cacna1a R192Q mice show enhanced neuronal calcium influx that is associated with increased spontaneous and triggered neurotransmitter release, and enhanced susceptibility to cortical spreading depression (CSD),24,29,30 a slowly progressing wave of neuronal and glia depolarization27 which is the cause of the migraine aura28 and likely can trigger migraine headache pathways in experimental animals.31
The relevance of choosing a migraine mouse model also comes from the fact that acute changes in sleep patterns, such as lack of sleep, sleeping in, and time zone transitions can trigger migraine attacks.28,32,33 Also, the observation that all carriers of a casein kinase 1 δ clock gene mutation in a family with familial advanced sleep phase syndrome also suffer from migraine with aura provides a link between migraine and sleep.34–36
The observed clinical relationship between disrupted sleep and migraine, together with the G-protein-mediated influence of adenosine receptors on the functioning of CaV2.1 channels prompted us to investigate whether the Cacna1a R192Q FHM1 mouse may be less susceptible to adenosinergic inhibition and exhibit a sleep phenotype. We previously showed that, Cacna1a R192Q mice adapt faster to phase shifts of the light-dark cycle in their behavioral and sleep-wake rhythms.37 We therefore performed baseline recordings (i.e., EEG/electromyogram) and applied 6-h sleep deprivation to investigate sleep regulation in these mice. In addition, we investigated the effects of caffeine, a general adenosine receptor antagonist, and cyclopentyladenosine (CPA), a specific A1 receptor agonist, on sleep in these animals. We show that the R192Q mutation results in increased waking, particularly in the active dark period, and that this may be caused by reduced susceptibility to inhibition from the adenosine A1 receptor.
METHODS
All experiments were performed under the approval of the Animal Experiments Committee of the Leiden University Medical Center according to the Dutch law on animal experiments. Using a gene targeting approach, the FHM1 R192Q mutation (i.e., an arginine-to-glutamine change at amino acid position 192) was introduced in Cacna1a, the ortholog of the human CACNA1A gene, as described earlier.24 In brief, gene targeting was performed in embryonic stem (ES) cells of mouse strain 129 and genetically modified ES cells were introduced in blastocysts of the C57Bl/6J strain. The neo cassette that was used for the selection of modified ES cells was removed in vivo using the Cre – LoxP system by crossing transgenic Cacna1a R192Q mice with EIIA-Cre deleter mice. Transgenic (and non-transgenic) offspring with the FHM1 R192Q mutation but without the neo cassette was further backcrossed to C57Bl/6J for ≥ 6 generations, so the genetic background of all used mice is > 98% C57Bl/6J. Adult male mutant mice of the transgenic R192Q knock-in mouse strain and non-transgenic littermate controls (approximately 16 weeks of age) were used for the experiments. The mice were housed in standard Plexiglas cages. Food and water were available ad libitum. The animals were maintained under a 12h:12h L:D cycle (light from 08:00 to 20:00, 30-50 lux at the bottom of the cage, daylight fluorescent type of light).
Under deep anesthesia (Hypnorm and Dormicum i.p.), 2 stainless steel electrodes (MS333/3; Plastics One, Inc. Roanoke, VA, USA) were placed over the right parietal cortex (3 mm posterior to bregma, 2 mm lateral to midline) and over the cerebellum to record the EEG.38 Two electromyogram (EMG) electrodes (E363/70 electrode SS subcut; Plastics One) were inserted subcutaneously and placed on the neck muscle. The electrodes were connected to stainless steel wires and fixed to the skull with dental cement. At least 7 days were allowed for recovery after surgery. Subsequently, the animals were connected to the recording system by a flexible cable and a counterbalanced swivel system. The animals remained on the cable for ≥ 3 days before the start of the recording. Three experiments were performed.
In the first experiment, a 24-h baseline EEG/EMG recording was obtained, after which the animals (n = 8 for both genotypes) were sleep deprived for 6 h, starting at lights on, followed by an 18-h recovery period.5,39 During the 6-h sleep deprivation, the animals and their EEG and EMG records were observed online. Whenever the animals appeared drowsy or the EEG exhibited slow waves, they were mildly disturbed by moderate noise, by the experimenter opening the cabinet and, when necessary, by introducing fresh food, fresh drinking water or nesting material into the cage. The animals were never touched and never disturbed during feeding and drinking.
In the second experiment, animals (n = 8 for both genotypes) were injected i.p. at light onset with caffeine (15 mg/kg) or saline in a randomized crossover design and EEG and EMG were recorded for the entire 12-h light period, but only the results of the first 6 h are shown.
In the third experiment, animals (n = 6 for both genotypes) were injected at light onset i.p. with CPA (1 mg/kg) or saline in a randomized crossover design; EEG and EMG were recorded for the entire 12-h light period, but only the results of the first 6 h are shown. The floor of the cage, at the height of the animals, was heated to 30-31°C approximately 30 min before administration of CPA or saline and the first 6 h following the injection to prevent the body temperature of the animals from cooling too much due to CPA administration, similar to previous experiments.40,41 For both experiments, the start of the light period was chosen as time of injection, since the genotypes did not show a significant difference in sleep and waking during the light period (see Results).
The EEG and EMG were recorded as previously described.38 Before each recording, a calibration signal (10 Hz sine wave 300 μ V peak-to-peak) was recorded on the EEG and EMG channels. Both signals were amplified (amplification factor ˜2,000), conditioned by analogue filters (high-pass filter −3 dB at 0.16 Hz) and sampled at 512 Hz. The signals were filtered through a digital finite impulse response filter (EEG low-pass filter at 30 Hz and EMG band-pass filter between 20 and 40 Hz) and stored with a resolution of 128 Hz. EEG power spectra were computed for 4-s epochs.
The vigilance states (waking, NREM sleep, and REM sleep) were scored offline in 4-s epochs by visual inspection of the EEG and EMG signal, as well as EEG power density in the slow wave range (0.75-4.0 Hz38,39). As in previous studies,40 after CPA administration the EEG changed dramatically. Normal scoring criteria were applied, but due to the EEG changes, the terms “NREM sleep-like” (highly synchronized, slow wave EEG, no EMG activity) and “waking-like state” (less synchronized low amplitude and faster EEG, clear EMG activity) were used for the first 4 hours following CPA administration. Epochs with artifacts were excluded from the spectral analysis, but vigilance states could always be determined. Artifact-free EEG power density values were computed for 4-s epochs in the range between 0.25-25.0 Hz.5,42,43 Between 0.25-5.0 Hz, values were collapsed into 0.5-Hz bins, and between 5.25-25.0 Hz in 1-Hz bins; average spectra over 24 h were computed for each vigilance state and genotype. EEG SWA data were standardized relative to the individual 24-h mean baseline value in NREM sleep (= 100%) and subsequently averaged over all animals. Vigilance state episode onsets were determined with an algorithm as described previously.5,42 In short, a REM sleep episode was terminated when it was followed by 6 consecutive 4-s epochs not scored as REM sleep, or when REM sleep was interrupted by episodes < 24 s amounting to a total of 72 s not scored as REM sleep. NREM sleep was terminated when followed by 6 consecutive 4-s epochs scored as REM sleep, 14 consecutive 4-s epochs not scored as NREM sleep, or when NREM sleep was interrupted by episodes < 24 s amounting to a total of 240 s not scored as NREM sleep. A waking episode was terminated by 6 consecutive 4-s epochs scored as NREM sleep, or when waking was interrupted by episodes < 24 s amounting to a total of 240 s not scored as waking. In addition, the number of brief awakenings (< 12 s) per h of sleep was computed to assess sleep fragmentation.
Previous data showed that theta peak frequency activity is dependent on exploratory or active behavior44; therefore, the amount of active waking was determined by analyzing the difference in the relative time awake with above average theta frequency activity between 8-9 Hz (the high flank of the theta peak in the waking spectrum).
In the simulations, the time course of Process S was determined iteratively on the basis of the vigilance states.5,9,45 In 4-s epochs scored as waking or REM sleep, S increased according to a saturating exponential function with an upper asymptote of 1. In epochs scored as NREM sleep, S decreased according to an exponential function with a lower asymptote of 0. The Initial Value (IV, the level of S at the start of the baseline) and the increasing (Ti) and decreasing (Td) time constants were taken from the publication by Huber et al.5 Subsequently the IV and the difference between light and dark in Td were adapted to compensate for systematic diurnal modulations.9,45 The IV was tested between 0 and 1 in steps of 0.1. The difference in Td between light and dark was tested between 0 and 3 in steps of 0.1. For each combination of variables, the hourly averages of S were compared with the corresponding hourly values of SWA in NREM sleep for each individual mouse. The optimum time constants and IV were estimated by optimizing the linear correlation between S and SWA and minimizing the mean square of the difference between S and SWA on the basis of hourly values.5,9,45 For plotting purposes, the simulated data (Process S) were standardized relative to the mean 24-h baseline value of S. The presented r-values are mean values over all animals after Fisher’s z transformation of the individual r-values.
Overall effects within a genotype were analyzed by 2-way analysis of variance (ANOVA) with factors time of day and treatment. Contrasts within genotypes were tested by post hoc 2-tailed paired t-tests after significant ANOVA. Differences between genotypes were analyzed by 2-way ANOVA with factors genotype, time of day, and treatment. Contrasts between genotypes were tested by post hoc 2-tailed t-tests after significant ANOVA for genotype or interaction genotype*condition.
RESULTS
Baseline Sleep
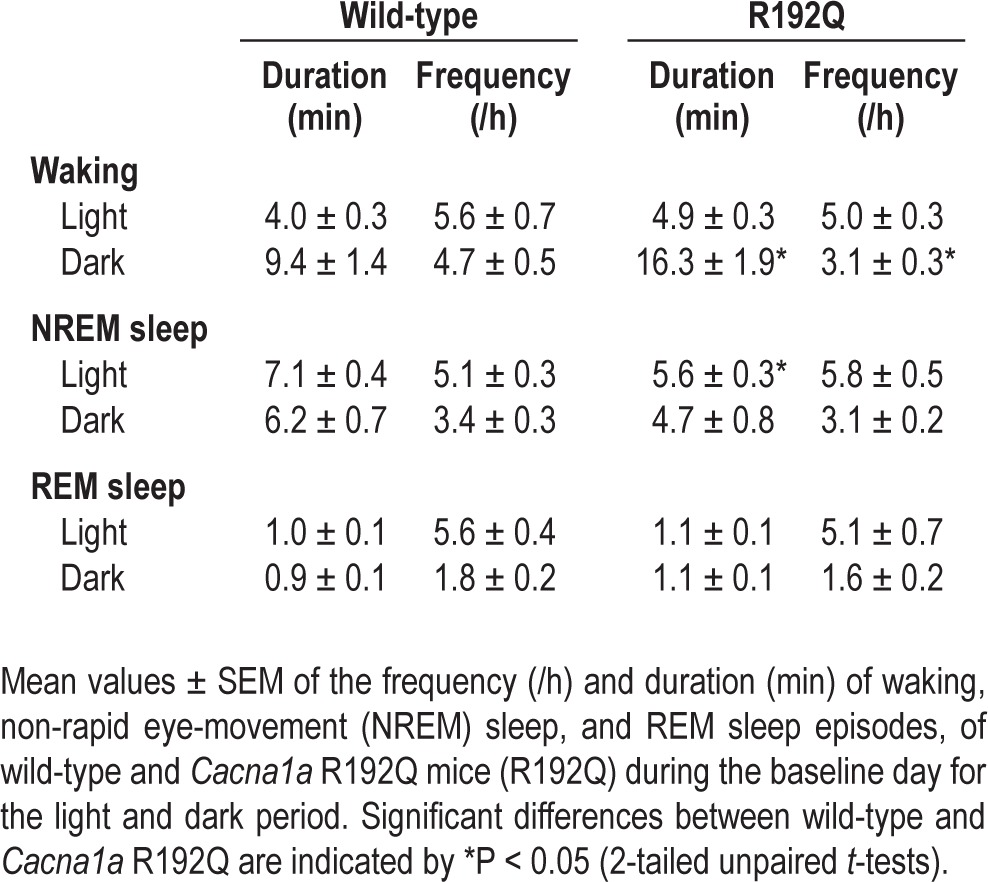
Cacna1a R192Q mice were 7% more awake over 24 h than wild-type mice (Table 1, Figure 1). This was mainly due to a reduction in the amount of NREM sleep, as the amount of REM sleep did not differ between genotypes. As a result, the amount of REM sleep per total sleep time was increased in Cacna1a R192Q mice. The increase in waking was most pronounced in the dark (active) period and was caused by a longer average waking episode duration in Cacna1a R192Q compared to wild-type (Table 2, P < 0.05 unpaired t-test). Waking episode frequency was slightly reduced in the dark period in R192Q mice; NREM sleep episodes in the light period were on average 1.5 min shorter. The number of brief awakenings per hour of total sleep time did not differ significantly between genotypes (WT: 1.5 ± 0.3, R192Q: 1.0 ± 0.2, P = 0.36, 2-tailed paired t-test).
Table 1.
Amount of the different vigilance states
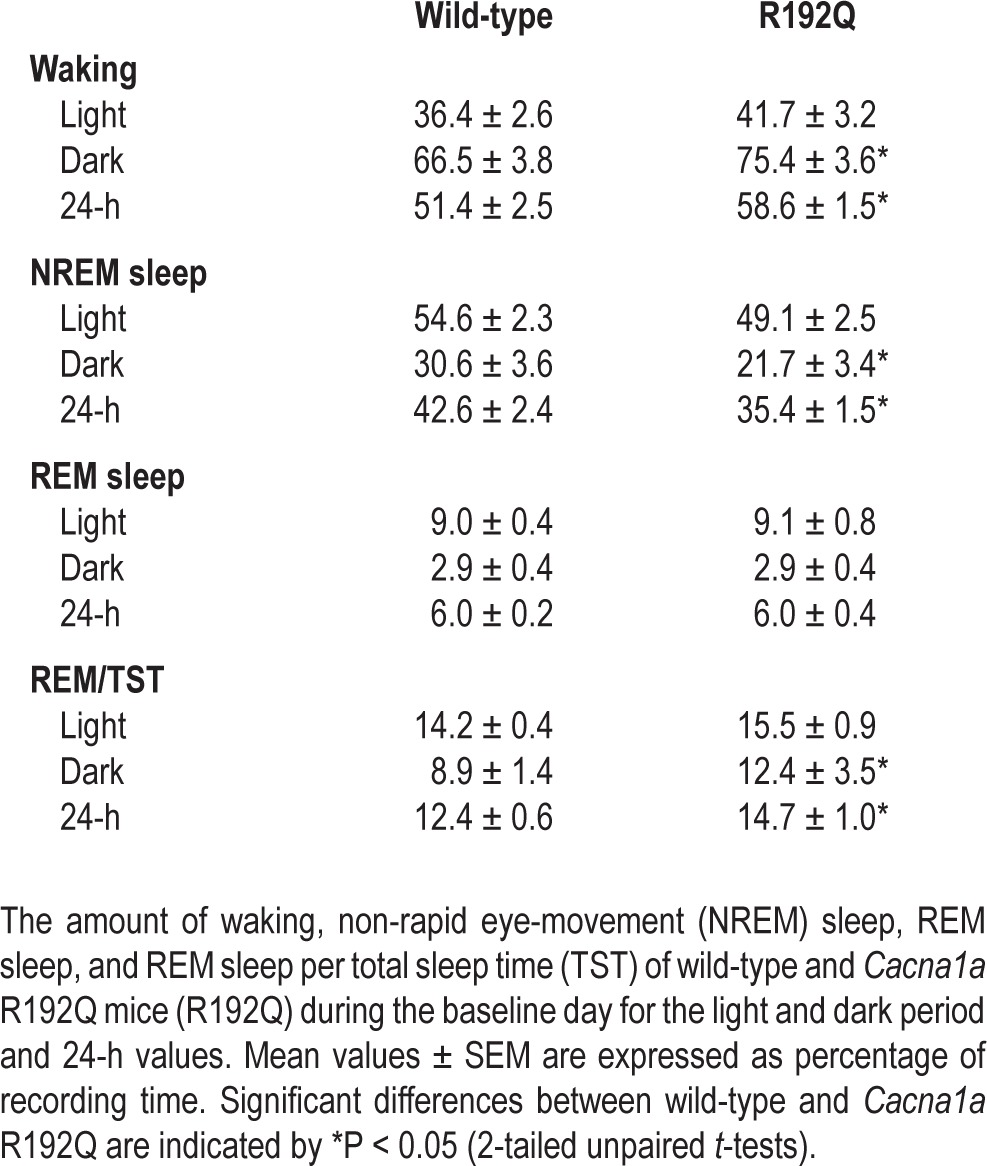
Figure 1.
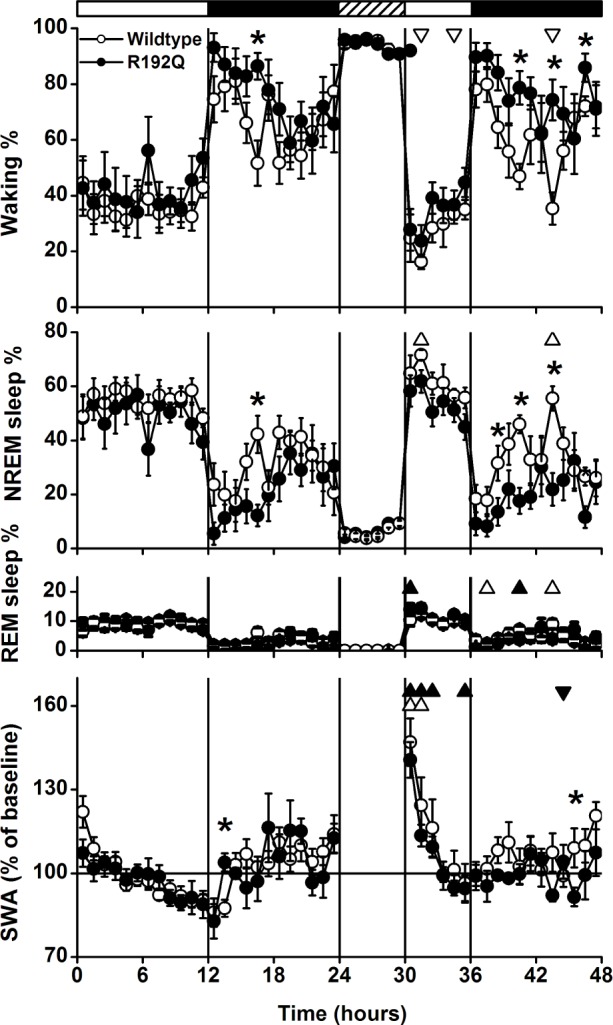
Time course of vigilance states and slow-wake activity (SWA, mean EEG power density between 0.75-4.0 Hz) in non-rapid eye movement (NREM) sleep for baseline, the 6-h sleep deprivation (SD, hatched bar) and 18-h recovery for the 2 genotypes (wild-type n = 8, R192Q n = 8). Curves connect mean 1-h values (mean ± SEM) of NREM sleep, REM sleep, waking and SWA in NREM sleep. SWA is expressed relative to the mean 24-h baseline value (= 100%). The vertical lines and black and white bars indicate the light dark cycle and the SD. Significant differences between baseline and recovery within a genotype are indicated by open (wild-type) and closed (R192Q) triangles (P < 0.05, 2-tailed paired t-test after significant analysis of variance [ANOVA] factor treatment). Orientation of triangles indicates the direction of deviation from baseline. Asterisks indicate significant differences between wild-type and Cacna1a R192Q (P < 0.05, 2-tailed t-test after significant ANOVA factor genotype).
Table 2.
Vigilance state episode frequency and duration
The time course of the vigilance states during the baseline day and the sleep deprivation experiment are illustrated in Figure 1. In the light period, the differences between wild-type and Cacna1a R192Q mice were relatively small. In the dark period, the differences between the 2 genotypes became larger, with significantly higher amounts of waking and lower amounts of NREM sleep in Cacna1a R192Q mice in the first half of the dark period. REM sleep did not show any significant difference between the 2 genotypes. Also no genotype differences were found in the relative amount of active waking (WT: 42.4% ± 8.6%, R192Q: 43.6% ± 5.5%, P = 0.20, 2-tailed paired t-test) and EEG power density spectra of the different vigilance states (Figure 2).
Figure 2.
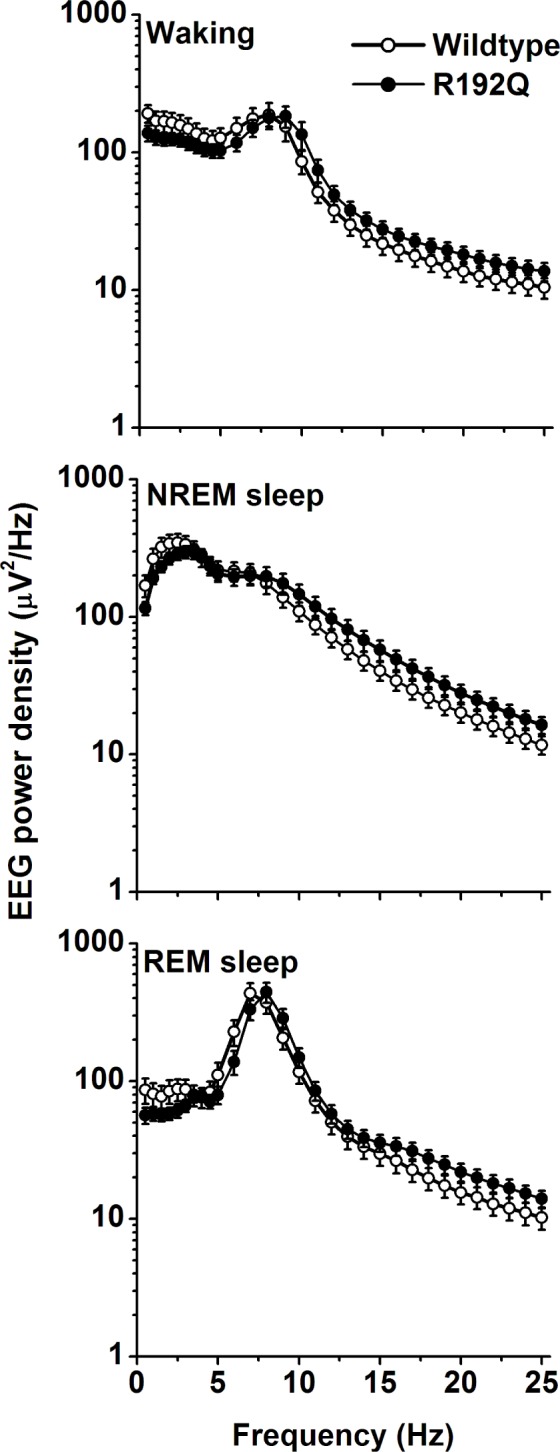
Spectral distribution of EEG power density in waking, NREM sleep, and REM sleep computed for pooled values of the 24-h baseline days. Values are plotted at the upper limit of each bin. The curves represent average values (± SEM) of absolute power densities. No significant differences were observed between wild-type and Cacna1a R192Q mice.
The Effect of Sleep Deprivation
During sleep deprivation the amount of waking and NREM sleep did not differ between wild-type and Cacna1a R192Q mice, indicating similar success in keeping the animals awake (Figure 1). In the remaining light period after the sleep deprivation, waking was reduced in both groups in a few 1-h intervals. The wild-type group also showed more NREM sleep and less waking in the dark period, and the difference between wild-type and Cacna1a R192Q mice became more pronounced. Both groups showed increased REM sleep in some of the 1-h intervals after the sleep deprivation.
The time course of SWA in NREM sleep did not show large differences between Cacna1a R192Q and wild-type mice (Figure 1). After sleep deprivation, both groups showed an initial increase in SWA, which gradually decreased in the course of the light period. SWA values in the Cacna1a R192Q mice remained above baseline for 3 h, whereas wild-type mice returned to baseline levels after 2 h.
Caffeine Treatment
After caffeine treatment, both Cacna1a R192Q and wild-type mice were more awake in the first hour (Figure 3A). Subsequently, however, Cacna1a R192Q mice showed significantly more NREM sleep in the second hour, indicating that they initiated sleep earlier than wild-type mice. This was confirmed by the difference in the latency to NREM sleep and REM sleep, which was significantly shorter in the Cacna1a R192Q mice than wild-type mice (Figure 3B, P < 0.05, 2-tailed t-test after significant ANOVA interaction condition*genotype). The NREM sleep and waking EEG power density spectra and SWA in NREM sleep did not differ significantly after caffeine or control injections between the two genotypes (data not shown). In both genotypes caffeine significantly lengthened latencies to NREM sleep and REM sleep (P < 0.05, 2-tailed paired t-test). After the control injection, no significant difference was found between wild-type mice and Cacna1a R192Q mice in the latency to NREM sleep.
Figure 3.
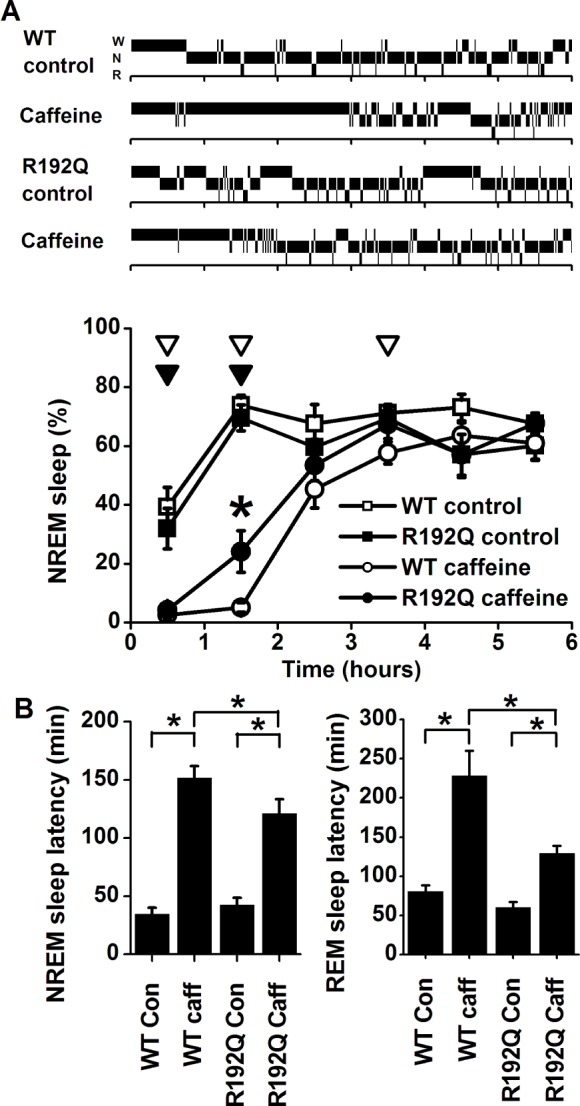
A: Top: Individual hypnograms of a wild-type (WT) and Cacna1a R192Q (R192Q) mouse during the first 6 h after saline (control) or caffeine injection showing the occurrence of waking (W), non-rapid eye movement (N) sleep, and REM (R) sleep in 1-min intervals. Bottom: Time course of non-rapid eye movement (NREM) sleep after injection with saline (control) or caffeine in wild-type (WT, n = 8) and Cacna1a R192Q mice (R192Q, n = 8). Curves connect mean 1-h values (± SEM) of NREM sleep during the first 6 h after the injection. Significant differences between control and caffeine are indicated by open (WT) or closed (R192Q) triangles (P < 0.05, 2-tailed paired t-test, after significant analysis of variance [ANOVA]). Orientation of triangles indicates the direction of deviation from baseline Asterisks indicate significant differences in NREM sleep between wild-type and Cacna1a R192Q (P < 0.05, 2-tailed t-test after significant ANOVA interaction treatment*genotype). B: Sleep latencies for NREM sleep (left) and REM sleep (right) after saline (Con) and caffeine (Caff) treatment in WT and R192Q mice. Asterisks indicate significant differences between treatment (P < 0.05, 2-tailed paired t-test) or wild-type and Cacna1a R192Q (P < 0.05, 2-tailed t-test after significant ANOVA interaction treatment*genotype P < 0.05).
Cyclopentyladenosine Treatment
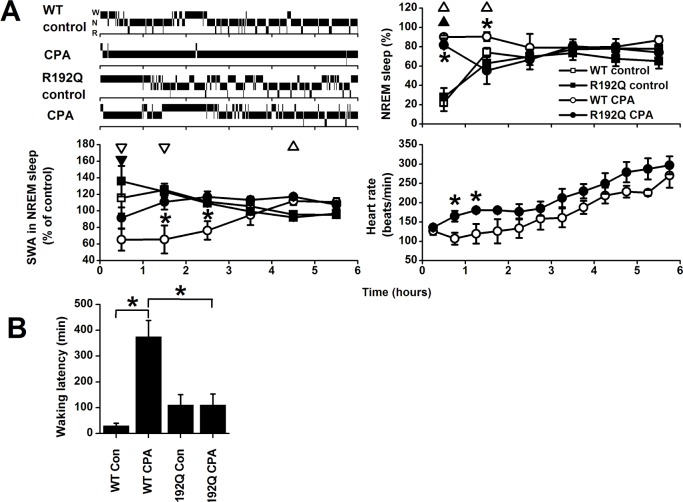
In the first hour after administration of CPA, both groups showed an increase in the amount of the NREM sleep-like state compared to saline (Figure 4A). However, wild-type mice showed significantly more of the NREM sleep-like state in the first 2 h after administration of CPA than Cacna1a R192Q mice, in which the amount of sleep dropped to control levels in the second hour after injection. Also, the latency to the wake-like state was shorter in the Cacna1a R192Q mice after CPA administration compared to wild-type mice (Figure 4B, P < 0.05, 2-tailed t-test after significant ANOVA interaction condition*genotype). The R192Q mice did not show an increase in waking latency, whereas in wild-type mice, the latency to waking showed a 10-fold increase after CPA injection (P < 0.05, 2-tailed paired t-test). After the control injection, no significant difference was found between wild-type and R192Q mice in the latency to waking.
Figure 4.
A. Top left: Individual hypnograms of a wild-type (WT) and Cacna1a R192Q (R192Q) mouse during the first 6 h after saline (control) or cyclopentyladenosine (CPA) injection showing the occurrence of waking (W), non-rapid eye movement (N) sleep, and REM (R) sleep in 1-min intervals. Time course of non-rapid eye movement (NREM) sleep-like state (Top right), slow wave activity (SWA) in the NREM sleep-like state (Bottom left), and heart rate in NREM sleep-like state (Bottom right) after injection with saline (control) or cyclopentyladenosine (CPA) in wild-type (WT, n = 6) and Cacna1a R192Q (R192Q) mice (n = 6). Curves connect mean 1-h values (± SEM) of NREM sleep and SWA and mean 30-min values of heart rate for the first 6 h after the injection. Significant differences between control and CPA are indicated by open (WT) or closed (R192Q) triangles (P < 0.05, 2-tailed paired t-test, after significant analysis of variance [ANOVA]). Orientation of triangles indicates the direction of deviation from baseline Asterisks indicate significant differences between wild-type and Cacna1a R192Q (P < 0.05, 2-tailed t-test after significant ANOVA interaction treatment*genotype). B: Latencies to waking or wake-like state after saline (Con) or CPA treatment in WT and R192Q mice. Asterisks indicate significant differences between treatment (P < 0.05, 2-tailed paired t-test) or wild-type and Cacna1a R192Q (P < 0.05, 2-tailed t-test after significant ANOVA interaction treatment*genotype P < 0.05).
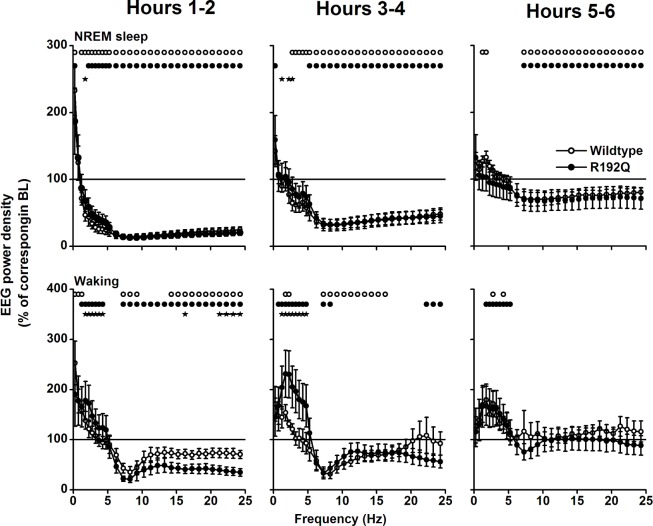
SWA in the NREM sleep-like state was suppressed in both genotypes in the first hour after CPA injection, but the suppression was more pronounced and lasted longer in wild-types (Figure 4A). Four hours after CPA treatment, SWA values were above control in wild-types. No differences between genotypes or control condition in SWA were observed after 6 h (data not shown). Spectral analysis showed that both EEG activity during the wake-like and NREM sleep-like state was lower in the first 4 h after CPA application in the frequencies above 2-4 Hz (NREM sleep) and 5 Hz (waking), but that activity in the slower frequencies was enhanced (Figure 5). Activity in the faster waking EEG frequencies normalized in hours 5-6 in waking, whereas in NREM sleep it remained below baseline. EEG activity in the slow wave range was above control in the wake-like state in the first 6 h in both genotypes. Activity in the NREM sleep slow wave range (1.25-2.0 Hz) was enhanced above baseline in wild-types in hours 5-6. Differences between wild-type and Cacna1a R192Q mice were found in hours 1-4 in the NREM sleep-like and wake-like state EEG slow wave range.
Figure 5.
Effects of CPA on the relative waking and NREM sleep-like state EEG power density spectra. The spectral distribution of relative EEG power density in NREM sleep (top panels) and waking (bottom panels) was computed for the first 6 h after injection of CPA in 2-h intervals. The mean values (± SEM) are plotted as percentage of corresponding intervals of the saline treatment. Significant differences with saline are indicated by circles (wild-type) or dots (R192Q, P < 0.05, 2-tailed paired t-test after significant ANOVA factor treatment). Significant differences between wild-type and Cacna1a R192Q are indicated by stars (P < 0.05, independent samples t-test after significant ANOVA factor genotype).
Monitoring of heart rate showed that the wild-type mice had a significantly lower heart rate during the NREM sleep-like state in the second and third 30-min interval after administration CPA (Figure 4A). For the first 6 h after CPA injection, in both genotypes heart rate levels were below those after control injection (P < 0.05, 2-tailed paired t-test). Average heart rate in NREM sleep during the first 6 h after control injection did not differ significantly between genotypes (WT: 407.0 ± 6.9 beats/min, R192Q: 392.8 ± 9.2 beats/min).
Simulations of Sleep Pressure
As a starting point in this study, the first simulation of Process S was based on the IV and time constants (Ti and Td) obtained previously in C57Bl/6J.5 Subsequently, the IV and the difference in Td between the light and dark period were iteratively changed until an optimum solution was observed.9,45 With regard to the IV, this did not result in a large difference between the genotypes (both at approximately 120% of baseline [Figure 6 top and middle panels], a difference of 0.1 [Figure 6 bottom panel]). The optimum difference in Td between light and dark were much larger for Cacna1a R192Q than wild-type mice (WT: 0.2, R192Q: 0.9). This means that in the simulation, the decrease of S during NREM sleep in the light period was slower in Cacna1a R192Q mice (WT: 3.5, R192Q: 4.2), whereas in the dark period it was faster than in wild-type (WT: 3.1, R192Q: 2.4). The simulations resulted in significant correlations between S and SWA in both genotypes (WT: r = 0.80, R192Q: r = 0.67; P < 0.05, t-tests). A comparison of the simulated time course of Process S of both genotypes reveals that S was higher throughout the entire day in Cacna1a R192Q mice (Figure 6 bottom panel), suggesting that the Cacna1a R192Q mice live under a higher sleep pressure than wild-type mice.
Figure 6.
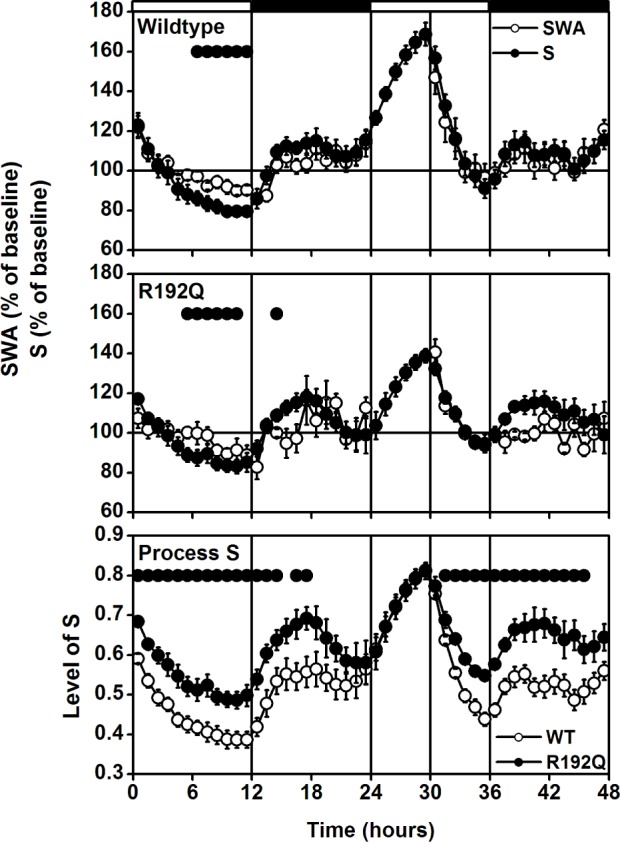
A 48-h record of EEG slow-wave activity (SWA, EEG power density between 0.75-4.0 Hz) in non-rapid eye movement (NREM) sleep and simulation of Process S for wild-type (top panel) and Cacna1a R192Q (R192Q) mice (middle panel). Curves connect 1-h mean values (± SEM) for the 24-h baseline day, 6-h sleep deprivation, and 18-h recovery. SWA in NREM sleep and the level of process S are expressed as a percentage of the 24-h baseline value (= 100%). The vertical lines and black and white bars indicate the light dark cycle and the SD. The SWA values are the same as in Figure 1. The bottom panel represents the hypothetical level of sleep pressure, based on the levels of Process S in the top and middle panel. Dots in the top and middle panel indicate where SWA and simulation differed significantly from each other (P < 0.05, 2-tailed paired t-test after significant ANOVA factor treatment). Dots in the bottom panel indicate where the simulated sleep pressure differed significantly between wild-type and Cacna1a R192Q (P < 0.05, 2-tailed t-test after significant ANOVA factor genotype).
DISCUSSION
The main findings of our study are that Cacna1a R192Q mice, which have a gain-of-function mutation in CaV2.1 Ca2+ channels, sleep less than wild-type mice, show reduced responsiveness to caffeine and CPA, and appear to live under a higher sleep pressure, suggesting that Cacna1a R192Q mice are less susceptible to stimulation via adenosinergic receptors. The CaV2.1 channel is known to be influenced by the A1 receptor via G-protein inhibition,19,46 and the lower sensitivity of the R192Q mutation to this inhibition25 is in accordance with the present findings. This suggests that adenosinergic G-protein inhibition of CaV2.1 channels contributes to increased sleep propensity and the initiation of sleep.
Cacna1a R192Q mice show more waking and less NREM sleep, whereas the amount of REM sleep is unchanged by the calcium channel mutation. The higher amount of waking is most prominent in the dark period, whereas during the light period waking levels were slightly above those of wild-types, albeit not statistically different. The increased waking in the dark period was caused by a significant lengthening of the waking episodes. Previous research has shown that Cacna1a R192Q mice do not differ in the amount of overt locomotor activity.37 Also, no apparent differences were found in the activity of EEG frequencies during the different vigilance states or the expression of SWA and brief awakenings during NREM sleep. The quality of waking, as analyzed by theta frequency activity in the waking EEG, also did not differ between genotypes. The difference in the amount of sleep is therefore not merely caused by hypermobility or hyperalertness of the Cacna1a R192Q mice. The data show that the regulation of the amount of NREM sleep and waking, but not the amount of REM sleep, seems to be influenced by the R192Q-mutated CaV2.1 channels.
Treatment with caffeine and CPA at the beginning of the light period showed that the R192Q mutation renders the animals less susceptible to stimulation or blocking of adenosine receptors. After treatment with caffeine, a general blocker of all adenosine receptors,15 Cacna1a R192Q mice initiated sleep significantly earlier than wild-type controls. The specific adenosine A1 receptor agonist CPA is known to increase the amount of NREM sleep, induce hypothermia,40 and decrease heart rate.47 After CPA treatment, Cacna1a R192Q mice showed more waking and higher SWA and faster heart rate than wild-type mice. The EEG spectral changes after CPA in both the waking and NREM sleep-like state are similar to changes observed in rats that received the same dose at room temperature without warming.40 This indicates that mice and rats respond in a similar way to CPA, but that warming of the floor of the cage during the present experiment, to prevent the mice from cooling, was less successful. After CPA administration, wild-type mice showed a significant suppression of SWA in the first two hours and a subsequent increase above the level after control injection, as was previously shown in rats.40 In Cacna1a R192Q mice the suppression in SWA lasted only 1 h and was not followed by an increase above the level after control injection, indicating that the R192Q mutation renders the mice less susceptible to adenosinergic inhibition.
The decreased susceptibility to changes in adenosine receptor signaling may explain the reduced amount of in NREM sleep in Cacna1a R192Q mice at baseline. The simulation of Process S showed that the simulated sleep pressure was systematically higher in Cacna1a R192Q mice than wild-types, suggesting that the Cacna1a R192Q mice have to cope with a higher sleep pressure than wild-type mice. This finding echoes similar findings obtained in a subpopulation of short-sleeping humans who were also found to live under a higher sleep pressure.48 As in our transgenic mice, no difference in absolute SWA was found between long and short sleeping humans, and only small differences in EEG power density spectra were observed.
In the simulation, the IV of S differed by 0.1 between wild-type and Cacna1a R192Q mice, indicating a chronic increase in sleep pressure in mutant mice. The higher Td in the light period in R192Q mice slowed down the decrease in S, whereas the lower Td in the dark period allowed a slower net increase of S in this part of the day. This genotypic difference may be caused by differences in the influence of light or a difference in the influence of the circadian clock on sleep homeostatic mechanisms, as shown previously in rats.9,45 In addition, we can not exclude that an undetected difference in the quality of waking may also have contributed to the genotype difference. The increased homeostatic sleep pressure in the Cacna1a R192Q mice corroborates the increased waking and reduced susceptibility to adenosinergic signaling in the R192Q mice.
The question remains whether the time course of the amount of NREM sleep and waking can be explained by changes in adenosine levels in the brain. Unfortunately there is no data on mouse brain adenosine levels available. In rats it was shown that stimulation of the adenosine A1 receptor can increase NREM sleep and induce increased slow wave activity in NREM sleep,40,49 suggesting a role for adenosine in sleep homeostatic mechanisms. In addition, adenosine levels gradually increase during sleep deprivation and decrease during recovery sleep,12,50 indicating that adenosine levels are dependent on prior waking duration and follow sleep homeostatic rules. It may therefore be that Cacna1a R192Q mice have a higher endogenous adenosine level. On the other hand, in rats it was found that baseline levels of adenosine do not respond to the duration of prior waking, but are high during the main waking period and low during the main sleep period.14 Although the latter is mainly in line with the sleep deprivation data, it indicates that under normal baseline conditions other major factors also affect sleep and waking. Obvious factors are the endogenous circadian clock, which induces a main sleep and wake period,51 and light availability, which is known to influence the occurrence of NREM sleep and REM sleep in rodents.38,–54 Both factors influence the amount and distribution of sleep and wakefulness in the present experiment, and may even overrule the influence of adenosine on sleep at certain times of the day and in certain parts of the experiments. After sleep deprivation, with high levels of adenosine, or during the light period, with low levels, no difference may be found between genotypes. However, differences may become apparent during the dark period at intermediate adenosine levels or when applied substances such as CPA and caffeine are slowly eliminated from the system.
It is unclear at present how sleep and migraine are linked. We showed before that Cacna1a R192Q mice adjust faster to an experimental “jet-lag” protocol37 and in humans, changes in sleep pattern and circadian rhythms, and sleep disturbances are reported triggers of migraine attacks.33,55,56 Of relevance, cortical spreading depression, which underlies the migraine aura in migraineurs, increases sleep need in the rat.57 Also, caffeine is connected to migraine, as among headache sufferers the relationship with caffeine use is the strongest in migraine patients,58 and adenosine A1 agonists were shown to inhibit trigeminovascular nociceptive transmission, which is believed to be the cause of migraine headaches.28 The present results suggest that low adenosine levels through napping, sleeping in, or hypersomnia reduces G-protein inhibition of CaV2.1 channels, which may lead to comorbidity of sleep disturbances and migraine. Connected to that, increased caffeine use may block adenosine receptors, causing both sleep disturbances and migraine.
The adenosine A1 and A2A receptor subtypes most likely mediate physiological effects of adenosine on sleep.15 The basal forebrain and the lateral hypothalamus are thought to be involved in the A1 adenosinergic influence on sleep, and both play an important role in sleep regulation.59 It is well known that adenosine in the basal forebrain increases during waking and decreases during sleep,12 and A1 receptor antagonists injected in the basal forebrain significantly reduce sleep.60 More recently it was shown that CPA changes neuronal activity in the lateral hypothalamus,61 suggesting that also in this brain area the A1 receptor may mediate the influence of adenosine on sleep. While the brain area involved in the present effect needs to be identified, our results suggest that inhibition of CaV2.1 channels may be part of the molecular pathway that mediates the physiological effects of adenosine on sleep.
In conclusion, our data suggest a role for CaV2.1 channels in the adenosinergic influence on sleep and waking. CaV2.1 channels may modulate the adenosine induced increased sleepiness and the initiation of sleep, providing a putative link between sleep homeostatic processes and migraine induction.
ACKNOWLEDGMENTS
The authors thank Joelle Oosterman and Davina White for their help with the experiments. This research was supported by the Netherlands Organization for Scientific Research [NWO, grant 818.02.016 (Dr. Deboer); Vici 918.56.602 (Dr. Ferrari)], and the Center of Medical System Biology (CMSB) established by the Netherlands Genomics Initiative/Netherlands Organization for Scientific Research (NGI/NWO) and Community (Drs. Ferrari and Van den Maagdenberg).
Footnotes
A commentary on this article appears in this issue on page 13.
DISCLOSURE STATEMENT
This was not an industry supported study. The authors have indicated no financial conflicts of interest.
REFERENCES
- 1.Achermann P, Borbely AA. Principles and practice of sleep medicine. 5th ed. St Louis: Elsevier-Saunders, ; 2011. Sleep homeostasis and models of sleep regulation. In: Kryger MH, Roth T, Dement WC, eds; pp. 431–44. [Google Scholar]
- 2.Tobler I, Borbely AA. Sleep EEG in the rat as a function of prior waking. Electroencephalogr Clin Neurophysiol. 1986;64:74–6. doi: 10.1016/0013-4694(86)90044-1. [DOI] [PubMed] [Google Scholar]
- 3.Dijk DJ, Beersma DG, Daan S. EEG power density during nap sleep: reflection of an hourglass measuring the duration of prior wakefulness. J Biol Rhythms. 1987;2:207–19. doi: 10.1177/074873048700200304. [DOI] [PubMed] [Google Scholar]
- 4.Strijkstra AM, Daan S. Dissimilarity of slow-wave activity enhancement by torpor and sleep deprivation in a hibernator. Am J Physiol. 1998;275:R1110–7. doi: 10.1152/ajpregu.1998.275.4.R1110. [DOI] [PubMed] [Google Scholar]
- 5.Huber R, Deboer T, Tobler I. Effects of sleep deprivation on sleep and sleep EEG in three mouse strains: empirical data and simulations. Brain Res. 2000;857:8–19. doi: 10.1016/s0006-8993(99)02248-9. [DOI] [PubMed] [Google Scholar]
- 6.Deboer T, Tobler I. Sleep regulation in the Djungarian hamster: comparison of the dynamics leading to the slow-wave activity increase after sleep deprivation and daily torpor. Sleep. 2003;26:567–72. doi: 10.1093/sleep/26.5.567. [DOI] [PubMed] [Google Scholar]
- 7.Lancel M, van Riezen H, Glatt A. Effects of circadian phase and duration of sleep deprivation on sleep and EEG power spectra in the cat. Brain Res. 1991;548:206–14. doi: 10.1016/0006-8993(91)91123-i. [DOI] [PubMed] [Google Scholar]
- 8.Achermann P, Dijk DJ, Brunner DP, Borbely AA. A model of human sleep homeostasis based on EEG slow-wave activity: quantitative comparison of data and simulations. Brain Res Bull. 1993;31:97–113. doi: 10.1016/0361-9230(93)90016-5. [DOI] [PubMed] [Google Scholar]
- 9.Franken P, Tobler I, Borbely AA. Sleep homeostasis in the rat: simulation of the time course of EEG slow-wave activity. Neurosci Lett. 1991;130:141–4. doi: 10.1016/0304-3940(91)90382-4. [DOI] [PubMed] [Google Scholar]
- 10.Franken P, Chollet D, Tafti M. The homeostatic regulation of sleep need is under genetic control. J Neurosci. 2001;21:2610–21. doi: 10.1523/JNEUROSCI.21-08-02610.2001. [DOI] [PMC free article] [PubMed] [Google Scholar]
- 11.Meijer JH, Rietveld WJ. Neurophysiology of the suprachiasmatic circadian pacemaker in rodents. Physiol Rev. 1989;69:671–707. doi: 10.1152/physrev.1989.69.3.671. [DOI] [PubMed] [Google Scholar]
- 12.Porkka-Heiskanen T, Strecker RE, Thakkar M, Bjorkum AA, Greene RW, McCarley RW. Adenosine: a mediator of the sleep-inducing effects of prolonged wakefulness. Science. 1997;276:1265–8. doi: 10.1126/science.276.5316.1265. [DOI] [PMC free article] [PubMed] [Google Scholar]
- 13.Huston JP, Haas HL, Boix F, et al. Extracellular adenosine levels in neostriatum and hippocampus during rest and activity periods of rats. Neuroscience. 1996;73:99–107. doi: 10.1016/0306-4522(96)00021-8. [DOI] [PubMed] [Google Scholar]
- 14.Murillo-Rodriguez E, Blanco-Centurion C, Gerashchenko D, Salin-Pascual RJ, Shiromani PJ. The diurnal rhythm of adenosine levels in the basal forebrain of young and old rats. Neuroscience. 2004;123:361–70. doi: 10.1016/j.neuroscience.2003.09.015. [DOI] [PubMed] [Google Scholar]
- 15.Landolt HP. Sleep homeostasis: a role for adenosine in humans? Biochem Pharmacol. 2008;75:2070–9. doi: 10.1016/j.bcp.2008.02.024. [DOI] [PubMed] [Google Scholar]
- 16.Fredholm BB, Irenius E, Kull B, Schulte G. Comparison of the potency of adenosine as an agonist at human adenosine receptors expressed in Chinese hamster ovary cells. Biochem Pharmacol. 2001;61:443–8. doi: 10.1016/s0006-2952(00)00570-0. [DOI] [PubMed] [Google Scholar]
- 17.Fredholm BB, Arslan G, Halldner L, Kull B, Schulte G, Wasserman W. Structure and function of adenosine receptors and their genes. Naunyn Schmiedebergs Arch Pharmacol. 2000;362:364–74. doi: 10.1007/s002100000313. [DOI] [PubMed] [Google Scholar]
- 18.Yaar R, Jones MR, Chen JF, Ravid K. Animal models for the study of adenosine receptor function. J Cell Physiol. 2005;202:9–20. doi: 10.1002/jcp.20138. [DOI] [PubMed] [Google Scholar]
- 19.Fredholm BB, Chen JF, Cunha RA, Svenningsson P, Vaugeois JM. Adenosine and brain function. Int Rev Neurobiol. 2005;63:191–270. doi: 10.1016/S0074-7742(05)63007-3. [DOI] [PubMed] [Google Scholar]
- 20.Fredholm BB, Chen JF, Masino SA, Vaugeois JM. Actions of adenosine at its receptors in the CNS: insights from knockouts and drugs. Annu Rev Pharmacol Toxicol. 2005;45:385–412. doi: 10.1146/annurev.pharmtox.45.120403.095731. [DOI] [PubMed] [Google Scholar]
- 21.Mintz IM, Sabatini BL, Regehr WG. Calcium control of transmitter release at a cerebellar synapse. Neuron. 1995;15:675–88. doi: 10.1016/0896-6273(95)90155-8. [DOI] [PubMed] [Google Scholar]
- 22.Wu LG, Westenbroek RE, Borst JG, Catterall WA, Sakmann B. Calcium channel types with distinct presynaptic localization couple differentially to transmitter release in single calyx-type synapses. J Neurosci. 1999;19:726–36. doi: 10.1523/JNEUROSCI.19-02-00726.1999. [DOI] [PMC free article] [PubMed] [Google Scholar]
- 23.Ophoff RA, Terwindt GM, Vergouwe MN, et al. Familial hemiplegic migraine and episodic ataxia type-2 are caused by mutations in the Ca2+ channel gene CACNL1A4. Cell. 1996;87:543–52. doi: 10.1016/s0092-8674(00)81373-2. [DOI] [PubMed] [Google Scholar]
- 24.van den Maagdenberg AM, Pietrobon D, Pizzorusso T, et al. A Cacna1a knockin migraine mouse model with increased susceptibility to cortical spreading depression. Neuron. 2004;41:701–10. doi: 10.1016/s0896-6273(04)00085-6. [DOI] [PubMed] [Google Scholar]
- 25.Melliti K, Grabner M, Seabrook GR. The familial hemiplegic migraine mutation R192Q reduces G-protein-mediated inhibition of P/Q-type (Ca(V)2.1) calcium channels expressed in human embryonic kidney cells. J Physiol. 2003;546:337–47. doi: 10.1113/jphysiol.2002.026716. [DOI] [PMC free article] [PubMed] [Google Scholar]
- 26.Weiss N, Sandoval A, Felix R, Van den Maagdenberg A, De Waard M. The S218L familial hemiplegic migraine mutation promotes deinhibition of Ca(v)2.1 calcium channels during direct G-protein regulation. Pflugers Arch. 2008;457:315–26. doi: 10.1007/s00424-008-0541-2. [DOI] [PMC free article] [PubMed] [Google Scholar]
- 27.Society HCSotIH. The international classification of headache disorders 2nd edition. Cephalalgia. 2004;24:9–160. doi: 10.1111/j.1468-2982.2003.00824.x. [DOI] [PubMed] [Google Scholar]
- 28.Goadsby PJ, Lipton RB, Ferrari MD. Migraine--current understanding and treatment. N Engl J Med. 2002;346:257–70. doi: 10.1056/NEJMra010917. [DOI] [PubMed] [Google Scholar]
- 29.Kaja S, van de Ven RC, Broos LA, et al. Gene dosage-dependent transmitter release changes at neuromuscular synapses of CACNA1A R192Q knockin mice are non-progressive and do not lead to morphological changes or muscle weakness. Neuroscience. 2005;135:81–95. doi: 10.1016/j.neuroscience.2005.04.069. [DOI] [PubMed] [Google Scholar]
- 30.Tottene A, Conti R, Fabbro A, et al. Enhanced excitatory transmission at cortical synapses as the basis for facilitated spreading depression in Ca(v)2.1 knockin migraine mice. Neuron. 2009;61:762–73. doi: 10.1016/j.neuron.2009.01.027. [DOI] [PubMed] [Google Scholar]
- 31.Bolay H, Reuter U, Dunn AK, Huang Z, Boas DA, Moskowitz MA. Intrinsic brain activity triggers trigeminal meningeal afferents in a migraine model. Nat Med. 2002;8:136–42. doi: 10.1038/nm0202-136. [DOI] [PubMed] [Google Scholar]
- 32.Fox AW, Davis RL. Migraine chronobiology. Headache. 1998;38:436–41. doi: 10.1046/j.1526-4610.1998.3806436.x. [DOI] [PubMed] [Google Scholar]
- 33.Overeem S, van Vliet JA, Lammers GJ, Zitman FG, Swaab DF, Ferrari MD. The hypothalamus in episodic brain disorders. Lancet Neurol. 2002;1:437–44. doi: 10.1016/s1474-4422(02)00191-6. [DOI] [PubMed] [Google Scholar]
- 34.Jones CR, Campbell SS, Zone SE, et al. Familial advanced sleep-phase syndrome: a short-period circadian rhythm variant in humans. Nat Med. 1999;5:1062–5. doi: 10.1038/12502. [DOI] [PubMed] [Google Scholar]
- 35.Xu Y, Padiath QS, Shapiro RE, et al. Functional consequences of a CKIdelta mutation causing familial advanced sleep phase syndrome. Nature. 2005;434:640–4. doi: 10.1038/nature03453. [DOI] [PubMed] [Google Scholar]
- 36.Shapiro RE, Waheed W, Nagle K. Cephalalgia . 1999. A novel familial syndrome of migraine with aura, flushing spells, myalgias, asthma and the advances sleep phase syndrome; p. 19. [Google Scholar]
- 37.van Oosterhout F, Michel S, Deboer T, et al. Enhanced circadian phase resetting in R192Q Cav2.1 calcium channel migraine mice. Ann Neurol. 2008;64:315–24. doi: 10.1002/ana.21418. [DOI] [PubMed] [Google Scholar]
- 38.Deboer T, Ruijgrok G, Meijer JH. Short light-dark cycles affect sleep in mice. Eur J Neurosci. 2007;26:3518–23. doi: 10.1111/j.1460-9568.2007.05964.x. [DOI] [PubMed] [Google Scholar]
- 39.Deboer T, Fontana A, Tobler I. Tumor necrosis factor (TNF) ligand and TNF receptor deficiency affects sleep and the sleep EEG. J Neurophysiol. 2002;88:839–46. doi: 10.1152/jn.2002.88.2.839. [DOI] [PubMed] [Google Scholar]
- 40.Schwierin B, Borbely AA, Tobler I. Effects of N6-cyclopentyladenosine and caffeine on sleep regulation in the rat. Eur J Pharmacol. 1996;300:163–71. doi: 10.1016/0014-2999(96)00021-0. [DOI] [PubMed] [Google Scholar]
- 41.Deboer T, Tobler I. Natural hypothermia and sleep deprivation: common effects on recovery sleep in the Djungarian hamster. Am J Physiol. 1996;271:R1364–71. doi: 10.1152/ajpregu.1996.271.5.R1364. [DOI] [PubMed] [Google Scholar]
- 42.Deboer T, Franken P, Tobler I. Sleep and cortical temperature in the Djungarian hamster under baseline conditions and after sleep deprivation. J Comp Physiol [A] 1994;174:145–55. doi: 10.1007/BF00193782. [DOI] [PubMed] [Google Scholar]
- 43.Franken P, Dijk DJ, Tobler I, Borbely AA. Sleep deprivation in rats: effects on EEG power spectra, vigilance states, and cortical temperature. Am J Physiol. 1991;261:R198–208. doi: 10.1152/ajpregu.1991.261.1.R198. [DOI] [PubMed] [Google Scholar]
- 44.Huber R, Deboer T, Tobler I. Prion protein: a role in sleep regulation? J Sleep Res. 1998;8(Suppl 1):30–6. doi: 10.1046/j.1365-2869.1999.00006.x. [DOI] [PubMed] [Google Scholar]
- 45.Deboer T. Sleep and sleep homeostasis in constant darkness in the rat. J Sleep Res. 2009;18:357–64. doi: 10.1111/j.1365-2869.2008.00728.x. [DOI] [PubMed] [Google Scholar]
- 46.Jacobson KA, Gao ZG. Adenosine receptors as therapeutic targets. Nat Rev Drug Discov. 2006;5:247–64. doi: 10.1038/nrd1983. [DOI] [PMC free article] [PubMed] [Google Scholar]
- 47.Schindler CW, Karcz-Kubicha M, Thorndike EB, et al. Role of central and peripheral adenosine receptors in the cardiovascular responses to intraperitoneal injections of adenosine A1 and A2A subtype receptor agonists. Br J Pharmacol. 2005;144:642–50. doi: 10.1038/sj.bjp.0706043. [DOI] [PMC free article] [PubMed] [Google Scholar]
- 48.Aeschbach D, Cajochen C, Landolt H, Borbely AA. Homeostatic sleep regulation in habitual short sleepers and long sleepers. Am J Physiol. 1996;270:R41–53. doi: 10.1152/ajpregu.1996.270.1.R41. [DOI] [PubMed] [Google Scholar]
- 49.Benington JH, Kodali SK, Heller HC. Stimulation of A1 adenosine receptors mimics the electroencephalographic effects of sleep deprivation. Brain Res. 1995;692:79–85. doi: 10.1016/0006-8993(95)00590-m. [DOI] [PubMed] [Google Scholar]
- 50.Porkka-Heiskanen T, Strecker RE, McCarley RW. Brain site-specificity of extracellular adenosine concentration changes during sleep deprivation and spontaneous sleep: an in vivo microdialysis study. Neuroscience. 2000;99:507–17. doi: 10.1016/s0306-4522(00)00220-7. [DOI] [PubMed] [Google Scholar]
- 51.Mistlberger RE. Circadian regulation of sleep in mammals: role of the suprachiasmatic nucleus. Brain Res Brain Res Rev. 2005;49:429–54. doi: 10.1016/j.brainresrev.2005.01.005. [DOI] [PubMed] [Google Scholar]
- 52.Benca RM, Gilliland MA, Obermeyer WH. Effects of lighting conditions on sleep and wakefulness in albino Lewis and pigmented Brown Norway rats. Sleep. 1998;21:451–60. doi: 10.1093/sleep/21.5.451. [DOI] [PubMed] [Google Scholar]
- 53.Tobler I, Borbely AA. Short light-dark cycles and paradoxical sleep in the rat: effect of strain difference and hypophysectomy. Behav Biol. 1978;23:395–8. doi: 10.1016/s0091-6773(78)91435-9. [DOI] [PubMed] [Google Scholar]
- 54.Tobler I, Borbely AA. Enhancement of paradoxical sleep by short light periods in the golden hamster. Neurosci Lett. 1977;6:275–7. doi: 10.1016/0304-3940(77)90083-0. [DOI] [PubMed] [Google Scholar]
- 55.Bruni O, Galli F, Guidetti V. Sleep hygiene and migraine in children and adolescents. Cephalalgia. 1999;19(Suppl 25):57–9. doi: 10.1177/0333102499019s2516. [DOI] [PubMed] [Google Scholar]
- 56.Calhoun AH, Ford S. Behavioral sleep modification may revert transformed migraine to episodic migraine. Headache. 2007;47:1178–83. doi: 10.1111/j.1526-4610.2007.00780.x. [DOI] [PubMed] [Google Scholar]
- 57.Faraguna U, Nelson A, Vyazovskiy VV, Cirelli C, Tononi G. Unilateral cortical spreading depression affects sleep need and induces molecular and electrophysiological signs of synaptic potentiation in vivo. Cereb Cortex. 2010;20:2939–47. doi: 10.1093/cercor/bhq041. [DOI] [PMC free article] [PubMed] [Google Scholar]
- 58.Schonewille WJ. [Chronic daily headaches caused by too much caffeine] Ned Tijdschr Geneeskd. 2002;146:1861–3. [PubMed] [Google Scholar]
- 59.Saper CB, Chou TC, Scammell TE. The sleep switch: hypothalamic control of sleep and wakefulness. Trends Neurosci. 2001;24:726–31. doi: 10.1016/s0166-2236(00)02002-6. [DOI] [PubMed] [Google Scholar]
- 60.Gass N, Porkka-Heiskanen T, Kalinchuk AV. The role of the basal forebrain adenosine receptors in sleep homeostasis. Neuroreport. 2009;20:1013–8. doi: 10.1097/WNR.0b013e32832d5859. [DOI] [PubMed] [Google Scholar]
- 61.Rai S, Kumar S, Alam MA, Szymusiak R, McGinty D, Alam MN. A1 receptor mediated adenosinergic regulation of perifornical-lateral hypothalamic area neurons in freely behaving rats. Neuroscience. 2010;167:40–8. doi: 10.1016/j.neuroscience.2010.01.044. [DOI] [PMC free article] [PubMed] [Google Scholar]


