

Abstract
Study Objectives:
To assess how alcohol affects multiple sleep latency tests (MSLT) and subjective measures of stimulation/sedation when alcohol is given at different circadian phases.
Participants:
Twenty-seven healthy young adults (age 21-26 yr) were studied.
Design:
Double-blind placebo and alcohol (vodka tonic targeting 0.05 g% concentration) beverages were each administered three times during the 20-h forced desynchrony protocol. Sleep latency tests and Biphasic Effects of Alcohol Scale (BAES) were administered on each forced desynchrony day. The outcome variables for this study include sleep onset latency (SOL) and stimulation and sedation value (from the BAES). Each outcome variable was associated with the ascending or descending limb of the breath alcohol concentration (BrAC) curve and assigned a circadian phase within a 90° bin.
Measurements and Results:
BrAC confirmed targeted maximal levels. Only outcome variables associated with the ascending and descending limb of the alcohol curve were analyzed for this article. Alcohol administered at a circadian time associated with greatest sleepiness showed longer SOL compared with placebo when measured on the ascending limb of the BrAC curve. We also found longer SOL with alcohol on the ascending limb of the BrAC curve in a circadian bin that favors greatest alertness. We observed shorter SOLs on the descending limb of the BrAC curve, but with no circadian phase interaction. The subjective data were partially consistent with the objective data.
Conclusions:
The physiologic findings in this study support the biphasic stimulating and sedating properties of alcohol, but limit the effect to specific circadian times.
Citation:
Van Reen E; Rupp TL; Acebo C; Seifer R; Carskadon MA. Biphasic effects of alcohol as a function of circadian phase. SLEEP 2013;36(1):137-145.
Keywords: Alcohol, multiple sleep latency test, biphasic effects, circadian phase, stimulation/sedation
INTRODUCTION
The most common use of alcohol is in recreational and social settings, where its actions of initial stimulation and mild euphoria are primary. On the other hand, many individuals use alcohol as a sleep aid for its soporific effects. We examine alcohol's dual actions in this experiment as a function of circadian phase of administration.
The Biphasic Alcohol Effects Scale (BAES) was developed to measure subjective ratings of alcohol sedation and stimulation, and the BAES shows a pattern of stimulant effects on the ascending limb of the breath alcohol concentration (BrAC) curve and sedative effects on the descending limb of the BrAC curve with moderate doses of alcohol.1 Studies attempting to demonstrate biphasic effects of alcohol on physiologic measures (i.e., waking electrocardiogram, EEG) have produced inconsistent results.2–4 For example, Lukas and Mendelson2 and Cohen et al.3 showed increased alpha2 and beta activity3 in the waking EEG on the ascending limb of the BrAC curve, whereas Ehlers and colleagues4 showed no consistent changes in the waking EEG as a function of the BrAC curve.
Greater success teasing apart the biphasic effect was found in one study that measured physiologic (multiple sleep latency test, MSLT) sleepiness/alertness following morning (09:00, 2 h after wake time) alcohol (vodka; 0.75g/kg) or placebo administration in adult men.5 BrAC, BAES, and the Stanford Sleepiness Scale (SSS) were acquired before each sleep latency test (SLT). Sleep onset latency (SOL) values associated with peak BrACs (peak of the ascending limb) and BrACs on the descending limb of the curve were compared. SOLs associated with peak BrAC phase were longer, and SOLs associated with the descending limb of the BrAC were shorter with alcohol compared with placebo. The SSS showed no statistically significant finding associated with drink condition; however, there was a main effect of time since drinking with greater reported sedation associated with peak BrAC tests compared with descending limb tests regardless of drink condition. The BAES stimulation scale showed no statistically significant association with BrAC. The sedation scale ratings were higher with alcohol compared with placebo regardless of phase on the BrAC curve, although the interaction term identified lower sedation ratings with alcohol at the peak BrAC phase compared with the descending phase. These BAES data are consistent with other findings that show higher sedation ratings on the descending limb of the BrAC curve compared with ratings on the ascending curve.1
Another study examined soporific and stimulant effects of alcohol using introspective (BAES, SSS, and visual analog scale) and physiological sleepiness measures (MSLT) following evening alcohol or placebo administration in young adults controlling for circadian phase.6 Alcohol (vodka; 0.54 g/kg for men; 0.49 g/kg for women) or placebo beverage was consumed ending approximately 14.5 h after waking and 40 min after dim light melatonin onset (DLMO). Measures were performed before alcohol and for 5 h thereafter. As expected, stimulation decreased and sleepiness and sedation increased in parallel with length of time awake with alcohol and placebo. Subjective sleepiness ratings and the BAES sedation measures showed greater sleepiness and sedation after alcohol compared with placebo consistent with previous findings; however, in contrast to the morning alcohol administration, the SOL did not differ between alcohol and placebo, nor did a biphasic pattern emerge. These findings led the authors to conclude that the effects on physiological sleepiness of a moderate dose of alcohol were masked when sleep-wake homeostatic drive and circadian phase promote high levels of sleepiness.
Although inconsistencies between the studies by Papineau et al.5 (alcohol administered in the morning) and Rupp et al.6 (alcohol administered in the evening) indicate that time of day of drink administration may play a critical role regarding how stimulation and sleepiness/sedation are affected by alcohol, they do not permit the independent evaluation of circadian timing. Several studies have examined physiological MSLT sleepiness when alcohol is given at different times of day without assessing the biphasic properties of alcohol. Roehrs and colleagues,7 for example, measured SOL with the MSLT following alcohol (dose = 0.5g/kg) or placebo administered at 09:00 and 17:00 in young adult males. A decrease in SOL on serial measures taken at 2-h intervals for 6 h was seen when alcohol was administered at 09:00 but not at 17:00. This comparison offers a third time of day to the studies of Papineau et al.5 and Rupp et al.6 and provides additional evidence that the timing of alcohol administration is important to its effects on SOL.
One explanation for these findings, for example, is that the sedating effects of alcohol are blunted when administered during the circadian wake-maintenance zone (17:00 clock-time) even though awake for approximately 10 h, but not when administered in the morning, even though only awake for approximately 2 h. Although this study compares the time of day at which beverage was administered, the circadian time is unknown.
We previously evaluated sleep architecture effects of alcohol in a well controlled circadian study8 using a 20-hour forced desynchrony (FD) protocol. FD provides access to the independent contributions of the homeostatic and circadian processes because the timing of sleep and wake vary across circadian phases due to the imposition of a non-24-h day length (e.g., 20 h). The primary finding from these analyses was that alcohol administered 10 h after waking (the highest homeostatic load for this study) at 04:00 (trough of circadian alertness) significantly increased the amount of waking within the 6-h sleep episode compared with placebo. Although the time course of the effect was not examined (nor were alcohol levels at this circadian phase available during sleep), this finding demonstrates differential sensitivity of the sleep system with alcohol administered at this circadian phase.
In summary, when the stimulant, sedating, and sleep related effects of alcohol are studied at different times, important differences emerge; the question remains how sleepiness, stimulation, and sedation are affected at different circadian phases while controlling for homeostatic loads and whether the circadian phase of beverage administration affects the biphasic effects of alcohol. Dose of alcohol and sex of participants also varied among studies and should be considered when interpreting these findings. The goal of the current study is to describe physiological sleepiness (using the MSLT) and subjective measures of stimulation/sedation (BAES) when alcohol is given at different circadian phases while controlling for time awake (e.g., homeostatic load). We use a 20-h FD protocol because the FD protocol allows us to examine the contribution of circadian phase independent from factors that also affect sleepiness, such as homeostatic load. These data may speak to why people choose to drink at certain times of the day, and they may also provide insight about whether consuming alcohol at certain circadian phases increases risk of sedation.
We anticipate that the stimulant and sedative effects of alcohol will vary as a function of the alcohol absorption/metabolism curve (e.g., ascending or descending limbs) and circadian phase. Previous studies1,5 indicate that, compared with placebo, physiological sleepiness will be least and subjective stimulation greatest on the ascending limb of the BrAC curve; conversely, physiological sleepiness and subjective sedation will be greater on the descending limb of the BrAC curve. These previous studies, however, provide little guidance to predict an interaction with circadian phase. Studies giving alcohol at different times of day show differential effects on physiological sleepiness and sleep architecture,7,8 suggesting that circadian phase may affect physiological sleepiness; however, the nature of these effects is difficult to predict because the timing of alcohol administration in those studies is confounded with homeostatic load.
METHODS
Additional details of the methods can be found in the study by Van Reen et al.8; a summary is presented here.
Participants
Healthy young adult volunteers ages 21 to 26 yr were evaluated with telephone screening and subsequent questionnaires and interviews. Inclusion criteria were self-report of consuming alcoholic beverages on at least two occasions per mo and at least two drinks per occasion, but averaging no more than 14 drinks per wk. Exclusion criteria were family or personal history of alcohol abuse/dependence; current or a personal history of psychopathology (e.g., schizophrenia or bipolar disorder), chronic medical conditions (e.g., diabetes or cancer), neurological disorders, or a family history of psychopathology; pregnant women and individuals with abnormal liver function, known sensitivity to alcohol or individuals taking medications or drugs that affect the sleep/wake cycle or who smoked; reports of irregular sleep patterns; travel beyond two time zones within 3 mo before the scheduled in-laboratory nights; excessive daytime sleepiness (manifested by two or more naps per wk); and/or a personal or family history of narcolepsy.
Twenty-seven healthy young adults (females = 9) ages 21-26 yr participated in this study. The Lifespan Institutional Review Board for the Protection of Human Subjects approved the protocol for this study, and informed consent was obtained from all participants. Participants received monetary compensation.
Procedures
At-Home Protocol
All participants slept on a fixed 9-h (23:00-08:00) stabilization sleep schedule for at least 12 nights at home before coming into the laboratory. Adherence to the schedule was confirmed by actigraphy, sleep diaries, and evening and morning phone calls to the laboratory's time-stamped answering machine. Participants subsequently stayed in the laboratory continuously for 13 consecutive nights and the intervening 12 days beginning with an adaptation night. The 9-h (23:00-08:00) adaptation night was used to screen for sleep disordered breathing and periodic limb movements and to allow participants to adapt to sleeping in the laboratory.
FD Schedule
A 20-h FD schedule began immediately upon waking after adaptation night and continued for 12 cycles8 (Figure 1), with two thirds (13 h, 20 min) of each cycle awake and one third (6 h, 40 min) scheduled for sleep. Thus, participants were awakened at 08:00 on FD1, stayed awake until scheduled bedtime at 21:20, awakened to begin FD2 at 04:00, and so forth, processing 4 h each “day” in real time. MSLTs were administered every FD day starting 2.5 h after waking and then every 2 h until six SLTs were administered. Participants were not told the time of day while in the laboratory to minimize expectancies based on knowledge of time. By completing 12 cycles on a 20-h-day length, participants completed two full cycles in which the timing of the sleep/wake schedule on FD days 1-6 was repeated on FD days 7-12.
Figure 1.
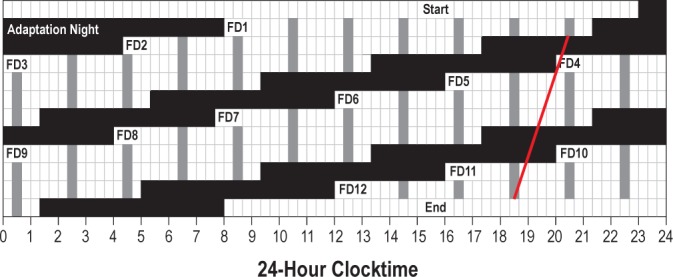
A schematic of the 12 forced desynchrony (FD) cycles demonstrating that FD cycles 1-6 are repeated in FD cycles 7-12. Black bars indicate sleep episodes, white cells show scheduled wake, and scheduled multiple sleep latency tests (MSLTs) are shown in gray. The white line shows the regression fit through melatonin onset phases for a participant whose circadian period was 23.8 h.
The light level (incandescent) in the laboratory was less than 15 lux during the waking parts of the protocol and less than 1 lux during scheduled h of sleep to minimize masking effects of light on circadian rhythms and to avoid suppressing melatonin production.
Alcohol Administration Protocol
Alcohol and placebo administrations were counterbalanced among participants across the protocol to occur on three occasions that varied by length of time awake, but were at the same clock times within a group. Thus, groups of participants received the beverages at specific times of day: 04:00, 10:00, 16:00, or 22:00.
Participants were not told they would receive a placebo beverage but that they would receive either a low or moderate dose of alcohol to control for alcohol expectancies. The alcohol beverage (moderate dose) was vodka (Smirnoff 80 proof) mixed with chilled tonic water in a 1:4 ratio with a wedge of lime placed in the drink. The placebo beverage (low dose) was a chilled tonic and lime drink of the same volume with three drops of vodka floated on the surface just before serving. The moderate dose of alcohol was calculated taking into account body weight and sex (men = 0.54 g/kg, women = 0.49 g/kg) and was formulated to achieve a maximum breath alcohol concentration of 0.05 g%. The dose of alcohol used in this protocol is considered a moderate dose equivalent to about two or three standard drinks. Beverage administration was double-blind; the staff person who prepared the drinks did not interact with participants and did not disclose beverage content to staff members administering the drinks. Because rise time was scheduled 4 h earlier on each cycle of the FD, the time of alcohol administration relative to sleep differed across cycles; however, each participant received placebo and alcohol at comparable times relative to sleep.
Breath Alcohol Concentration
BrAC was measured using a handheld breathalyzer (Intoximeters, Inc., St. Louis, MO). BrACs were measured approximately every 30 min for 5.5 h or until bedtime following beverage administrations. BrACs were not revealed to the participants and were seen and recorded by the staff person who prepared the drinks only. For analyses, the BrACs closest to the start of corresponding SLTs were used.
Multiple Sleep Latency Test
The MSLT was used to measure sleep propensity.9 MSLT recordings included central and occipital referential EEG derivations (C3/A2 and C4/A1 and O1/A2 and O2/A1), along with right and left electrooculogram (EOG), electromyogram (EMG; mentalis, submentalis), and electrocardiogram (ECG). EEG electrode placements were measured using the international 10-20 system10 and participants were continuously recorded and monitored during the MSLTs. EEG signals were filtered with Grass Model 8 amplifiers (high-pass EEG filter, 0.3 Hz; low-pass EEG filter, 35 Hz; notch filter 60 Hz; sampling resolution of 128 Hz) (Grass, West Warwick, RI). The Albert Grass Heritage System (Astromed, Grass) was used for all digital polysomnography recordings; EEG signals were digitized on-line (12-bit analog-to-digital converter; butterworth filter, _12 dB/octave; low-pass filter, _6 dB at 35 Hz; time constant 1.0 second; storage—resolution of 128 Hz for the EEG). MSLTs were scored (blind to alcohol condition) visually from paper records off-line in 30-sec epochs using C3/A2, EOG, and EMG tracings according to the criteria of Rechtschaffen and Kales.11
Each participant was put to bed (seated at a 45° angle with knees up 3 inches) in an individual bedroom and given the instructions to “lie quietly, keep your eyes closed, and try to fall asleep.” The light level was less than 1 lux. SLTs were ended after three consecutive epochs of sleep (including Stage 1) or the first epoch of Stage 2 sleep; otherwise, tests continued for 20 min. The primary outcome measure was latency from lights out to the first epoch of any sleep stage (> 15 sec of sleep). Six SLTs occurred on each FD day spaced at 2-h intervals; however, only the SLTs that occurred after beverage administration were examined in this article (SLT-A and SLT-B). SLT-A was performed on the ascending limb of the BrAC curve and SLT-B was performed on the descending limb (Figure 2).
Figure 2.
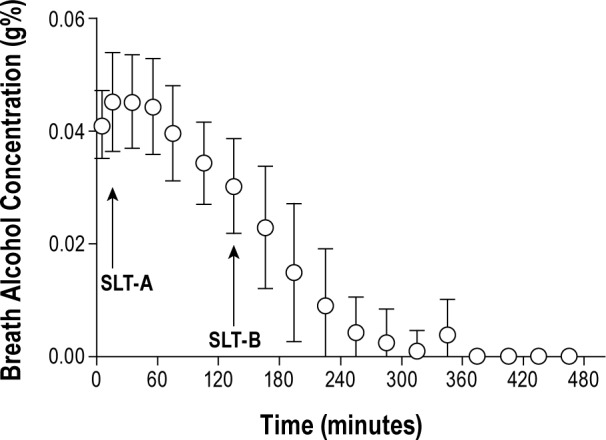
Mean and standard deviation of breath alcohol concentrations (g%) for time since alcohol consumption for all participants. Timing of SLT-A and SLT-B is indicated by arrows. SLT, sleep latency test.
As shown in Figure 2, SLT-A occurred 15 min after beverage administration, and SLT-B occurred 2 h, 15 min after beverage administration. The study design included placing beverage administration at different times after waking: 2.5, 4.5, 6.5, 8.5, 10.5, 12.5, and 13.33. The associated MSLT data are binned for homeostatic load as homeostatic bins 1-6 for the tests proximal to drinking (e.g., SLT-A) and homeostatic bins 2-7 for the second tests after drinking (e.g., SLT-B). The seventh homeostatic bin used values taken from the bedtime sleep latency, rather than MSLT, which occurred only 50 min after the last SLT. Higher values on the SLT indicate increased alertness and imply increased stimulation, whereas, lower values on the SLT indicate increased sleepiness and imply increased sedation.
Biphasic Alcohol Effects Scale
The BAES is an adjective rating scale containing two unipolar subscales designed to measure alcohol stimulation and sedation.1 Participants rate the extent (0 to 10 scale) to which they experience feelings named by each of 14 adjectives at the time the scale is administered. Seven stimulation adjectives are “elated,” “energized,” “excited,” “stimulated,” “talkative,” “up,” and “vigorous;” and seven sedation adjectives are “difficulty concentrating,” “down,” “heavy head,” “inactive,” “sedated,” “slow thoughts,” and “sluggish.” The BAES has been validated in healthy young adults1 after alcohol consumption. The BAES was administered approximately every 30 min during the alcohol administration protocol; however, only measures from the BAES given closest to the SLT-A and SLT-B were used in this analysis (these BAES were given approximately 10 min before lights out for SLT-A and -B).
Circadian Phase Determination
Saliva samples (2 ml) were collected during FD waking episodes at approximately 30-min intervals for determination of melatonin levels. Samples were frozen within 4 h of collection and subsequently analyzed by radioimmunoassay (Alpco, Windham, NH,). DLMO phase was assessed for all participants by linear interpolation between rising values, crossing a threshold value of 4 pg/ml. Two participants were dropped from all analyses because levels were too low to allow phase assessment. The intrinsic circadian period for each participant was estimated using all DLMO phase determinations, and period was computed by linear regression from these data. Each outcome variable was assigned a circadian phase based on fitting an individual's period to the dataset from the first measured DLMO phase.
Although each participant's alcohol and placebo conditions were counterbalanced at equivalent homeostatic loads across the 2-wk FD protocol, the circadian phases were not identical due to phase shifts associated with intrinsic circadian period. Consider, for example, a case where alcohol administered on the first FD cycle at circadian phase 270° in a person with an intrinsic period of 23.8 h. The matched placebo administration occurring six cycles later (FD 7) would fall at circadian phase 252° due to drift of 0.2 h earlier each cycle. To maximize the sample size for those with a balance of alcohol/placebo conditions within 90° circadian bins, a sliding 90° window was placed over all data points to determine the maximum number of participants for when the alcohol and placebo were given within the same 90° bins. This approach yielded the following circadian bins: bin 1 = 292°–21°, bin 2 = 22°–111°, bin 3 = 112°–201°, and bin 4 = 202°–291° (Figure 3). Using this procedure, data associated with SLT-A include all 25 participants and data for SLT-B include 21 participants (four males and two females were not available for SLT-B analysis because their circadian phase bins no longer matched for alcohol/placebo condition).
Figure 3.
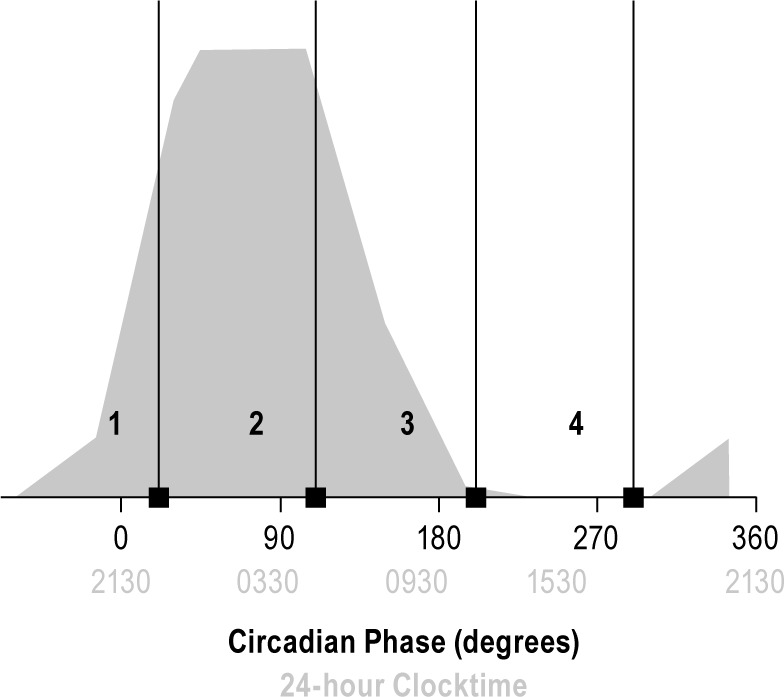
Circadian bin and melatonin phase. 0° represents the measured dim light melatonin onset phase. Each circadian bin (1-4) is shown with the corresponding label and includes 90° to the left of the black bar. Thus, bin 1 includes the late biological daytime and onset of melatonin production; bin 2 spans the biological night where melatonin production is high; bin 3, spans the late biological night and early biological day, spanning melatonin offset; bin 4 covers the part of the cycle where melatonin is not produced, the biological day.
Statistical Analyses
Breath Alcohol Concentration
Each BrAC measure (BrAC-A, BrAC-B) was examined using analysis of variance testing with dependent factor BrAC level (g%) and independent factor circadian phase (1, 2, 3, 4) to determine whether BrAC levels differed across circadian phases. All post hoc tests were Bonferonni corrected t-tests.
MSLT and BAES
SOL scores and associated BAES scores were assigned to a circadian bin (1, 2, 3, or 4) and homeostatic load (bin) condition (1, 2, 3, 4, 5, 6, 7). Data were analyzed using a multilevel regression with fixed effects of drink condition (alcohol or placebo), homeostatic bin (1, 2, 3, 4, 5, 6) (see previous MSLT section for more detail), circadian bin (1, 2, 3, 4), and circadian bin*drink condition and random effects for participants. Interactions with homeostatic bin (e.g., homeostatic bin*circadian phase, homeostatic bin*drink) were not examined because our sample size did not support an analysis that included the full model. Bonferroni corrected t-tests were used for all post hoc analyses.
RESULTS
Breath Alcohol Levels
Breath alcohol concentration (BrAC) taken upon arrival to the sleep laboratory (Figure 2) confirmed a BrAC of 0 g% for all participants; all BrAC readings from the placebo conditions were also 0 g%. The mean BrAC for alcohol values taken at the start of SLT-A (BrAC-A) were 0.045g% (standard deviation [SD] = 0.018), 0.042 g% (SD = 0.01), 0.047 g% (SD = 0.01), and 0.045 g% (SD = 0.01) for circadian bins 1, 2, 3, and 4, respectively. No statistically significant circadian phase differences existed for mean BrACs for SLT-A. The mean BrAC values before SLT-B were 0.032 g% (SD = 0.01), 0.025 g% (SD = 0.01), 0.03 g% (SD = 0.01), and 0.03 g% (SD = 0.01) for circadian bins 1, 2, 3, and 4, respectively. A significant main effect of circadian phase for BrAC-B was observed [F (3,49) = 5.37, P = 0.003]: BrAC-B levels were significantly lower in circadian bins 2 (P = 0.002) and 3 (P = 0.039) compared with circadian bin 4.
Multiple Sleep Latency Test
Sleep Latency Test A
A main effect of drink condition was observed for SLT-A (F (1, 95) = 5.28, P = 0.02), such that SOL was significantly longer with alcohol compared with placebo (Figure 4A). As shown in Figure 4C, a main effect of homeostatic bin was also seen for SLT-A [F (5, 65) = 5.8, P < 0. 01], indicating that irrespective of drink condition or circadian phase, SLTs closest to wake (bin 1) had longer SOL compared with SLTs farthest from wake (bin 5, P = 0.02 and bin 6, P = 0.02); SLTs at the midpoint from wake (bin 4) had longer SOLs compared with SLT farthest from wake (bin 6, P = 0.004). A main effect of circadian bin for SLT-A [F (3, 19) = 5.75, P < 0.01] showed that SOL was longer in circadian bin 1 compared to circadian bins 2 (P = 0.049) and 3 (P = 0.01) (Figure 4E).
Figure 4.

Sleep onset latencies (SOLs) for SLT-A (A, C, E) and SLT-B (B, D, F) for drink condition, homeostatic bin, and circadian bin. The asterisk indicates statistically significant differences and bars represent standard error. (A) SOLs for SLT-A for drink condition. SLT-A had significantly longer SOLs with alcohol compared to placebo. (B) SOLs for SLT-B for drink condition. In contrast to SLT-A, SLT-B has significantly shorter SOLs with alcohol compared with placebo. (C) SOLs for homeostatic bins 1-6 for SLT-A. In general, SLT-A shows longer SOLs closer to waking (homeostatic bin 1) compared with farther from waking (homeostatic bins 5 and 6). Homeostatic bin 4 also showed longer SOLs compared with homeostatic bin 6. (D) SOLs for homeostatic bins 2-7 for SLT-B. No statistically significant findings were observed. (E – F) SOLs for circadian bins 1, 2, 3, and 4 for SLT-A (E) and SLT-B (F). SOLs were longer in circadian bin 1 (late biological daytime and dim light melatonin onset) compared with circadian bins 2 (biological night, melatonin production high) and 3 (late biological night and early biological day). F also shows a significant difference between bin 3 and bin 4. SLT, sleep latency test.
Figure 5A illustrates the interaction of circadian bin*drink for SLT-A [F (3, 95) = 3.45, P = 0.02] showing longer SOL with alcohol in circadian bin 1 (P < 0.01) and circadian bin 2 (P = 0.04).
Figure 5.
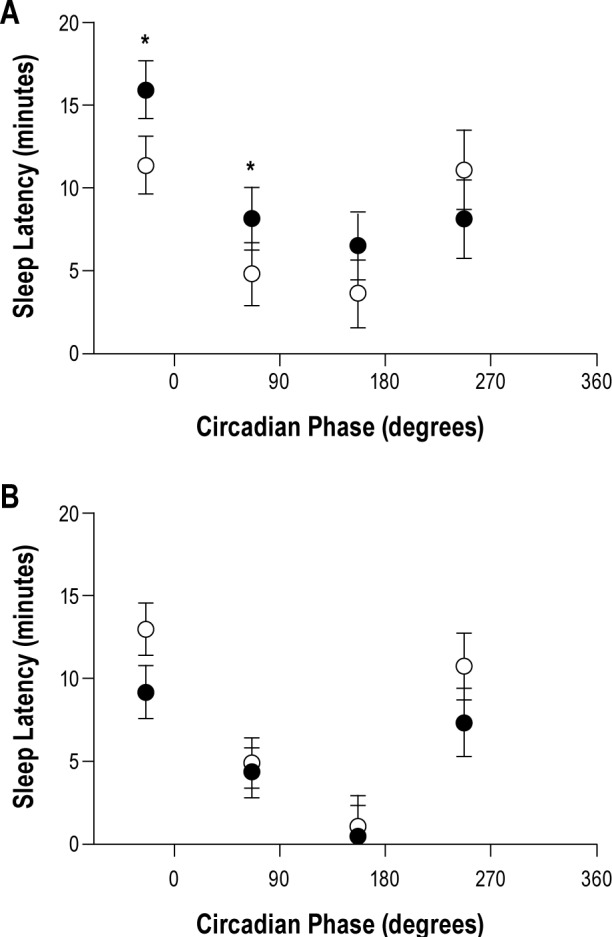
Sleep onset latency for alcohol (closed circles) and placebo (open circles) plotted at midphase for circadian bins 1, 2, 3, and 4 for SLT-A (A) and SLT-B (B) with melatonin curve schematic in the background. The asterisk indicates statistically significant differences between alcohol and placebo conditions and black bars represent standard errors for SLT-A. In A, SOLs were longer with alcohol compared with placebo in circadian bins 1 and 2; No statistically significant differences in SLT-B were seen with alcohol compared to placebo for any circadian bin. SLT, sleep latency test.
Sleep Latency Test B
In contrast with SLT-A, SLT-B showed a main effect of drink condition [F (1, 72) = 4.56, P = 0.036] in which SOL was shorter with alcohol compared with placebo (Figure 4B) and no main effect of homeostatic bin (Figure 4D). As shown in Figure 4F, the main effect of circadian bin [F (3, 29) = 9, P < 0.001] was similar to that for SLT-A: circadian bin 1 had longer SOL compared to circadian bins 2 (P = 0.02) and 3 (P < 0.001); circadian bin 3 had shorter SOL compared with circadian bin 4 (P = 0.01). Unlike STL-A, no circadian bin*drink interaction was observed for SLT-B [F (3, 72) = 1.242, P = 0.30] (Figure 5B).
Biphasic Alcohol Effects Scale
BAES-A: Stimulation and Sedation
A main effect of drink condition [F (1, 93) = 12.12, P < 0.001] was observed for the stimulation scale of BAES-A, such that ratings were increased with alcohol (mean [M] = 20.5, standard error [SE] = 2.5) compared with placebo (M = 15.1, SE = 2.5). No additional main effects were observed; however, as shown in Figure 6A, an interaction of drink*circadian bin was observed [F (3, 93) = 3.14, P = 0.03)] in which stimulation ratings in circadian bin 1 were higher with alcohol compared to placebo (P < 0.001).
Figure 6.

BAES-A (A – B) and BAES-B values (C – D) for stimulation (A – C) and sedation (B – D) for alcohol (closed circles) and placebo (open circles) for circadian bins 1, 2, 3, and 4 plotted at the mid-phase for each bin. Asterisk indicates statistically significant differences between alcohol and placebo and black bars represent standard errors. (A) Significantly higher ratings of stimulation on BAES-A in circadian bin 1 are shown. (C) Signficantly higher ratings of stimulation with alcohol compared with placebo in circadian bins 1 and 3 on BAES-B are shown. B – D show the sedation values for BAES-A and BAES-B, respectively. BAES, Biphasic Effects of Alcohol Scale.
We also observed a main effect of drink condition for the BAES-A sedation scores [F (1, 94) = 6.76, P = 0.01] showing higher ratings of sedation with alcohol (M = 15.9, SE = 2.2) compared with placebo (M = 12.8, SE = 2.2) regardless of homeostatic or circadian bin. A main effect of homeostatic bin [F (5, 58) = 2.59, P = 0.04] was also seen, indicating that the BAES-A sedation ratings in homeostatic bin 1 (M = 8.2, SE = 3.7) were lower than for bin 5 (M = 15.5, SE = 3.8, P = 0.03). No main effect of circadian bin nor interaction of circadian bin*drink condition was seen (Figure 6B).
BAES-B: Stimulation and Sedation
The BAES-B stimulation ratings showed no main effects of drink condition or homeostatic bin; however, a main effect of circadian bin (not pictured) was seen [F (3, 19) = 9.14, P < 0.01]: ratings of stimulation were higher in circadian bin 3 (M = 24.1, SE = 2.3) compared with bins 1 (M = 11.5, SE = 2.3, P < 0.01) and 2 (M = 8.0, SE = 2.3, P < 0.01) and for bin 4 (M = 20.2, SE = 2.8) compared with bin 2 (P = 0.02). Furthermore, as seen in Figure 6C an interaction of drink*circadian bin [F (3, 54) = 2.97, P = 0.04] showed higher ratings of stimulation with alcohol compared with placebo in circadian bins 1 (P = 0.03) and 3 (P = 0.03).
For BAES-B sedation ratings, a main effect of drink condition was found [F (1, 54) = 8.51, P < 0.01]. Ratings of sedation were higher with alcohol (M = 18.788, SE = 1.863) compared with placebo (M = 15.589, SE = 1.867). No main effect of homeostatic bin was found; however, a main effect of circadian bin was observed [F (3, 18.59) = 3.89, P = 0.03], such that circadian bin 3 sedation ratings (M = 24.4, SE = 3.6) were higher than circadian bin 2 (M = 8.76, SE = 3.2, P = 0.04). No interaction of circadian bin*drink was observed (Figure 6D).
DISCUSSION
The current study examined the effects of a moderate dose of alcohol on MSLT and the BAES measure of stimulation/sedation compared with placebo given at different circadian phases and controlling for homeostatic load during a 20-h FD protocol. The MSLT measure of SOL provided an objective marker that we expected to reflect the immediate stimulatory versus delayed sedative effects of alcohol in parallel to the subjective reports.
A number of our findings shared consistency with our expectations based on previous literature. First, MSLT data showed the homeostatic effect for SLT-A showing longer SOL closer to rise time and shorter furthest from rise time, though the SLT-B data did not replicate this finding. Perhaps this finding was because homeostatic load bin 1 was never available for analysis for SLT-B. Second, main effect analyses for circadian bin showed longest SOL for the circadian bin associated with the wake maintenance zone12,13 and shortest SOL for the circadian bin associated with the circadian trough of alertness. Furthermore, consistent with the biphasic effect of alcohol,1 we observed a main effect of drink condition, such that SOLs were longer when measured on the ascending limb of the BrAC curve with alcohol compared with placebo and shorter when measured on the descending limb.
With respect to the interaction of alcohol with circadian phase, our findings showed longer SOLs with alcohol compared with placebo on the ascending limb of the BrAC curve for circadian bins 1 and 2. As noted previously, circadian bin 1 was associated with greatest alertness (clock-dependent alerting), bin 2 with declining alertness, and bin 3 with the circadian trough of alertness, and bin 4 with increasing alertness. Taking this pattern into consideration, the clock-dependent alerting associated with bin 1 may have amplified the stimulatory effects of alcohol on the ascending limb of the BrAC curve on physiologic sleepiness, leading to longer SOLs with alcohol compared with placebo in bins 1 and 2. Also, the circadian drive for sleep in bin 3 may overwhelm the stimulatory signal from alcohol, negating the interaction. This interaction whereby the stimulatory effect of alcohol is minimal at certain phases and amplified at others may underlie the tendency for people to ingest alcohol preferentially at “happy h” and evening/nighttime parties.
In contrast to the stimulatory effects of alcohol for SOL on the ascending limb of the BrAC, we found no interaction for SOL on the descending limb. We propose that the differential sedative effects of alcohol on SOL in this paradigm were not detectable due to insufficient power. Figure 5B indicates a possible trend for faster SOL with alcohol compared with placebo for circadian bin 1.
In general, the BAES subjective ratings paralleled the physiologic findings, particularly for the stimulation scale. Thus, stimulation ratings were significantly higher with alcohol compared with placebo on the ascending limb of the BrAC curve, and we also observed an interaction of circadian phase showing that ratings of stimulation were significantly higher with alcohol at a circadian phase that favors greatest alertness (bin 1). Thus, both subjective and objective measures indicated stimulatory effect of alcohol at this circadian phase. The increased sedation scores at ascending limb of the BrAC following alcohol consumption are inconsistent with our physiological findings and with the biphasic alcohol literature.
The BAES scores for stimulation on the descending limb of the BrAC curve showed unexpected findings that are difficult to reconcile. Scores reflecting increased stimulation occurred at circadian phases associated with greatest sleepiness (e.g., bin 3) compared with phases associated with greater alertness (e.g., bin 1). Furthermore, an anomalous alcohol-related increase of BAES stimulation ratings occurred for bins 1 and 3. By contrast, alcohol-related BAES sedation ratings showing higher sedation with alcohol compared with placebo were consistent with the literature and with the observed increased physiological sleepiness on BAES measured on the descending limb of the BrAC.
We have no explanation for the findings that indicate greater self-reported sedation ratings following alcohol on the ascending limb of the BrAC nor for greater ratings of stimulation on the descending limb, especially in light of the MSLT objective findings. We attempted to keep participants blind to alcohol condition through limiting movement, social interactions, and taste cues, yet they may have detected subtle cues and reacted to those cues in their subjective ratings rather than to the alcohol/placebo effects per se. Thus, expectancies may have played a role with subjective evaluations despite our efforts.
The current study has several limitations that complicated interpretation. A small sample size limits power to detect subtle changes. In addition, the alcohol dose was moderate and we were unable to assess how stimulation/sedation/sleepiness would be affected if the ascending limb lasted longer. Finally, due to our small sample size we were unable to fully test our model including homeostatic load interactions.
In conclusion, the physiological findings in this study support the biphasic stimulating and sedating properties of alcohol, but only at specific circadian phases. Perhaps the most interesting aspect of these findings is that the biphasic effect of alcohol on the objective MSLT measure was strongest at circadian phases when humans are most likely to imbibe. Thus, the timing of stimulatory effect may enhance the pleasurable aspect of drinking and diminish the less pleasurable aspects. The absence of this so-called pick-me-up stimulatory effect of drinking occurred for times typically associated with very late night and early morning. We suggest these data indicating greatest alcohol stimulation at phases overlapping typical “happy hour” and bedtimes, and in combination with data from our previous work8 do not support the notion that alcohol is an effective aid to falling asleep. We caution that this study only included young healthy adults and looked at physiological sleepiness and reports of stimulation/sedation; thus, our ability to generalize to patient populations is limited (e.g., patients with sleep disorders, alcoholics).
DISCLOSURE STATEMENT
This was not an industry supported study. Dr. Acebo works full time for Jazz Pharmaceuticals. The other authors have indicated no financial conflicts of interest.
ACKNOWLEDGMENTS
This work was supported by a grant from the National Institutes of Health (AA 13252) to Mary A. Carskadon, PhD. The authors thank our consultants on the project, Dr. Tim Roehrs, Dr. J. Todd Arnedt, Dr. Robert Swift, and Dr. Peter Monti. Also, we thank Denise Maceroni for saliva assays and Jennifer Maxwell for assistance with data analysis and compilation. The assistance of the staff at the E.P. Bradley Sleep Laboratory and Brown University students in data collection is gratefully acknowledged. Work for this study was performed at E.P. Bradley Sleep and Chronobiology Laboratory.
REFERENCES
- 1.Martin CS, Earleywine M, Musty RE, Perrine MW, Swift RM. Development and validation of the Biphasic Alcohol Effects Scale. Alcohol Clin Exp Res. 1993;17:140–6. doi: 10.1111/j.1530-0277.1993.tb00739.x. [DOI] [PubMed] [Google Scholar]
- 2.Lukas SE, Mendelson JH. Electroencephalographic activity and plasma ACTH during ethanol-induced euphoria. Biol Psychiatry. 1988;23:141–8. doi: 10.1016/0006-3223(88)90084-4. [DOI] [PubMed] [Google Scholar]
- 3.Cohen HL, Porjesz B, Begleiter H. Ethanol-induced alterations in electroencephalographic activity in adult males. Neuropsychopharmacology. 1993;8:365–70. doi: 10.1038/npp.1993.36. [DOI] [PubMed] [Google Scholar]
- 4.Ehlers CL, Wall TL, Schuckit MA. EEG spectral characteristics following ethanol administration in young men. Electroencephalogr Clin Neurophysiol. 1989;73:179–87. doi: 10.1016/0013-4694(89)90118-1. [DOI] [PubMed] [Google Scholar]
- 5.Papineau KL, Roehrs TA, Petrucelli N, Rosenthal LD, Roth T. Electrophysiological assessment (The Multiple Sleep Latency Test) of the biphasic effects of ethanol in humans. Alcohol Clin Exp Res. 1998;22:231–5. [PubMed] [Google Scholar]
- 6.Rupp TL, Acebo C, Van Reen E, Carskadon MA. Effects of a moderate evening alcohol dose. I: sleepiness. Alcohol Clin Exp Res. 2007;31:1358–64. doi: 10.1111/j.1530-0277.2007.00433.x. [DOI] [PubMed] [Google Scholar]
- 7.Roehrs T, Zwyghuizen-Doorenbos A, Knox M, Moskowitz H, Roth T. Sedating effects of ethanol and time of drinking. Alcohol Clin Exp Res. 1992;16:553–7. doi: 10.1111/j.1530-0277.1992.tb01416.x. [DOI] [PubMed] [Google Scholar]
- 8.Van Reen E, Tarokh L, Rupp TL, Seifer R, Carskadon MA. Does timing of alcohol administration affect sleep? Sleep. 2011;34:195–205. doi: 10.1093/sleep/34.2.195. [DOI] [PMC free article] [PubMed] [Google Scholar]
- 9.Carskadon MA, Dement WC, Mitler MM, et al. Guidelines for the multiple sleep latency test (MSLT): a standard measure of sleepiness. Sleep. 1986;9:519–24. doi: 10.1093/sleep/9.4.519. [DOI] [PubMed] [Google Scholar]
- 10.Klem GH, Luders HO, Jasper HH Elger C. The ten-twenty electrode system of the International Federation. The International Federation of Clinical Neurophysiology. Electroencephalogr Clin Neurophysiol Suppl. 1999;52:3–6. [PubMed] [Google Scholar]
- 11.Rechtschaffen A, Kales A. A manual of standardized terminology, techniques, and scoring system for sleep stage of human subjects. Los Angeles: UCLA Brain Information Service/Brain Research Institute; 1968. [Google Scholar]
- 12.Strogatz SH, Kronauer RE, Czeisler CA. Circadian pacemaker interferes with sleep onset at specific times each day: role in insomnia. Am J Physiol. 1987;253:R172–8. doi: 10.1152/ajpregu.1987.253.1.R172. [DOI] [PubMed] [Google Scholar]
- 13.Lavie P, Weler B. Timing of naps: effects on post-nap sleepiness levels. Electroencephalogr Clin Neurophysiol. 1989;72:218–24. doi: 10.1016/0013-4694(89)90246-0. [DOI] [PubMed] [Google Scholar]