Abstract
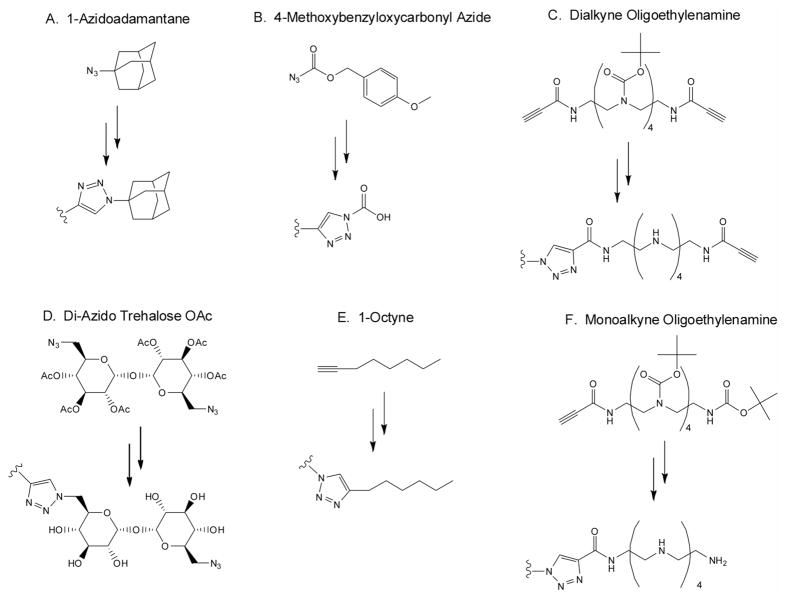
In this study, we have synthesized six analogs of a trehalose-pentaethylenehexamine glycopolymer (Tr4) that contain (1A) adamantane, (1B) carboxy, (1C) alkynyl-oligoethyleneamine, (1D) azido trehalose, (1E) octyl, or (1F) oligoethyleneamine end groups and evaluated the effects of polymer end group chemistry on the ability of these systems to bind, compact, and deliver pDNA in cultured HeLa cells. The polymers were synthesized in one-pot azide-alkyne cycloaddition reactions with an adaptation of the Carothers equation for step-growth polymerization to produce a series of polymers with similar degrees of polymerization. An excess of end-capping monomer was added at the end of the polymerizations to maximize functionalization efficiency, which was evaluated with GPC, NMR and MALDI-TOF. The polymers were all found to bind and compact pDNA at similarly low N/P ratios and form polyplexes with plasmid DNA. The effects of the different end group structures were most evident in the polyplex internalization and transfection assays completed in the presence of serum, as determined by flow cytometry and luciferase gene expression respectively. The Tr4 polymers end-capped with carboxyl groups (1B) (N/P = 7), octyne (1E) (N/P = 7), and oligoethyleneamine (1F) (N/P = 7), were taken into cells as polyplex and exhibited the highest levels of fluorescence, resulting from labeled reporter plasmid. Similarly, the polymers end-functionalized with the carboxyl groups (1E at N/P = 7), octyl groups (1E at N/P = 15) and, in particular, the oligoethyleneamine groups (F at N/P = 15) yielded dramatically higher reporter gene expression in the presence of serum. This study yields insight into how very subtle structural changes in the polymer chemistry such as end groups can yield very significant differences in the biological delivery efficiency and transgene expression of polymers used for pDNA delivery.
Keywords: cationic polymers, poly(β-amino ester)s, stoichiometric offset, oligoethyleneamine
INTRODUCTION
Significant research has been conducted over the past two decades towards producing safe and effective methods of transforming cells for therapeutic purposes. A variety of methods have been applied, ranging from direct injection of plasmid DNA into a tumor mass1 to attenuated viral vectors for in vivo delivery of siRNA.2, 3 Viral vectors for RNA and DNA transfection typically have high transfection efficiency and the potential for integration into the host genome, resulting in stable, sustained gene expression.4 However the safety of these vectors has been questioned, as adverse events including insertional mutagenesis5 and fatal immune response have been reported.6 In an effort to reproduce the typically high gene transfection profile of viral vectors, various non-viral gene delivery vectors have been developed. These compounds comprise a diverse set of materials that are typically cationic, including natural and synthetic polymers, peptides, dendrimers, lipids, and combinations of these structures.7 Control of the synthesis of these compounds allows for flexibility in structure and morphology, and optimization of synthetic the cost and methods.
Cationic polymers are widely used for nucleic acid transfection and include polyethyleneimine (PEI), poly-L-lysine (PLL), polyamidoamines, and methacrylate/methacrylamides. These polymers bind and condense nucleic acids and form spherical, toroidal, or rod-like DNA/polymer complexes (“polyplexes”) that are often smaller than naked nucleic acid in solution.8 These polymers improve transfection over DNA alone because the polyplexes protect nucleic acids from enzymatic degradation, facilitate cellular endocytosis and endolysosomal escape, and can also improve nuclear targeting.7, 9, 10 A scaffold polymer structure is often derivatized to confer properties that will increase specificity or transfection efficiency, as polyplexes comprised of polymer and nucleic acid alone may result in low transfection efficiency or cytotoxicity.11–13 Linear cationic polymers for gene delivery are typically biodegradable, and this tends to lower cytotoxicity and increase transfection efficiency.7 The polymers are derivatized either on the ends of the chain or mid-polymer, in an orthogonal manner. In particular, PLL has been end-functionalized with polyethylene glycol (PEG) and galactose to improve solubility and provide for polyplex targeting, respectively.14 Low-molecular-weight linear PEI is commonly end-functionalized with PEG in a similar manner, resulting in increased gene transfection efficiency even in media containing high levels of serum.15, 16
Of particular interest are the poly(β-amino ester)s (PBAEs), which have been synthesized across a range of molecular weights with a variety of end groups and tested for gene expression in vitro. In 2003, Akinc et al. evaluated twelve PBAEs constructed through conjugate addition of 1,4-butanediol or 1,6-hexanediol diacrylate with 1-aminobutanol, terminating with amino-alcohol or acrylate.17 The importance of polymer end groups was emphasized in that study as the data showed that none of the acrylate-terminated polymers mediated appreciable levels of transfection. Anderson et al. conducted an expanded study in 2004 with 486 PBAEs that demonstrated nearly identical results; the most effective polymers were made from the 1,4 or 1,6 diacrylate diols and 1-aminobutanol or 1-aminopentanol, with a molecular weight of approximately 10,000 Da.18 Consistent results were noted despite variation across 12 different molecular weights and 70 different primary structures obtained from 30 monomers. In 2007 Zugates et al. used the highest-performing PBAE from the 2004 study and evaluated gene transfection with 19 untested end-capping amines.19 PBAE transfection efficiency was increased 30% and the optimal polymer/DNA ratio was lowered five-fold by capping with 1,2-diaminoethane. Bhise et. al. made an identical scaffold PBAE through Michael addition of 1,4-butanediol diacrylate and 1-aminopentanol and subsequently capped and cross-linked the polymers with a small library of mono- and bi-functional primary and tertiary amines.20 They found that PBAE of molecular weight 10,000 Da capped with a short aminopropyl piperazyl moiety transfected mouse mammary epithelial cells at levels well above the control and a commercial transfection reagent, FuGENE® HD. Collectively, this work demonstrates the impact of end group modification on the efficacy of a polymeric gene delivery vector.
In our current study, we investigate the effects of end-group functionalization on transfection levels of trehalose-containing ‘click’ polymers,21 for which the polymer repeat unit structure and N/P ratios were previously studied and optimized.21, 22 A variety of functional groups are explored, including terminal azide, alkyne, acid, hydrophobic groups and linear alkyl chains. Polymerizations were completed in one-pot step growth reactions with the addition of excess monofunctional reactant to maximize end-functionalization. The trehalose-oligoethyleneamine polymers average 18 kDa in molecular weight, (Mw) and we find that polymers capped with the oligoethyleneamine in transfections containing serum, displaying transfection levels higher than PEI positive control under the experimental conditions.
MATERIALS AND METHODS
General
All reagents used in synthesis, if not specified, were purchased from Fisher Scientific (Pittsburgh, PA) at ACS grade, molecular biology grade, or equivalent and used as received unless noted. D-Trehalose was obtained from Acros Organics (Geel, Belgium). Pentaethylenehexamine was obtained from Acros Organics and was distilled before use. 1-azidoadamantane, 1-octyne and 4-methoxybenzyloxycarbonyl azide were obtained from Sigma Aldrich (St. Louis, MO).
1H-NMR analysis was performed using a Bruker 500 MHz NMR (Billerica, MA). Samples were prepared in D2O (HOD internal standard) or CDCl3 (CHCl3 internal standard). MALDI-TOF analysis was performed with a Bruker Reflex III (Billerica, MA). Flow cytometry was performed on a BD FACSCalibur (Franklin Lakes, NJ) set to 633 nm.
Luciferase plasmid DNA (GWiz-Luc, abbreviated as +Luc pDNA or Luc) was purchased from Aldeveron (Fargo, ND). UltraPure agarose, ethidium bromide, 10X BlueJuice™ gel loading buffer, Dulbecco’s Modified Eagle Medium (DMEM), Opti-MEM® (no serum added), fetal bovine serum (FBS), propidium iodide and antibiotic-antimycotic (AB-AM) were from Life Technologies (Carlsbad, CA). Human cervix adenocarcinoma (HeLa) cells were purchased from ATCC (Rockville, MD). Polyethylenimine (jetPEI™) was obtained from Polyplus Transfections (Illkirch, France), and Glycofect™ was obtained from Techulon Inc. (Blacksburg, VA). Cell culture lysis reagent and DC protein assay reagents A (alkaline tartrate), S (surfactant) and B (dilute Folin reagent) were purchased from BioRad (Hercules, CA). CellScrub Buffer was from Genlantis (San Diego, CA). Bovine serum albumin (BSA) was obtained from Sigma Aldrich. Label-IT Cy5 was purchased from Mirus (Madison, WI).
Preparation of Monomers
The acetylated disaccharide monomer, di-azido trehalose OAc, was synthesized in three steps and purified via silica gel flash chromatography as described previously.21, 23–26 Briefly, the secondary alcohols of trehalose were iodinated with triphenyl phosphine in dimethyl formamide (DMF) followed by acetylation with acetic anhydride in pyridine. Sodium azide in DMF was then used to displace iodine and install two azide groups per disaccharide.
The dialkyne oligoethyleneamine monomer was generated according to a previously-published method.21, 26 Briefly, the terminal primary amines on pentaethylene hexamine were protected with ethyl trifluoroacetate followed by protection of internal secondary amines with Boc anhydride; methylene chloride was the solvent for both reactions. The trifluoroacetyl units were then cleaved with potassium carbonate in methanol/water followed by terminal coupling of acyl alkyne via dicyclohexyl carbodiimide. The dialkyne oligoethyleneamine was produced and separated from the side product, monoalkyne oligoethyleneamine, with silica gel.
Polymer Synthesis and Characterization
Polymers were prepared in a one-pot synthesis by an adaptation of Carothers equation27 for linear polymers with one monomer in excess; X̄n = 1+r/1−r. At 100% conversion with r = 0.9 this method would produce polymer with dpn = 9.5. In our case, the ratio of monomers was set to 0.90 and two equivalents of end-capping monomer was included to functionalize the ends of the polymer. After 24 h, 2.5 equivalents additional end capping monomer was added to maximize end functionalization. The Tr4 polymers capped with adamantane (Figure 1A), carboxy (Figure 1B), and alkynyl-oligoethyleneamine (Figure 1C) were made by polymerizing with a stoichiometric offset of the dialkyne oligoethyleneamine monomer (Figure 1C), where 0.700 mmol (451.1 mg) diazido-trehalose monomer and 0.777 mmol (572.5 mg) dialkyne-oligoethyleneamine monomer were combined in a scintillation vial for each reaction. For the adamantane-capped Tr4, 0.155 mmol (27.5 mg) 1-azidoadamantane was added as capping reagent. The reactants were then dissolved in minimal DMF (3 mL) followed by addition of aqueous solutions of sodium ascorbate (0.28 mmol) and copper sulfate (0.14 mmol). The Huisgen cycloaddition polymerization reaction28, 29 was stirred at 70°C for 24 hr, followed by the addition of 0.2 mmol (35.4 mg) 1-azidoadamantane and aqueous solutions of sodium ascorbate (0.08 mmol) and copper sulfate (0.04 mmol). After 20 hr, the polymer was precipitated by cooling the solution on ice followed by the addition of cold 10% ammonium hydroxide. The compounds were washed thoroughly with additional 10% ammonium hydroxide followed by water, and dried under vacuum. The acetyl protecting groups were removed by stirring with sodium methoxide in a small amount of methanol adjusted to pH of about 9.5 (18 hr). This was followed by removal of Boc with minimal 4 N hydrochloric acid in dioxane (18 hr). The deprotected polymers were then dissolved in water, dialyzed extensively against water, filtered and dried under vacuum.
Figure 1.
Schematic structures of the Tr4 polymer end groups. Six derivatives of polymer Tr4 were synthesized via copper-catalyzed 1,3-dipolar cycloaddition that yielded different end functionalization. Polymer Tr4 was capped with the following structures: (A) adamantane, (B) carboxy, (C) alkynyl-oligoethyleneamine, (D) azido trehalose, (E) octyl, and (F) oligoethylenamine.
Adamantane-Capped Polymer Tr4 (1A)
1H-NMR (500 MHz, D2O, 65°C): δ(ppm) 1.70–1.83 (m, 13H, adamantane), 2.16–2.23 (bm, 18H, adamantane), 3.02–3.07 (bs, 64H), 3.08–3.14 (t, 63H), 3.15–3.27 (m, 159H), 3.43–3.49 (dd, 30H), 3.67–3.73 (t, 58H), 3.75–3.83 (t, 33H), 4.13–4.22 (m, 31H), 4.63–4.73 (m, 30H), 4.73–4.80 (m, 30H), 4.81–4.89 (m, 31H), 8.41–8.49 (s, 32H). (95 mg, 17%).
Carboxy-Capped Polymer Tr4 (1B)
was made with the same monomer stoichiometry as polymer 1A, except 4-methoxybenzyloxycarbonylazide (32.1 mg) was added as the monofunctional end-capping monomer (instead of 1-azidoadamantane) followed by the further addition of 41.4 mg of 4-methoxybenzyloxycarbonylazide to maximize end functionalization. 1H-NMR (500 MHz, D2O, 65°C): δ(ppm) 3.02–3.07 (bs, 4H), 3.08–3.14 (t, 4H) 3.15–3.26 (m, 10H), 3.34–3.49 (dd, 2H), 3.65–3.73 (t, 4H), 3.75–3.83 (t, 2H), 8.41–8.47 (s, 2H). (72 mg, 13%).
Alkynyl-oligoethyleneamine-Capped Polymer Tr4 (1C)
was also generated in the same way as 1A and 1B. A capping monomer was not used, but excess dialkyne monomer (0.2 mmol, 147.3 mg) was added after 24 hr, with aqueous sodium ascorbate (0.08 mmol) and copper sulfate (0.04 mmol). 1H-NMR (500 MHz, D2O, 65°C): δ(ppm) 3.00–3.08 (bs, 4H), 3.08–3.15 (t, 4H), 3.16–3.28 (m, 10H), 3.42–3.51 (dd, 2H), 3.65–3.75 (t, 4H), 3.75–3.83 (t, 2H), 4.13–4.23 (m, 2H), 4.63–4.73 (m, 2H), 4.74–4.81 (m, 2H), 4.81–4.89 (m, 2H), 8.42-8. (s, 2H). (137 mg, 26%).
The Tr4 polymers end capped with azido-trehalose (Figure 1D), octyl (Figure 1E) and oligoethyleneamine (Figure 1F) were made by adding a slight stiochiometric excess of the diazido-trehalose monomer, where 0.777 mmol (500.8 mg) diazido trehalose and 0.700 mmol (515.8 mg) dialkyne oligoethyleneamine monomer were combined for each reaction. The reaction conditions and work up were the same as the alkyne capped polymers. To obtain the polymers endcapped with the octyl (1E) and oligoethyleneamine (1F), trehalose and oligoethyleneamine difunctional monomers were reacted with 16.9 mg and 120.8 mg (0.155 mmol) capping monomer respectively, followed by the addition of 22.0 and 156.9 mg monofunctional monomer after 24 hr. Azido trehalose was endcapped by addition of di-azide trehalose monomer (0.2 mmol, 128.9 mg) with aqueous sodium ascorbate (0.08 mmol) and copper sulfate (0.04 mmol).
Azido-Trehalose-Capped Polymer Tr4 (1D)
1H-NMR (500 MHz, D2O, 65°C): δ(ppm) 3.02–3.07 (bs, 4H), 3.08–3.14 (t, 4H), 3.15–3.26 (m, 10H), 3.44–3.49 (dd, 2H), 3.66–3.74 (t, 4H), 3.74–3.82 (t, 2H) 4.13–4.21 (m, 2H), 4.63–4.73 (m, 2H), 4.74–4.80 (m, 2H), 4.80–4.89 (m, 2H), 8.41–8.48 (s, 2H). (83 mg, 15%).
Octyl-Capped Polymer Tr4 (1E)
1H-NMR (500 MHz, D2O, 65°C): δ(ppm) 0.72–0.80 (t, 6H, octyne), 1.11–1.22 (bm, 12H, octyne), 1.51–1.61 (m, 4H, octyne), 2.63–2.71 (t, 4H, octyne), 3.02–3.07 (bs, 84H), 3.08–3.15 (t, 81H), 3.15–3.26 (m, 211H), 3.43–3.49 (dd, 40H), 3.66–3.72 (t, 80H), 3.76–3.82 (t, 47H), 4.13–4.21 (m, 41H), 4.63–4.72 (m, 43H), 4.72–4.79 (m, 45H), 4.81–4.89 (m, 43H), 8.42–8.46 (s, 40H). (77 mg, 14%).
Oligoethyleneamine-Capped Polymer Tr4 (1F)
1H-NMR (500 MHz, D2O, 65°C): δ(ppm) 3.02–3.06 (bs, 4H), 3.06–3.12 (t, 4H), 3.13–3.26 (m, 10H), 3.43–3.49 (dd, 2H), 3.66–3.72 (t, 4H), 3.76–3.82 (t, 2H), 4.14–4.20 (m, 2H), 4.64–4.72 (m, 2H), 4.74–4.79 (m, 2H), 4.81–4.89 (m, 2H), 8.43–8.45 (s, 2H). (150 mg, 28%).
Polymer Analysis via GPC-Light Scattering
Each trehalose polymer was analyzed by GPC and static light scattering by injecting 150 μg (100 μl) onto a guard column and three size exclusion columns in series; CATSEC 1000 (7μ, 50 × 4.6), CATSEC 1000 (7μ, 250 × 4.6), CATSEC300 (5μ, 250 × 4.6) and CATSEC 100 (5μ, 250 × 4.6) in 100 mM Na2SO4 with 1% acetic acid eluting at 0.4 ml/min (Eprogen, Inc., Downers Grove, IL). Molecular weight, polydispersity, and dn/dc measurements of the synthesized polymers were determined with a HELEOS II light scattering detector (λ = 662 nm) and an Optilab rEX refractometer (λ = 658 nm) using ASTRA software (Wyatt Technologies, Santa Barbara, CA).
MALDI-TOF Polymer Analysis
For linear mode analysis, each polymer was prepared in 50:50 acetonitrile: water saturated with α-Cyano-4-hydroxy-cinnamic acid, spotted and analyzed on a Bruker Reflex III (Billerica, MA). For reflectron mode analysis, each polymer (0.5 mg/ml) was prepared in 50:50 acetonitrile: water with sodium iodide (1 mg/ml), saturated with 2,5 dyhydroxybenzoic acid. Samples were spotted and analyzed on a Bruker Ultraflex II MALDI TOF/TOF.
Particle Size and Zeta Potential
Polyplex size and surface zeta potential were determined by dynamic light scattering. For measurement at N/P = 7, 15.44 μl of a 1 mg/ml aqueous stock solution was diluted to 200 μl. This was added to 4 μg of luciferase plasmid in 200 μl water. After incubation for 1 hour at room temperature, polyplex formulations were diluted with 800 μl water, in serum-free Opti-MEM, or DMEM containing 10% serum. Aliquots were then analyzed. For measurement at N/P = 15, 33.13 μl of stock solution was used and the analysis was performed in the same manner. Particle size was determined by dynamic light scattering at 633 nm using a detection angle of 173°. Particle size is reported as the intensity-weighted Z-average of the particle diameter (nm). Zeta potential was determined with a 17° detection angle. Measurements were taken with a Malvern Zetasizer Nano ZS using Malvern software (Worcestershire, UK).
Gel Electrophoresis Shift Assay
The relative affinity of the polymers for +Luc-pDNA was determined by agarose gel electrophoresis. Agarose gels (0.6%, w/v) containing ethidium bromide (0.4 μg/mL) were prepared in TAE buffer (40 mM Tris-Acetate, 1 mM EDTA). Polymer solutions were made with 1 μg plasmid at N/P ratios 1, 2, 7 and 15 by adding 0.552 μg, 1.104 μg, 4.06 μg and 8.28 μg of polymer to 5 (N/P = 1 and 2), 4.06, and 8.28 μl water (total final volume 10 μl). The mixtures were allowed to sit/incubate for 1 hr before addition of 1 μl loading buffer to the solutions. Electrophoresis was performed at 60 V for 40 min. The gels were scanned at 312 nm with a Foto Analyst Luminary FX imaging system from Fotodyne Inc. (Hartland, WI).
Flow Cytometry
Cellular uptake of luciferase plasmid with each polymer was assayed by fluorescence activated cell-sorting. HeLa (human cervix adenocarcinoma) cells were seeded in 6-well plates at 250,000 cells/well and cultured in DMEM with 10% FBS at 37°C and 5% CO2 for 24 hr. Polyplex formulations were prepared in water with 5 μg Cy5 labeled +Luc pDNA at N/P = 5 (jetPEI), N/P = 20 (Glycofect) and N/P = 7 or 15 (Tr4 polymers) with the same ratios used for particle size and zeta potential measurement. Prior to transfection, cell culture media was removed and the cells were rinsed with PBS. The polyplexes were then diluted into Opti-MEM or DMEM and immediately transferred (1500 μl) onto the cells. After 4 hr, the cells were incubated with CellScrub, washed with PBS, and were trypsinized. After trypsinization, the cells were lifted, pelleted by centrifugation, and re-suspended in PBS (1 ml), followed by the addition of propidium iodide (2.5 μl). Cell samples were than analyzed with a BD FACSCalibur (Franklin Lakes, NJ) with a helium-neon laser set to excite Cy5 at 633 nm. A minimum of 20 000 live cell events were collected for each sample. Positive fluorescence was established by comparison to control (untransfected) HeLa cells where less than 1% of cells appeared in the positive region.
Luciferase Assay
To determine transgene expression levels of polyplexes formed with the polymers, HeLa cells were transfected at N/P = 7 or 15 (with the Tr4 polymers) and compared to controls. Cells were seeded in a 24-well plate at 50,000 cells/well and cultured in DMEM with 10% FBS at 37°C and 5% CO2 for 24 hr. Polyplex formulations were prepared in water with 1 μg +Luc-pDNA at N/P = 5 (jetPEI), N/P = 20 (Glycofect) and N/P = 7 or 15 (Tr4 polymers) with the same ratios used in particle size and zeta potential measurement. Prior to transfection, the cell media was removed and the cells were rinsed with PBS. The polyplexes were then diluted into Opti-MEM and immediately transferred (300 μL) onto the cells. After 4 hr DMEM with 10% FBS was added to each well (1 mL), and after 24 hr, media and polyplex not internalized was removed and replaced with a fresh aliquot (1 mL). The cells were lysed 48 hr after transfection and each sample was analyzed for luciferase activity and protein content. Luciferase activity was assayed by combining cell lysate (5 μL) with luciferase assay substrate (95 μL) and the relative light units (RLU) was quantified with a plate reader (GENios Pro, TECAN US, Research Triangle Park, NC). Cellular protein was determined by adding cell lysate (5 μL) to BioRad DC Protein Assay reagents A′ (50:1 A:S, 25 μL) and B (200 μL), with detection at 570 nm referenced to a bovine serum albumin standard curve.
MTT Assay
The cytotoxicity of the polyplex formulation was determined by MTT assay. HeLa cells were seeded and transfected by the procedure used for luciferase transfection. Immediately following transfection (after 48 hr), the cells were washed and incubated with 1 ml 0.5 mg/ml MTT solution in DMEM containing 10% FBS. After 1 hr of incubation, the media was removed, the cells were washed with PBS, and lysed with DMSO (600 μL). The plate containing the lysates was placed on a rocking platform for 20 min to ensure even distribution of the purple formazan. An aliquot of the lysates was then quantitatively analyzed for absorbance at 570 nm with a TECAN GENios Pro plate reader (Tecan US, Research Triangle Park, NC) using Magellan software (TECAN).
Statistical Analysis
Measurements were performed in triplicate and data are presented as mean ± standard deviation unless depicted otherwise. ANOVA was used to compare means and Tukey’s HSD was used to adjust p-values for statistical analysis of luciferase transfection data. Statistical analysis was performed using JMP v. 9.0 software from SAS Institute Inc (Cary, North Carolina).
RESULTS AND DISCUSSION
Polymer Synthesis
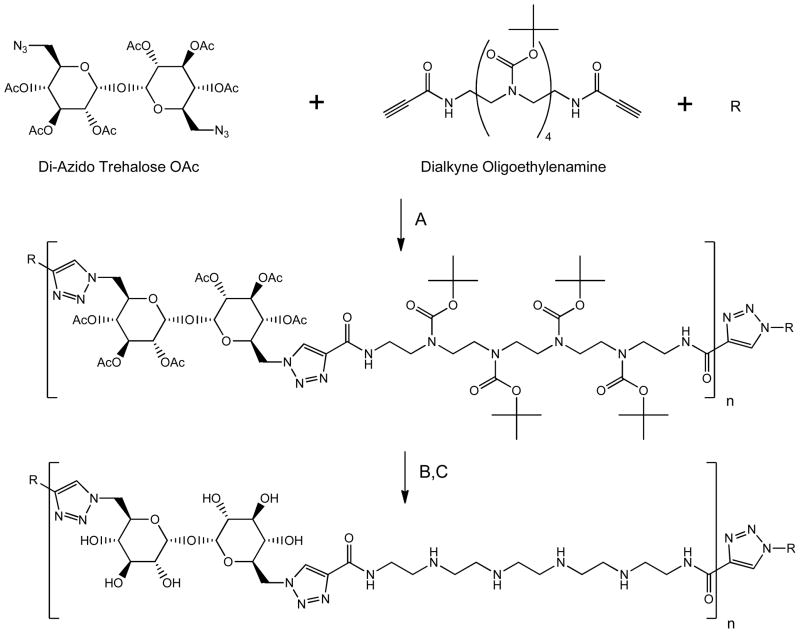
The step-polymerization of prepared bifunctional monomers was performed by copper-catalyzed 1,3-dipolar cycloaddition.28, 29 Stoichiometric offset of bifunctional monomer and addition of monofunctional monomer was applied in order to produce a series of six polymers of similar length, each bearing unique end-functional groups: hydrophilic (1B, 1C, 1D, 1F), hydrophobic (1A and 1E), cationic (1C and 1F), anionic (1B), and functional (carboxy 1B, alkyne 1C, azide 1D, amine 1F) end groups (Fig. 1). The ratio of bifunctional azide and bifunctional alkyne monomer in each polymerization was 0.9, where either di-azido trehalose OAc or dialkyne oligoethylenamine was in excess (Scheme 1). The alkynyl-oligoethyleneamine (1C) and azido trehalose polymerizations (1D) most closely reflected the Carothers equation for the step growth of bifunctional monomers with one monomer in excess: 27 X̄n = 1+r/1−r. This equation predicts polymer with nn = 9.5 when polymerization with r = 0.9 is performed. In our case, the polymers capped with the bifunctional monomers, alkynyl-oligoethyleneamine (1C), were the most divergent; displaying nn = 45, respectively. These results most likely reflect the influence of monomer purity on polymerization, as the monomers in this study were prepared in multi-step reactions, and the effect of dialysis on nn, as lower molecular weight species are removed. Adamantane-Tr4 (1A), carboxy-Tr4 (1B), octyl-Tr4 (1E) and oligoethyleneamine-Tr4 (1F) were polymerized in one-pot with r = 0.9 in the presence of two equivalents of monofunctional monomer; however these polymers (with the exception of 1B) displayed nn greater than predicted by Carothers equation as well (Table 1). Total end-capping of each polymer was increased by the addition of 2.5 equivalents monofunctional monomer (or bifunctional monomer for alkynyl oligoethyleneamine-Tr4 (1C) and di-azido trehalose Tr4 (1D) 24 hr after the start of polymerization. Deprotection was followed by exhaustive dialysis as published previously21 and was combined with PTFE filtration.
Scheme 1.
Trehalose Polycation Polymerization
Conditions: A) CuSO4/sodium ascorbate, DMF, B) NaOMe/MeOH, C) 4N HCl/Dioxane. R represents monofunctional capping agent, pictured in Figure 1.
Table 1.
Capped Tr4 polymer characterization data. Polymers were chromatographed in 100 mM Na2SO4 in 1% acetic acid.
| GPC | ||||
|---|---|---|---|---|
|
| ||||
| Capped Tr4 Polymer | Mw (kDa) | Mn (kDa) | Mw/Mn | nw/nn |
| 1A. Adamantane Tr4 | 13.8 | 11.8 | 1.2 | 18.0/15.2 |
| 1B. Carboxy Tr4 | 12.5 | 7.51 | 1.7 | 16.5/9.6 |
| 1C. Alkynyl oligoethyleneamine Tr4 | 39.2 | 33.2 | 1.2 | 53.4/45.0 |
| 1D. Azido Trehalose Tr4 | 17.5 | 14.0 | 1.3 | 23.6/18.7 |
| 1E. Octyl Tr4 | 13.5 | 12.0 | 1.1 | 17.6/15.7 |
| 1F. Oligoethyleneamine Tr4 | 13.8 | 12.5 | 1.1 | 17.5/15.9 |
Polymer Characterization
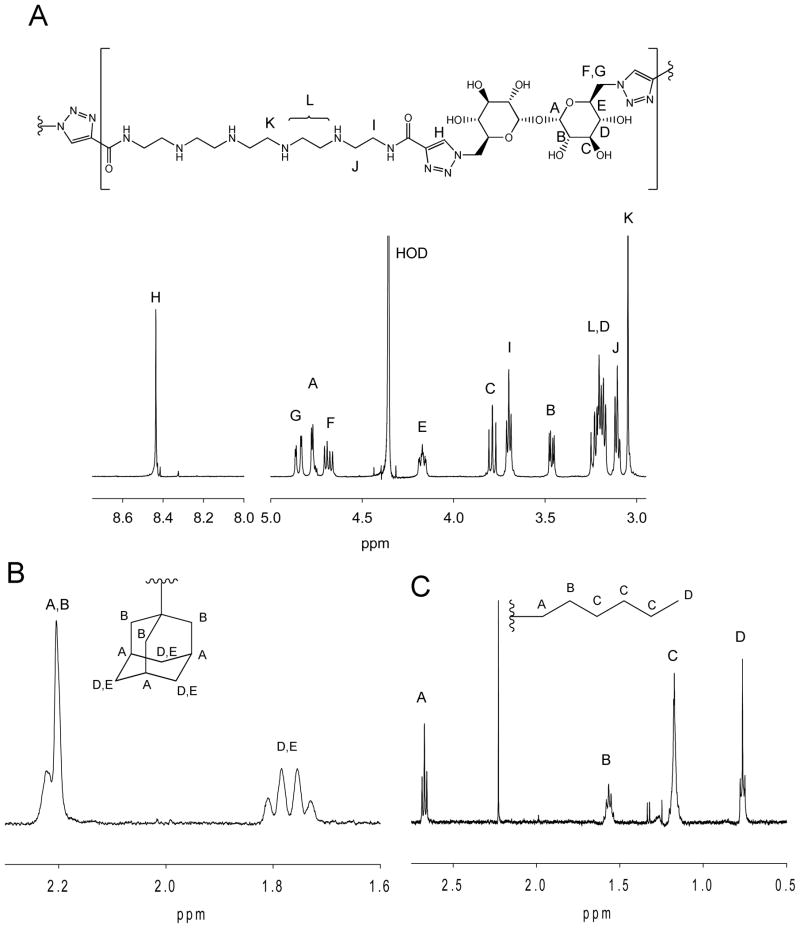
1H-NMR spectra of the polymers were obtained in D2O at 65°C and peak assignments were made by comparison with monomer spectra and polymer 2-D COSY spectra. For polymers 1A (adamantane-terminated) and 1E (octyl-terminated), which had non-exchangeable end group protons (Fig. 2), 1H-NMR integration was compared to GPC Mn (Table 1). The repeating unit proton B (Fig. 2A) was compared to end group protons A,B for Adamantane Tr4 (Fig. 2B) and end group proton A for Octyl Tr4 (Fig. 2C) and end group functionalization of 102 and 84% was determined, thus showing that end-capping was complete (or close to complete with the octyl analog) and within error of this analysis technique.
Figure 2.
1H-NMR spectra of three Tr4 polymer derivatives showing the basis of Mn determination for the adamantane and octyl-capped Tr4 polymers. A) 1H spectra for the Tr4 derivative capped with the carboxy monomer. This repeating unit spectra is common to all of the polymers. B) 1H NMR spectral region showing the adamantane proton peaks for polymer adamantane-Tr4 (1A). End functionalization was 102% (using both the GPC Mn data along with this NMR spectral data). C) 1H NMR spectral region showing the octyl proton peaks for octyl-Tr4 (1E). ). End functionalization was 84%, (using both the GPC Mn data along with this NMR spectral data). All spectra were taken in D2O at 65°C.
MALDI-TOF analyses of the polymers were performed as an additional measurement of mass (Supporting Information, Fig. S9–S20). We observed Flory-Schulz distributions of polymers typically seen with linear polymerizations.27 In linear mode, the most intense peak in each spectra corresponded to a polymer of six repeating units, followed by peaks of decreasing intensity corresponding to polymer with one less repeating unit, where the repeating unit has has mass of 728.75 Da. Adamantane-Tr4 (1A), carboxy-Tr4 (1B), and azido trehalose-Tr4 (1D), displayed dual ionization patterns, each displaying an exponential decay where peaks differ by one repeat unit (Supporting Information, Fig. S9, S11, S15). In reflectron mode, endcapped polymer species were observed in spectra for adamantane-Tr4 (1A), azido trehalose-Tr4 (1D), octyl-Tr4 (1E), and oligoethyleneamine-Tr4 (1F) (Supporting Information, Fig. S10, S16, S18, S20).
Polyplex Characterization
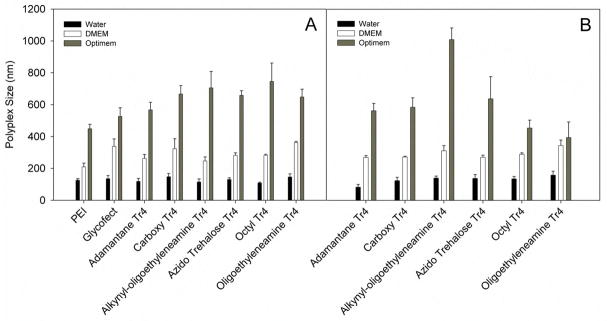
Each polymer was combined with plasmid DNA encoding the luciferase reporter gene in water at N/P ratios of 7 and 15. The polypex formulations were then diluted into water, serum-containing DMEM, or reduced-serum Opti-MEM, allowing determination of three particle size values for each polyplex corresponding to the different media environments (Fig. 3A). The polyplexes in Opti-MEM were the largest, between 570 and 750 nm in diameter; at N/P = 7. At N/P = 15, alkynyl-oligoethyleneamine-Tr4 (1C) was the largest, at 1009 nm. Azido-trehalose Tr4 (1D), carboxy-Tr4 (1B), and adamantane-Tr4 (1A) were smaller, between 562 and 637 nm. Octyl-Tr4 (1E) and oligoethyleneamine-Tr4 (1F) were the smallest, at 453 and 394 nm. Interestingly, polyplexes in DMEM were similar in size to each other, regardless of N/P ratio, ranging from 263 to 323 nm. Polyplexes prepared in water were all similar in size and were the smallest of the three formulations, from 109 nm (octyl-Tr4, 1E) to 148 nm (carboxy-Tr4, 1E) in diameter. The most significant change in particle size we note is the increase in size for the alkynyl-oligoethyleneamine-Tr4 (1C) at N/P = 15 vs 7 in Opti-MEM (1009 vs. 705 nm). These polyplexes change size and represent the extremes in size across the entire polymer series in Opti-MEM.
Figure 3.
Polyplex size (via dynamic light scattering) analysis of the end-capped polymers formulated at N/P = 7 (panel A) and 15 (panel B) in water, Opti-MEM (without serum), and DMEM containing 10% FBS (fetal bovine serum). Polyplexes with PEI were prepared at N/P = 5 and with Glycofect at N/P = 20. Polymer was added to plasmid DNA in water, incubated at room temperature for 1 hr to form polyplexes and then diluted into water, Opti-MEM, or DMEM immediately prior to measurement. Results represent the mean and standard deviation where n = 3.
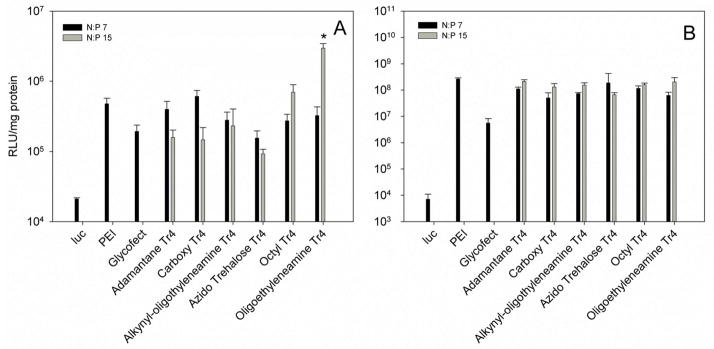
Zugates et. al.19 conducted an in vitro gene delivery study with 37 end-modified poly(β-amino ester)s. Polyplexes were formed between plasmid DNA and polymer, and were diluted into DMEM cell culture medium containing 10% serum. The size of the polyplexes varied between 85 and 220 nm, with a 150 nm average. Polyplexes in cell culture media were larger than polyplexes in HEPES, which is analogous to the increase we observe with our polyplexes in cell culture media vs. polyplexes in water. However, our polyplexes are larger than the PBAE series, likely due in part to the higher Mw of our synthesized polymers. In the Zugates study, the PBAE with the highest transfection activity was approximately 130 nm in diameter, and terminated with an alkane containing a primary amine. The highest performing trehalose polymer in our current study in the presence of DMEM containing serum was the oligothyleneamine Tr4 derivative (Fig. 7). The polyplexes were very similar size to the other polyplex types in the presence of serum. These results indicate that for in vitro transfections with polymers of this type, endgroup plays a more direct role in determining transfection efficiency than polyplex size.
Figure 7.
Luciferase expression and cellular protein levels of HeLa cells 48 hrs after transfection. Polyplexes were formed in water and diluted into DMEM containing 10% FBS (panel A) or serum-free Opti-MEM (panel B) as in the particle size analysis (Fig. 3) prior to transfection. Four hours after transfection, DMEM with 10% FBS was added to each experiment. Bars indicate mean results (n=3); error bars indicate standard deviation. PEI polyplexes were formulated at N/P = 5 and Glycofect polyplexes were formulated at N/P = 20. * p<0.05 relative to all other samples (ANOVA with Tukey’s HSD).
The zeta potentials of the six polyplex samples (Fig. 4) were all between +11 and +28 mV, and appeared to increase slightly with an increase in polymer concentration from N/P = 7 to 15. Polyplex solutions formed with adamantane-Tr4 (1A) at N/P = 7 and 15 had the lowest surface charge, at 11 mV. Azido trehalose-Tr4 (1D) polyplex solutions were higher in charge, at 14 mV. Carboxy-Tr4 (1B), alkynyl-oligoethyleneamine Tr4 (1C), and octyl-Tr4 (1E) were higher yet in charge between 15 and 20 mV, and polyplexes formed with oligoethyleneamine-Tr4 (1F) yielded the highest zeta potential at 23 mV, although the error was high for this polyplex solution at N/P = 15. We interpret these data to mean that for the majority of the polymers, end-functionalization did not have a significant effect on the surface charge of the condensed particles in water, with the exception of the bulky, hydrophobic adamantane end-group, which appeared to lower particle surface charge slightly.
Figure 4.
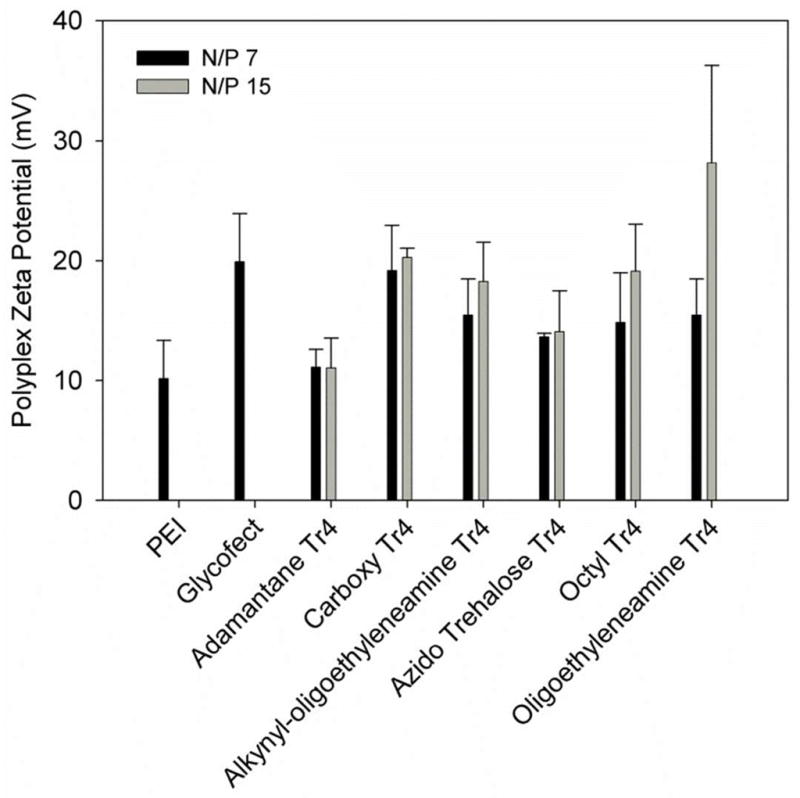
Polyplex zeta potential analysis of end-capped polymers formulated at N/P = 7, 15, and 30 (adamantine-Tr4, 1A). Polymer was added to pDNA in water and incubated at room temperature for 1 hr, and diluted into additional water immediately prior to measurement, in the same manner as for particle size measurement. Results represent the mean and standard deviation where n = 3.
Anderson et. al.18 measured the zeta-potentials of polyplexes formed with 29 poly(β-amino ester)s synthesized at 12 different amine:acrylate ratios. The majority (79%) of the polyplexes tested were positively charged, however the range of surface potentials was wide (1.03 to 46.77 mV) and no clear trend was noted between polymer length or endgroup and zeta potential. The authors did conclude however, that polyplexes formed with the best performing polymers were always positively charged, with zeta potentials over 10 mV. This is typically seen with cationic gene delivery vehicles, as positively charged complexes associate favorably with the abundant anionic glycosaminoglycans present on cell surfaces.30
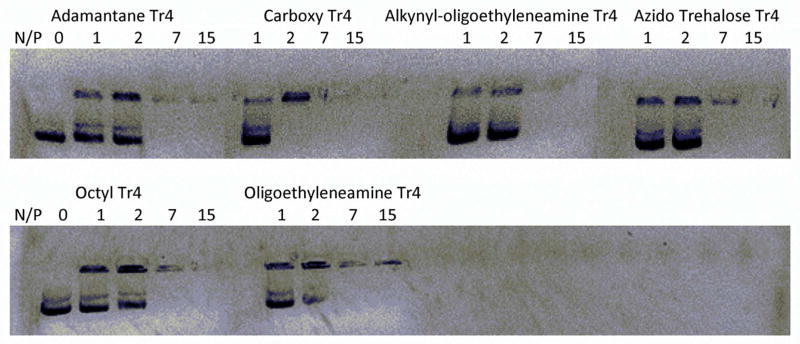
The relative strength of binding between plasmid DNA and each polymer was qualitatively assayed by agarose gel electrophoresis (Fig. 5). Polyplexes formed readily with all of the polymers and were stable at N/P ratios greater than 2 for all six systems when subjected to a 60-V electric field. These results are consistent with what we typically observe,22 as binding is generally independent of degree of polymerization, and provides a basis for testing the efficacy and cytotoxicity of these polyplexes in vitro.
Figure 5.
Agarose gel electrophoresis shift assays to qualitatively assess the binding between the Tr4 polymer analogs and pDNA. Polymers were added to pDNA in water at the indicated N/P ratios and incubated at room temperature for 1 hr, followed by loading onto an ethidium bromide-containing 1% agarose gel and electrophoresis at 60 V for 40 min. A control sample (containing pDNA only) was run and is depicted as N/P = 0. All polymers exhibited complete pDNA binding at N/P ratios above 2.
Cellular Uptake via Flow Cytometry
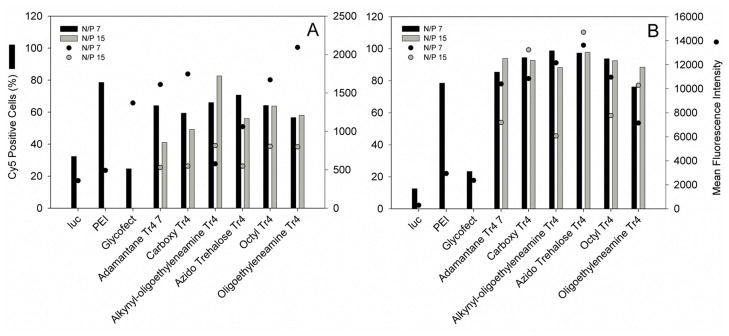
We utilized flow cytometry to compare how the difference in end group functionalization influences plasmid uptake across the polyplex series. Our in vitro system was comprised of HeLa cells cultured in DMEM supplemented with 10% FBS. An optimized transfection procedure was utilized, wherein polyplexes are formed with Cy5-labeled plasmid at N/P = 7 and 15 in water and then diluted into Opti-MEM or DMEM, followed by transfection onto adherent, washed cells. After a 4-hr transfection period, cells were washed to remove external (excess not internalized by the cells) nucleic acid/polyplexes, lifted off the plates by trypsinization and suspended in PBS. The cells were then analyzed and Cy5 fluorescence levels were measured via flow cytometery. For the polyplex formulations transfected in DMEM (Fig. 6A), transfection at N/P = 7 produced a greater percentage of Cy5-positive cells than at N/P = 15 except in transfection with alkynyl-oligoethyleneamine Tr4 (1C), which displayed 66% positive cells at N/P = 7 and 82% positive cells at N/P = 15. A similar trend was reflected when the mean fluorescence intensity of the two groups was compared; alkynyl oligoethyleneamine presented mean fluorescent intensity of 578 units at N/P = 7 and 815 units at N/P 15. These data lead us to conclude that polyplex endocytosis during a four hour transfection period is more efficient at N/P = 7 for every polyplex type in the series except for the alkynyl-oligoethyleneamine polymer. In addition to this, while transfection with alkynyl-oligoethyleneamine Tr4 (1C) at N/P 15 produced the highest percentage of Cy5 positive cells (85%), cells transfected with oligoethyleneamine Tr4 (1F) at N/P 7 produced the highest mean fluorescence at N/P = 7 (2,093 units), although only 57 and 58% of the cells were Cy5 positive at the tested N/P ratios.. These data reveal that the polymers terminated with monomers containing oligoethyleneamines are the most effective at facilitating pDNA internalization in the presence of serum at (after 4 h and at N/P 7 and 15).
Figure 6.
Flow cytometry analysis of Cy5-labeled luciferase plasmid uptake 4 hours after transfection. Polyplexes were formed in water and diluted into DMEM containing 10% FBS (panel A) or serum-free Opti-MEM (panel B) in the same manner as in particle size analysis (Fig. 3). Four hours after transfection, cells were trypsinized, extensively washed, and analyzed via flow cytometry. PEI polyplexes were formulated at N/P = 5, and Glycofect polyplexes were formulated at N/P = 20. The results are reported as the average intensity of 20,000 live cell events.
HeLa cells transfected with polyplexes in Opti-MEM (Fig. 6B) contained much more labeled plasmid after the 4 hour transfection period than did cells transfected with DMEM in the presence of 10% serum. This highlights the inhibitory role of serum proteins in cellular uptake and the importance of designing/optimizing materials that can promote effective delivery in serum. All polymer analogs in the series produced a HeLa population with greater than 75% Cy5 positive cells. The lowest mean fluorescent intensity in the Opti-MEM transfection condition was exhibited by the alkynyl-oligoethyleneamine-terminated Tr4 analog at N/P = 15. However, it is interesting to note that despite this polyplex analog being the lowest in Opti-MEM, the mean fluorescence intensity was nearly three times higher than the highest intensity (oligethyleneamine Tr4, N/P = 7) displayed under DMEM (containing 10% fetal bovine serum) transfection conditions. The percentages of Cy5 positive cells when comparing transfection at N/P = 7 to N/P = 15 were similar to each other, as were the mean fluorescent intensities, except in the case of alkynyl-oligoethyleneamine Tr4 (1C), which decreased from 99% Cy5 positive cells to 88%, and from 12,159 units to 6,075. Interestingly, for this polymer (alkynyl-oligoethyleneamine Tr4 1C) we note a decrease in endocytosis with increase in N/P ratio, while endocytosis increases with an increase in N/P in transfection with DMEM. It is also evident that this is the longest polymer in the series (Fig. 8), which could pay a role in these data.
Figure 8.
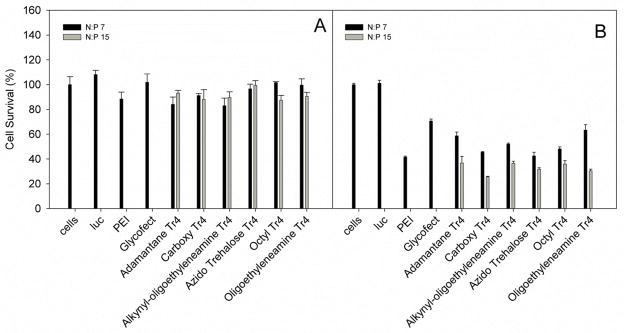
MTT assay showing cell viability after exposure to the polyplex formulations. Polyplexes were formed in water and diluted into DMEM containing 10% FBS (panel A) or serum-free Opti-MEM (panel B) in the same manner as in particle size analysis (Fig. 3). PEI polyplexes were formulated at N/P = 5 and Glycofect polyplexes were formulated at N/P = 20. The data represents the mean and standard deviation of transfection (n=3), and were normalized to untransfected cells.
In Vitro Transfection
We used the luciferase assay as a tool for measuring and comparing the transfection efficiency of the six polymers and a similar transfection procedure was completed to that performed in the cellular uptake assays. However, after the 4-hr transfection period, DMEM with 10% FBS was added to the wells and transfection was continued for a total of 48 hr. A luciferase assay was employed to examine transgene expression, and a total protein assay was used to measure cytotoxicity and to normalize luciferase levels for all of the data points. In the transfections performed in DMEM containing 10% FBS (Fig. 7A), at an N/P ratio of 7, the polyplexes revealed small differences in their transfection efficiency. For example, the polymers end capped with the parent monomers (1C and 1D) showed the lowest gene expression profiles and the carboxy-terminated polymer had a slightly higher profile at N/P = 7. The most dramatic differences in the transfection efficiency were noted with polyplexes formulated with the oligoethyleneamine-Tr4 (1F) and the octyl-Tr4 polymers prepared at N/P = 15. Interestingly, the luciferase expression for polymer 1F was almost an order of magnitude higher than that observed with all of the other polymers, including the positive controls JetPEI and Glycofect. This data with polymer 1F was statistically significantly higher in comparison to all of the other data points (Supporting Information, Fig. S1). This result shows that both polymer end capping and N/P ratio have a large effect on the efficacy of delivery in the presence of serum. End capping this trehalose polymer series with a lipophilic octyl group (1E at N/P=15) appears to aid transfection efficiency but not necessarily cellular uptake (and could be acting at the cellular trafficking or endosome level). The most dramatic increase in transfection efficiency was found with the Tr4 polymer end capped with a terminal primary amine and 5 secondary amines spaced by ethyl groups (1F at N/P=15). Gene expression levels were almost an order of magnitude higher than all other data points and this could be related to the higher Zeta potential of this polyplex type (Fig. 4). Conversely, transfection experiments completed in the absence of serum (Opti-MEM only, Fig. 7B) revealed overall much higher levels of gene expression for all the polymers and controls than those seen in the DMEM experiments. Yet, in Opti-MEM, the various endgroups did not have much of a distinguishing effect when compared to each other as statistical significance between these data could not be established (Supporting Information, Fig. S2). Indeed, polymer end groups appear to play a role in transfection efficiency, in particular, in the presence of serum.
When transfection efficiency is standardized to protein levels, the toxic effects of the polymer are evident (which can artificially increases the RLU/mg values).13 The MTT assay of HeLa cells transfected with polyplexes comprised of each of the Tr4 analogs showed relatively similar high cell viability (90–100% viable) in the DMEM transfection (Fig. 8A), showing that end groups do not play a role in toxicity in the presence of serum. However, in the Opti-MEM transfections, we noted a clear decrease in viability with the Tr4 analogs and viability decreased with an increase in polymer concentration (N/P 7 vs. 15) across the entire series.
As previously mentioned, Akinc et. al.,17 Anderson et. al.,18 Zugates et. al.,19 Bhise et. al.,20 and Sunshine et. al.,31 also studied the effects of modifying end group structure on polymeric gene delivery. Specifically, the data showed that the poly(β-amino ester)s ranging from 8.8 – 13 kDa terminating with amino alcohols, primary, secondary, or tertiary amines were the highest performing transfection reagents.17–20, 31 Anderson18 and Akinc17 both transfected with polyplexes diluted into Opti-MEM, and noted optimal transfection with polymer terminating in amino alcohols. Zugates,19 Bhise,20 and Sunshine,31 prepared polyplexes in DMEM containing serum, and noted optimal transfection in poly(β-amino ester)s terminating in long primary amine (Zugates,19 Sunshine31) or tertiary amine (Bhise20), which is similar to that observed here with our Tr4 1F polymer end functionalized with the terminal oligoethyleneamines. Sunshine31 noted an increase in transfection with an increase in hydrophobicity along the polymer backbone and sidechain; a similar trend was also noticed with the Tr4-1E polymer substituted with the octyl groups.
CONCLUSIONS
Previously, our group had synthesized and examined a series of trehalose-oligoethyleneamine polymers (Tr polymers). Our previous work has found that a variety of factors ranging from number of ethylene amines (Tr1-6) to polymer molecular weight can play a significant role on gene delivery efficacy in a variety of cell types.21–23, 26, 32 These polymers have all been previously created via a step-growth polymerization mechanism and thus, contained a statistical distribution of alkyne or azide terminal groups.
Herein, we have synthesized and characterized this series of Tr4 glycopolymers with a variety of end groups and examined the effects of end group chemistry on the physicochemical properties, transfection efficiency, and cytotoxicity of polyplex formulations created with these polymers and plasmid DNA. The effects of end group chemistry on cellular pDNA delivery were found to be significant, in particular, in the presence of serum. The Tr4 polymer structure end-capped with the oligoethyleneamine (Figure 1F) had dramatically higher transfection efficiency than the entire polymer series. In addition to the data presented here in, other groups have also found that differences in end functionalization can play a large role in the biological properties of polymer-based transfection formulations. Overall, these results provide a method for optimizing synthesis and transfection of these trehalose glycopolymers through modification of molecular weight and end group functionality, thereby facilitating understanding of structure-activity relationships. This strategy of a one-pot method of modifying polymer ends created via step-growth polymerization is applicable to other types of polymeric nucleic acid delivery agents currently in development. In this way, targeting groups, small molecule drugs, and various other functionalities can be added to the ends of the synthesized polymer; such efforts are the focus of current and planned future studies in our laboratory.
Supplementary Material
Acknowledgments
We thank Steve June for his insight on end-capped step-growth polymers and Patrick Zimmerman for his assistance with statistical analysis. We also thank the NIH Director’s New Innovator Award Program (1-DP2-OD006669-01) for supporting this research.
Footnotes
Statistical analysis, GPC chromatograms and MALDI-TOF spectra are provided in the electronic supporting information. This material is available free of charge via the Internet at http://pubs.acs.org.
References
- 1.Signori E, Iurescia S, Massi E, Fioretti D, Chiarella P, De Robertis M, Rinaldi M, Tonon G, Fazio VM. Cancer Immunol Immunother. 2010;59:1583–1591. doi: 10.1007/s00262-010-0853-x. [DOI] [PMC free article] [PubMed] [Google Scholar]
- 2.Cho-Rok J, Yoo J, Jang YJ, Kim S, Chu IS, Yeom YI, Choi JY, Im DS. Hepatology. 2006;43:1042–1052. doi: 10.1002/hep.21137. [DOI] [PubMed] [Google Scholar]
- 3.Makinen PI, Koponen JK, Karkkainen AM, Malm TM, Pulkkinen KH, Koistinaho J, Turunen MP, Yla-Herttuala S. J Gene Med. 2006;8:433–441. doi: 10.1002/jgm.860. [DOI] [PubMed] [Google Scholar]
- 4.Verma IM, Weitzman MD. Annu Rev Biochem. 2005;74:711–738. doi: 10.1146/annurev.biochem.74.050304.091637. [DOI] [PubMed] [Google Scholar]
- 5.Hacein-Bey-Abina S, von Kalle C, Schmidt M, Le Deist F, Wulffraat N, McIntyre E, Radford I, Villeval JL, Fraser CC, Cavazzana-Calvo M, Fischer A. New Engl J Med. 2003;348:255–256. doi: 10.1056/NEJM200301163480314. [DOI] [PubMed] [Google Scholar]
- 6.Marshall E. Science. 1999;286:2244–2245. doi: 10.1126/science.286.5448.2244. [DOI] [PubMed] [Google Scholar]
- 7.He CX, Tabata Y, Gao JQ. Int J Pharm. 2010;386:232–242. doi: 10.1016/j.ijpharm.2009.11.006. [DOI] [PubMed] [Google Scholar]
- 8.Midoux P, Pichon C, Yaouanc JJ, Jaffres PA. Br J Pharmacol. 2009;157:166–178. doi: 10.1111/j.1476-5381.2009.00288.x. [DOI] [PMC free article] [PubMed] [Google Scholar]
- 9.Park MR, Han KO, Han IK, Cho MH, Nah JW, Choi YJ, Cho CS. J Controlled Release. 2005;105:367–380. doi: 10.1016/j.jconrel.2005.04.008. [DOI] [PubMed] [Google Scholar]
- 10.Shen Y, Peng H, Pan S, Feng M, Wen Y, Deng J, Luo X, Wu C. Nanotechnology. 2010;21:045102. doi: 10.1088/0957-4484/21/4/045102. [DOI] [PubMed] [Google Scholar]
- 11.Varga CM, Tedford NC, Thomas M, Klibanov AM, Griffith LG, Lauffenburger DA. Gene Ther. 2005;12:1023–1032. doi: 10.1038/sj.gt.3302495. [DOI] [PubMed] [Google Scholar]
- 12.Brazeau GA, Attia S, Poxon S, Hughes JA. Pharm Res. 1998;15:680–684. doi: 10.1023/a:1011954516233. [DOI] [PubMed] [Google Scholar]
- 13.Moghimi SM, Symonds P, Murray JC, Hunter AC, Debska G, Szewczyk A. Mol Ther. 2005;11:990–995. doi: 10.1016/j.ymthe.2005.02.010. [DOI] [PubMed] [Google Scholar]
- 14.Hu HM, Zhang X, Zhong NQ, Pan SR. J Biomater Sci Polym Ed. 2012;23:677–695. doi: 10.1163/092050611X558297. [DOI] [PubMed] [Google Scholar]
- 15.Breunig M, Lungwitz U, Liebl R, Fontanari C, Klar J, Kurtz A, Blunk T, Goepferich A. J Gene Med. 2005;7:1287–1298. doi: 10.1002/jgm.775. [DOI] [PubMed] [Google Scholar]
- 16.Namgung R, Kim J, Singha K, Kim CH, Kim WJ. Mol Pharm. 2009;6:1826–1835. doi: 10.1021/mp900096u. [DOI] [PubMed] [Google Scholar]
- 17.Akinc A, Anderson DG, Lynn DM, Langer R. Bioconjugate Chem. 2003;14:979–988. doi: 10.1021/bc034067y. [DOI] [PubMed] [Google Scholar]
- 18.Anderson DG, Akinc A, Hossain N, Langer R. Mol Ther. 2005;11:426–434. doi: 10.1016/j.ymthe.2004.11.015. [DOI] [PubMed] [Google Scholar]
- 19.Zugates GT, Tedford NC, Zumbuehl A, Jhunjhunwala S, Kang CS, Griffith LG, Lauffenburger DA, Langer R, Anderson DG. Bioconjugate Chem. 2007;18:1887–1896. doi: 10.1021/bc7002082. [DOI] [PubMed] [Google Scholar]
- 20.Bhise NS, Gray RS, Sunshine JC, Htet S, Ewald AJ, Green JJ. Biomaterials. 2010;31:8088–8096. doi: 10.1016/j.biomaterials.2010.07.023. [DOI] [PMC free article] [PubMed] [Google Scholar]
- 21.Srinivasachari S, Liu Y, Zhang G, Prevette L, Reineke TM. J Am Chem Soc. 2006;128:8176–8184. doi: 10.1021/ja0585580. [DOI] [PubMed] [Google Scholar]
- 22.Srinivasachari S, Liu Y, Prevette LE, Reineke TM. Biomaterials. 2007;28:2885–2898. doi: 10.1016/j.biomaterials.2007.01.037. [DOI] [PubMed] [Google Scholar]
- 23.Reineke TM, Davis ME. Bioconjugate Chem. 2003;14:247–254. doi: 10.1021/bc025592k. [DOI] [PubMed] [Google Scholar]
- 24.Garcia Fernandez JM, Ortiz Mellet C, Moreno Marin A, Fuentes J. Carbohydr Res. 1995;274:263–268. doi: 10.1016/0008-6215(95)00065-2. [DOI] [PubMed] [Google Scholar]
- 25.Menger FM, Mbadugha BN. J Am Chem Soc. 2001;123:875–885. doi: 10.1021/ja0033178. [DOI] [PubMed] [Google Scholar]
- 26.Kizjakina K, Bryson JM, Grandinetti G, Reineke TM. Biomaterials. 2012;33:1851–1862. doi: 10.1016/j.biomaterials.2011.10.031. [DOI] [PMC free article] [PubMed] [Google Scholar]
- 27.Odian G. Principles of Polymerization. 4. John Wiley & Sons; Hoboken, New Jersey: 2004. p. 812. [Google Scholar]
- 28.Díaz DD, Punna S, Holzer P, McPherson AK, Sharpless KB, Fokin VV, Finn MG. J Polym Sci, Part A: Polym Chem. 2004;42:4392–4403. [Google Scholar]
- 29.Rostovtsev VV, Green LG, Fokin VV, Sharpless KB. Angew Chem Int Ed Engl. 2002;41:2596–2599. doi: 10.1002/1521-3773(20020715)41:14<2596::AID-ANIE2596>3.0.CO;2-4. [DOI] [PubMed] [Google Scholar]
- 30.McLendon PM, Buckwalter DJ, Davis EM, Reineke TM. Mol Pharm. 2010;7:1757–1768. doi: 10.1021/mp100135n. [DOI] [PubMed] [Google Scholar]
- 31.Sunshine JC, Akanda MI, Li D, Kozielski KL, Green JJ. Biomacromolecules. 2011;12:3592–3600. doi: 10.1021/bm200807s. [DOI] [PMC free article] [PubMed] [Google Scholar]
- 32.Reineke TM, Davis ME. Bioconjugate Chem. 2003;14:255–261. doi: 10.1021/bc025593c. [DOI] [PubMed] [Google Scholar]
Associated Data
This section collects any data citations, data availability statements, or supplementary materials included in this article.


