

Abstract
♦ Background: Reduced free water transport (FWT) through ultrasmall pores contributes to net ultrafiltration failure (UFF) and should be seen as a sign of more severe functional deterioration of the peritoneal membrane. The modified peritoneal equilibration test (PET), measuring the dip in dialysate Na concentration, estimates only FWT. Our aim was to simultaneously quantify small-solute transport, FWT, and small-pore ultrafiltration (SPUF) during a single PET procedure.
♦ Methods: We performed a 4-hour, 3.86% glucose PET, with additional measurement of ultrafiltration (UF) at 60 minutes, in 70 peritoneal dialysis patients (mean age: 50 ± 16 years; 61% women; PD vintage: 26 ± 23 months). We calculated the dialysate-to-plasma ratios (D/P) of creatinine and Na at 0 and 60 minutes, and the Na dip (DipD/PNa60′), the delta dialysate Na 0-60 (ΔDNa0-60), FWT, and SPUF.
♦ Results: Sodium sieving (as measured by ΔDNa0-60) correlated strongly with the corrected DipD/PNa60′ (r = 0.85, p < 0.0001) and the corrected FWT (r = 0.41, p = 0.005). Total UF showed better correlation with FWT than with indirect measurements of Na sieving (r = 0.46, p < 0.0001 for FWT; r = 0.360, p < 0.0001 for DipD/PNa60′). Corrected FWT fraction was 0.45 ± 0.16. A negative correlation was found between time on PD and both total UF and FWT (r = -0.253, p = 0.035 and r = -0.272, p = 0.023 respectively). The 11 patients (15.7%) diagnosed with UFF had lower FWT (89 mL vs 164 mL, p < 0.05) and higher D/P creatinine (0.75 vs 0.70, p < 0.05) than did the group with normal UF. The SPUF correlated positively with FWT in the normal UF group, but negatively in UFF patients (r = -0.709, p = 0.015). Among UFF patients on PD for a longer period, 44.4% had a FWT percentage below 45%.
♦ Conclusions: Measurement of FWT and SPUF is feasible by simultaneous quantification during a modified 3.86% glucose PET, and FWT is a decisive parameter for detecting causes of UFF in addition to increased effective capillary surface.
Keywords: Peritoneal equilibration test, aquaporins, peritoneal transport, ultrafiltration failure
Ultrafiltration failure (UFF) is an important cause of treatment drop-out in long-term peritoneal dialysis (PD). Heimbürger et al. (1) reported a cumulative risk for the development of permanent loss of net ultrafiltration (UF) of 3% after 1 year and 31% after 6 years of PD treatment. At that time, UF loss was associated mostly with a large effective peritoneal surface area (1-3) or, eventually, with a high lymphatic absorption rate (1).
Later, once aquaporins in the capillary peritoneal wall were demonstrated, some authors showed that impaired water transport through the ultrasmall pores could contribute to net UFF in PD (4,5). That finding was based on an observed reduction of sodium sieving during a 3.86% glucose peritoneal equilibration test (“modified PET”). In the first hour of a modified PET, a strong osmotic gradient over the aquaporins induces free water transport (FWT) from the capillaries to the dialysate, resulting in a decrease (by dilution) of the dialysate sodium concentration. This dip in dialysate sodium is hence an indirect method for estimating the magnitude of water transport through the ultrasmall pores. However, it is important to bear in mind that an apparent reduction in sodium sieving can also be caused by increases in peritoneal small-solute diffusion, or by a reduction in the UF coefficient (LpS) of the peritoneal membrane (6,7). Therefore, a reliable tool to quantify both peritoneal FWT and small-pore solute and fluid transport would be of great practical importance.
Recently, two methods—one by La Milia et al. (“mini-PET”) (8), and the other by Smit et al. (9)—have been developed to assess aquaporin-mediated water transport in PD patients. These methods have both been validated by computer simulations using the three-pore model of peritoneal transport (10). Compared with the method from Smit et al., the mini-PET is simple because it does not involve sophisticated calculations or measurement of fluid absorption by calculation of the clearance of a macromolecular marker. Although extremely accurate in measuring FWT, the mini-PET does not reproduce the standardized small-solute transport categorization, because its dialysate-to-plasma ratio of creatinine (D/P Cr) measured at 60 minutes of the dwell reveals a relatively higher rate of small-solute transport than is found in a 4-hour dwell (11). Besides, it is burdensome in clinical practice to have each patient undergo different types of PET for an evaluation of membrane status. To overcome this limitation, Cnossen et al. (12) performed a study in which they compared, in 10 prevalent PD patients, small-solute transport assessed in a 4-hour, 3.86% glucose PET, with temporary drainage after 1 hour (allowing for quantification of FWT), concluding that the interim step did not influence the D/P Cr result. Because no further report has yet re-evaluated the clinical relevance of their approach, we aimed to extend our present investigation into diagnosing UFF in a larger population by simultaneously evaluating small-solute transport and more accurately assessing ultrasmall- and small-pore UF using a single PET procedure.
METHODS
PATIENTS AND PROCEDURES
This cross-sectional study enrolled 70 patients (29 men, 41 women; mean age: 50 ± 16 years) attending PD units at Hospital Geral de Santo António - Centro Hospitalar do Porto, Portugal, and Hospital Universitario La Paz, Spain, between January 2008 and August 2010. Mean time on PD was 26 months (range: 1 - 121 months). Of the 70 patients, 43 (61%) were on automated PD. None of the patients had peritonitis during the study or the preceding 4 weeks. The test was performed as a routine annual evaluation of membrane status without elective selection.
A 4-hour 3.86% glucose modified PET with temporary drainage at 60 minutes (13) was performed in all patients. During the procedure, we used PD solutions low in glucose degradation products [either Balance (Fresenius Medical Care, Bad Homburg, Germany) or Physioneal (Baxter Healthcare Corporation, Deerfield, IL, USA) according to the individual patient’s prescription]. The volume of dialysis solution was determined by weight, without flushing the system and before filling the peritoneum. Blood and dialysate samples (each approximately 10 mL) were taken at instillation of the dialysate and after 60 and 240 minutes. At 60 minutes, we performed an additional measurement of UF by total drainage of the peritoneal cavity. This drained volume was weighed and then immediately reinfused. Finally, after 240 minutes, the peritoneal cavity was drained and the drained volume was weighed.
A PET with an ultrafiltrate volume of 400 mL or less at 4 hours was considered to represent UFF. By that definition, UFF was detected in 11 patients (15.7%), who were analyzed separately and compared with the stable group.
MEASUREMENTS
Creatinine and sodium were measured in both plasma and dialysate. Glucose was assessed in dialysate. Creatinine and glucose were measured using standard automated analyzer techniques. For creatinine, the Jaffé compensated method was used. The dialysate creatinine concentration was corrected for interference by glucose according to laboratory standards. Sodium in dialysate and plasma was measured using indirect ion-selective electrodes.
CALCULATIONS
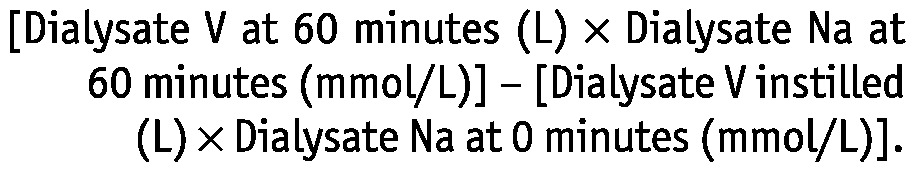
We calculated the dialysate-to-plasma sodium (D/PNa) at the beginning (D/PNa0′) and at 1 hour (D/PNa60′) of the study PET. The Dip_D/PNa60′ is the difference between the D/PNa0′ and the D/PNa60′. The mass transfer area coefficient for creatinine (MTAC Cr), calculated by the simplified Garred model (14,15), was used to estimate the dialysate sodium concentration attributable to diffusion (16,17). The resulting value was then subtracted from the sodium concentration measured in the dialysate at 60 minutes. Thus, we were able to calculate the D/PNa60′ and the respective Dip_D/PNa60′, with and without correction for sodium diffusion, according to previous methods used to assess unit reference values (11). As a more simple clinical tool, the difference in dialysate sodium (ΔDNa0-60′) was also measured by subtracting the dialysate sodium at 60 minutes (DNa60′) from the initial dialysate sodium (DNa0′) (13).
During the study PET, FWT was calculated as follows:
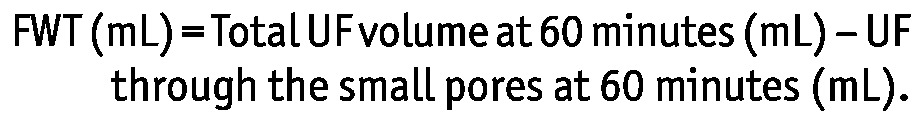 |
The UF through the small pores (SPUF) at 60 minutes was calculated as follows:
 |
where NaR (mmol) is sodium removal and PNa is the sodium concentration in plasma assessed by indirect ion-selective electrodes. The NaR was calculated as
 |
Using a simple algorithm, we also performed a correction for FWT as described by Venturoli and Rippe (10):
 |
where the “15” represents cumulative lymphatic absorption during 60 minutes (18 mL) minus the cumulative UF through the large pores during 60 minutes (approximately 3 mL). The FWT fraction was also evaluated.
In addition, patients were characterized by peritoneal transport status as described by Twardowski et al. (18).
STATISTICAL ANALYSIS
Data with normal distribution are expressed as mean ± 1 standard deviation, with 95% confidence intervals. Asymmetrically distributed data are reported as medians and interquartile ranges.
Pearson and Spearman correlation analyses were used, as appropriate, to investigate possible relations between the parameters of peritoneal transport.
Comparisons of the parameters of peritoneal transport between patients on PD for less than 2 years and for 2 or more years were performed using the Student t-test or Mann-Whitney U-test (according to the variables involved).
We also used the unpaired Student t-test or Mann-Whitney U-test to compare patients with and without UFF according to the variables involved.
Values of p less than 0.05 were considered statistically significant. Statistical analyses were performed using the SPSS software application (version 15.0: SPSS, Chicago, IL, USA) for Windows.
RESULTS
SOLUTE AND FLUID TRANSPORT PARAMETERS
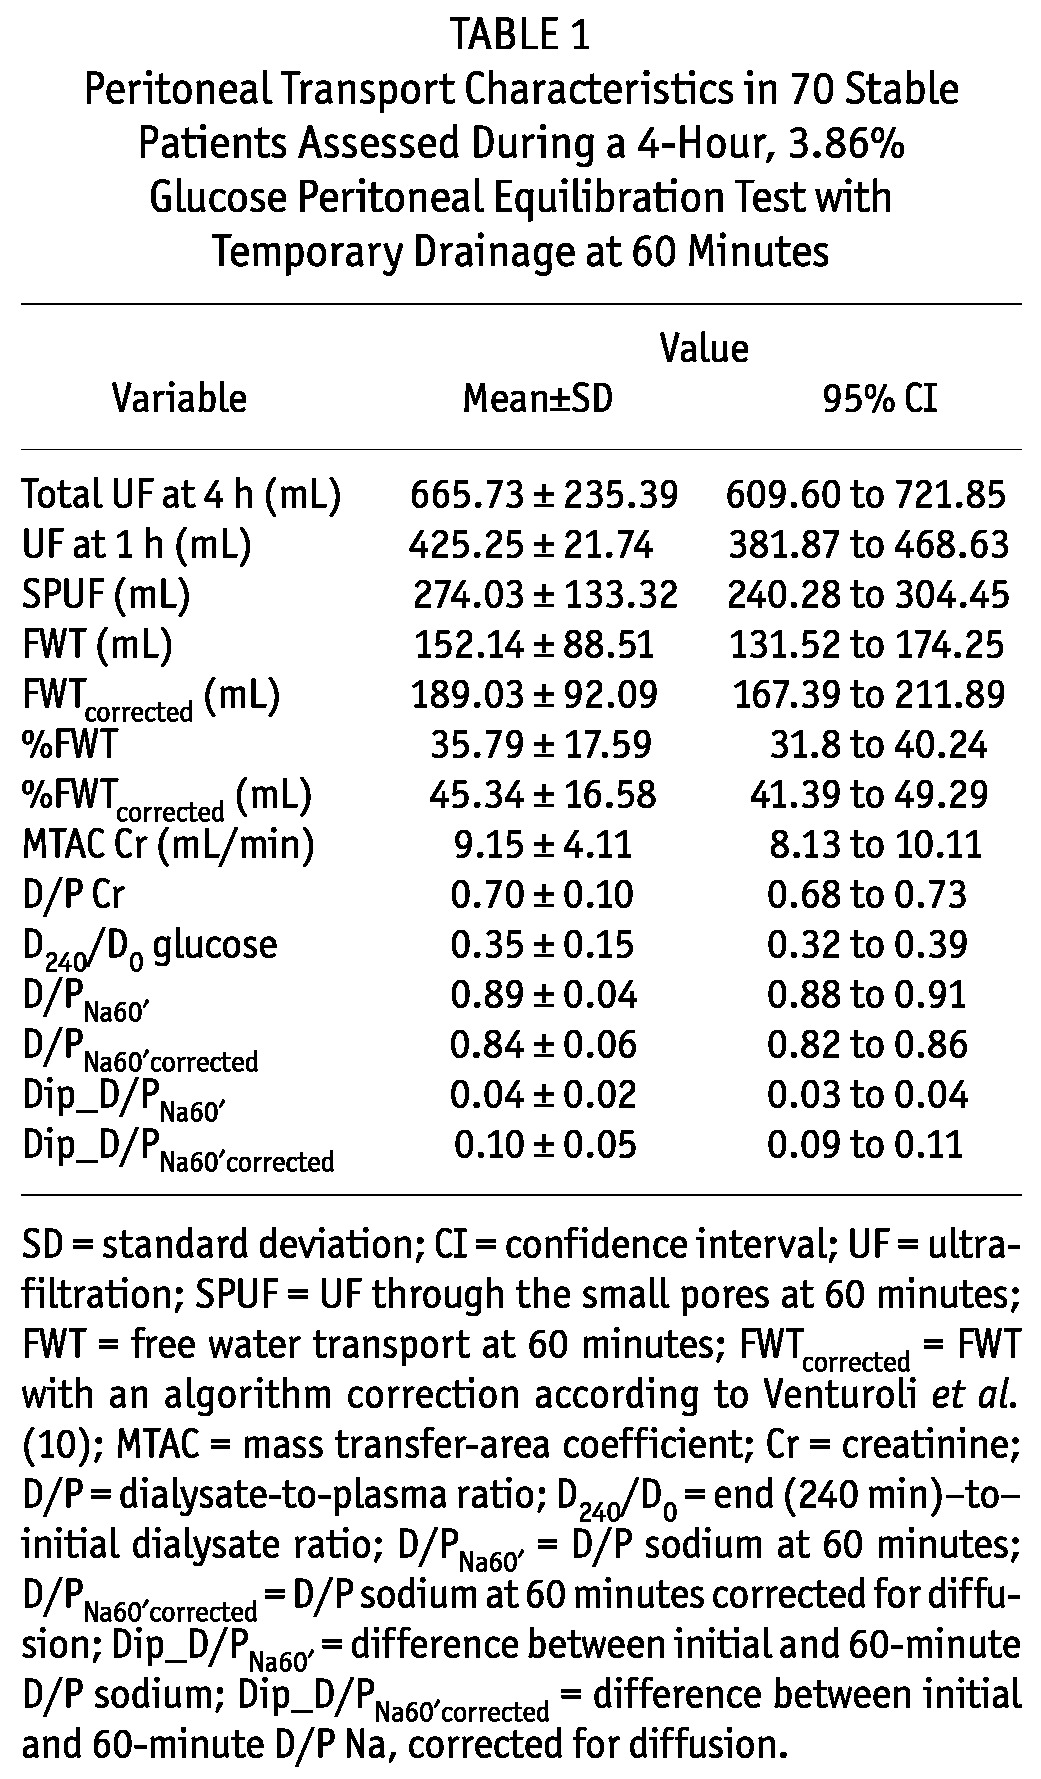
Table 1 summarizes the peritoneal transport characteristics from the PET performed in the 70 study patients. Notably, FWT accounted for 35.8% of the UF at 60 minutes, and once corrected (for sodium diffusion, cumulative UF volume through the large pores, and cumulative lymphatic absorption at 60 minutes), its contribution increased to a mean of 45.3%. With respect to small-solute transport characteristics, 2 patients (3%) were categorized as slow transporters (D/P Cr ≤ 0.49), 19 (27%) as slow-average (0.50 ≤ D/P Cr ≤ 0.64), 42 (60%) as fast-average (0.65 ≤ D/P Cr ≤ 0.80), and 7 (10%) as fast transporters (D/P Cr ≥ 0.81).
TABLE 1.
Peritoneal Transport Characteristics in 70 Stable Patients Assessed During a 4-Hour, 3.86% Glucose Peritoneal Equilibration Test with Temporary Drainage at 60 Minutes
CORRELATIONS BETWEEN TOTAL UF, SODIUM SIEVING, AND FWT QUANTIFICATION
Total UF at 4 hours showed a better correlation with quantified FWT than with any indirect measurement of sodium sieving (r = 0.46, p < 0.0001 for FWT; r = 0.48, p < 0.0001 for FWTcorrected; r = -0,29, p < 0.0001 for D/PNa60′; r = -0.45, p < 0.0001 for D/PNa60′corrected; r = 0.36, p < 0.0001 for Dip_D/PNa60′; r = 0.44, p < 0.0001 for Dip_D/PNa60′corrected; and r = 0.32, p = 0.005 for ΔDNa0-60′).
We found a significant correlation between sodium sieving measurements and FWT quantification, especially when FWT was corrected for diffusion [Figure 1(A,B)]. Additionally, a simple tool such as ΔDNa0-60′ correlated strongly with the corrected dip [r = 0.85, p < 0.0001, Figure 1(C)] and with FWT (r = 0.41, p < 0.0001), which is relevant for routine bedside evaluation.
Figure 1.
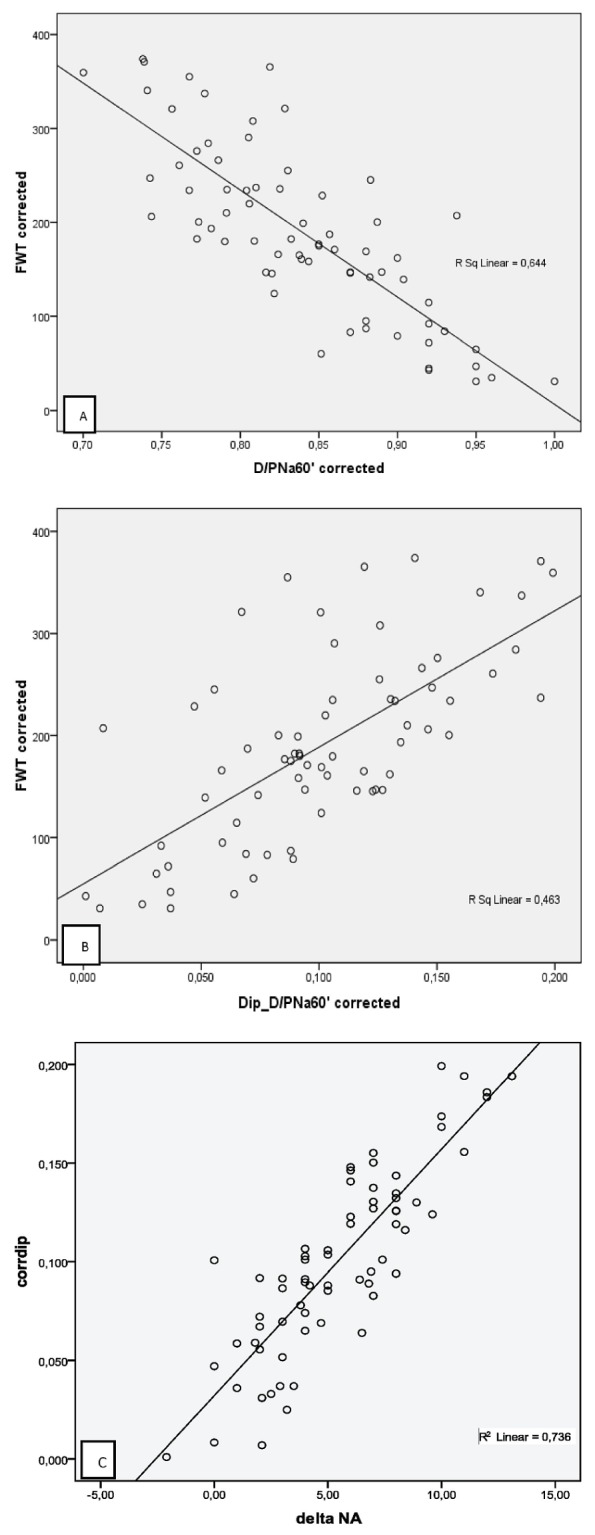
— Correlations between (A) the dialysate-to-plasma (D/P) sodium at 60 minutes corrected for diffusion (D/PNa60′corrected) and free water transport with an algorithm correction (FWTcorrected) according to Venturoli and Rippe (10) (Pearson r = -0.80, p < 0.0001); (B) the difference (“delta”) of the initial D/P sodium (D/PNa0′) and the 60-minute D/P sodium corrected for diffusion (Dip_D/PNa60′corrected) and FWTcorrected according to Venturoli and Rippe (10) (Pearson r = 0.68, p < 0.0001); and (C) the corrected dip and delta sodium (Pearson r = 0.85, p < 0.0001).
SHORT-COMPARED WITH LONG-TERM PD TREATMENT
Of the study patients, 41 (59%) had been on PD for fewer than 2 years (short-term PD), and 29 patients (41%) had been on PD for 2 or more years (long-term PD). Although none of the comparisons were statistically significant, the long-term group had lower FWT and total UF values (data not shown). However, we observed a statistically significant trend to achieve less total UF and less FWT over time on PD [Figure 2(A,B)].
Figure 2.
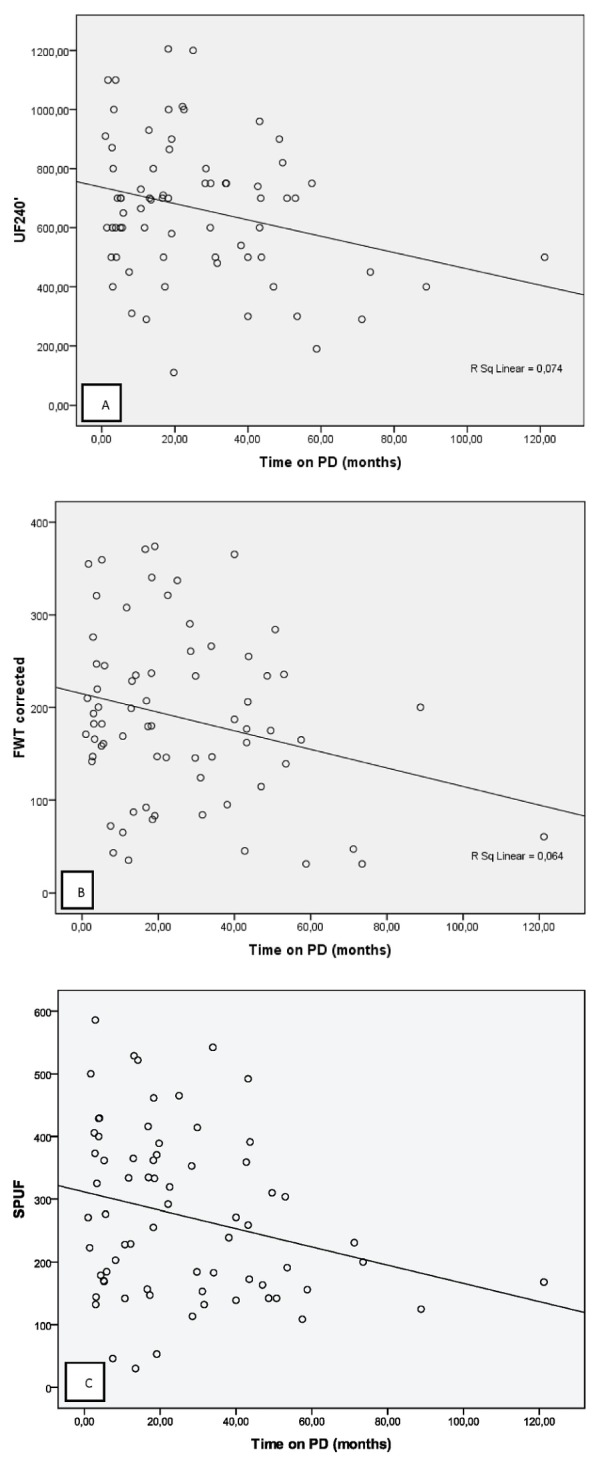
— Simultaneous small-pore and ultrasmall-pore peritoneal transport evaluation and its profile with time on peritoneal dialysis (PD). Correlations between (A) total ultrafiltration (UF240′) and time on PD (Pearson r = -0.272, p = 0.023); (B) free water transport with an algorithm correction (FWTcorrected) according to Venturoli and Rippe (10) and time on PD (Pearson r = -0.253, p = 0.035); and (C) small-pore ultrafiltration (SPUF) with time on PD (Pearson r = -0.243 p = 0.003).
UFF AND WATER TRANSPORT PATHWAYS
Among the 70 study patients, 11 (15.7%) had UFF (total UF ≤ 400 mL). Although the difference was not statistically significant, patients with normal UF had been on PD treatment for a shorter period of time (Table 2). Compared with stable patients, patients with UFF had a significantly lower mean FWT, a higher D/P Cr, and a higher MTAC Cr (Table 2). Among 9 patients with UFF who had been on PD for more than 18 months (82%), 2 (22.2%) were fast transporters, and 4 (44.4%) had a FWT percentage corrected for sodium diffusion of less than 45% (the mean for the entire population). Notably, as Figure 3 shows, SPUF correlated positively with FWT in the non-UFF group (r = 0.257, p = 0.032), but more strongly and negatively in the UFF group (r = -0.709, p = 0.015).
TABLE 2.
Simultaneous Small-Pore and Ultrasmall-Pore Peritoneal Transport Evaluation for Peritoneal Dialysis (PD) Patients With and Without Ultrafiltration (UF) Failure
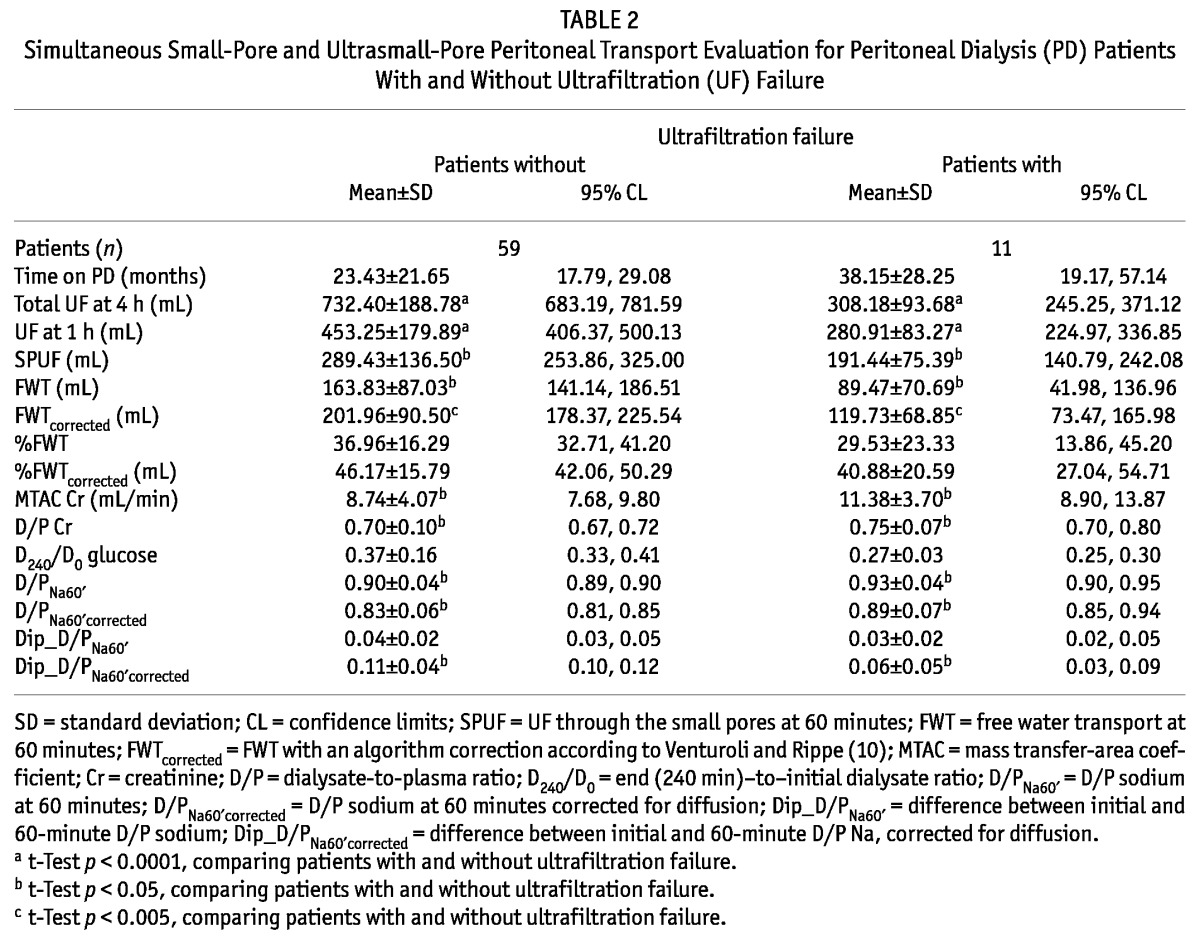
Figure 3.

— Small-pore and ultrasmall-pore peritoneal water transport pathways. (A) Free water transport (FWT) and small-pore water transport both contribute to net ultrafiltration in patients without ultrafiltration failure (r = 0.257, p = 0.032). (B) Disproportionate decline in FWT in patients with ultrafiltration failure (r = -0.709, p = 0.015).
DISCUSSION
To our knowledge, the present study is the first to report simultaneous small-pore and ultrasmall-pore peritoneal transport quantification in a large PD population through the use of a 4-hour 3.86% glucose PET with temporary drainage at 60 minutes. The UF quantification at 60 minutes allows for FWT to be measured as first described by La Milia and colleagues (8). Our study expands the work of the La Milia group, because the 4-hour PET with the added procedure allows for both FWT and small-pore UF to be measured at the same time that peritoneal solute transport is being quantified in a standardized way, without the overestimation that might occur when transport categorization is based on a D/P Cr obtained after a 60-minute dwell (11).
Even when no correction was made for sodium diffusion, the results obtained for FWT (mean FWT at 60 minutes: 152 mL) were quite similar to those obtained with a more accurate and sophisticated method that used a volume marker [mean FWT at 60 minutes: 135 mL according to Smit et al. (9); median FWT at 60 minutes: 154 mL according to Parikova et al. (19)]. We also emphasize that the results obtained regarding the contribution of FWT to 60-minute UF are in line with those reported by La Milia—mean FWTcorrected being 45% in our study, and mean FWT percentage being 46% in the report by La Milia et al. (8). Also, skilled studies from Waniewski et al., whatever the adjustments and methodology used, found a FWT fraction of 0.40 ± 0.12, which is equivalent to the fraction that we documented (20,21).
The fact that FWT correlates better with total UF than with any indirect measure of sodium sieving is evidence that reduced water flow through aquaporins is somehow not the only factor connected with reduced sodium sieving (7). As expected, the algorithm correction for sodium diffusion that we used allowed us to correct some underestimation of FWT because of the presence of sodium diffusion from the circulation (10). To correct the calculations for diffusive sodium transport, the MTAC Cr estimated using the simplified Garred formula [following the methodology previously published by the Krediet group (16)], was also used by Asghar and Davies (22) to investigate peritoneal fluid pathways. Although the simplified Garred model may be less accurate than the Waniewski model, the good correlation between these two models allows for the use of the former model in routine clinical evaluation (11). However, we suggest that peritoneal transport quantification can rely on a two-in-one protocol of 4-hour PET that simultaneously provides information on D/P creatinine (at 4 hours) and 60-minute FWT quantification, avoiding correction formulas and indirect estimates of sodium sieving that have been found to be less discriminative.
We also found a slight, but consistent, tendency for FWT to decline with time on PD. Such impairment might occur as a consequence of interstitial membrane changes, lowering the capacity of glucose to exert its osmotic effect on the ultrasmall pores. To explain the apparently “paradoxical” observation that, although FWT was lower in patients with UFF than in those without UFF, the FWT percentage simultaneously failed to reach statistical significance when those groups were compared, it must be emphasized that the decrease in aquaporin function indeed cannot be cited as the single reason for the FWT decrease. Because of dissipation of the glucose osmotic gradient, FWT depends on and is inversely correlated with increased MTAC Cr—the more common cause of UFF. Our results accord with those of Parikova et al. (23): that is, by analyzing fluid transport pathways and their determinants in patients with UFF, documented early-stage UFF is associated with a decline in FWT dependent on increased effective capillary surface area without significant decrease of FWT contribution. Later, aquaporin dysfunction and additional interstitial changes combine to cause a significant decline in the FWT fraction with loss of glucose osmotic conductance. Interestingly, we found that small-pore and aquaporin water transport both positively correlate in non-UFF patients; however, in acquired UFF, a disproportionate profile was documented, suggesting that ultrasmall-pore transport indeed depends on other than the effective capillary surface. Interstitial fibrosis may explain this “uncoupling” between changes in small-pore transport and in FWT that we observed in patients with UFF (24).
Hence, our procedure allows for an exploration of various time-dependent changes of the ultrasmall- and small-pore water transport pathways. It also enables the identification of causes of UFF in our population, with important repercussions for PD prescription. Among the 11 patients with UFF, 5 had a FWTcorrected contribution to UF at 60 minutes that was less than 45%, and only 2 of those 5 were categorized as fast transporters. That finding suggests again a higher compromise of FWT, disproportionate to higher small-solute transport. This understanding is of particular importance from a clinical viewpoint, because these patients will benefit most from icodextrin instead of hypertonic glucose prescriptions. Extension of the two-in-one protocol (5-hour “uni-PET”) or performance of a double mini-PET (25) to measure glucose osmotic conductance as a second evaluation step could aid in the diagnosis of UFF. However, we skipped such tests because we already adopt icodextrin prescription whenever a patient presents increased effective capillary surface or reduced FWT, abolishing the use of hypertonic 3.86% solutions in regular prescriptions.
One of the limitations of our study is the inability to quantify the lymphatic absorption rate, which is not feasible day-to-day in the clinic, and whose methodology is still under debate (26). It is a known simplification of the three-pore model to assume that absorption of fluid from the peritoneal cavity is constant, at a rate of 0.3 mL per minute. In fact, peritoneal fluid absorption varies between patients and might even be a cause of UFF, but peritoneal absorption remains a difficult problem for investigators, and no clinical procedure is able to exclude peritoneal absorption except by using a macromolecular tracer such as dextran (19) or radioiodinated human serum albumin (27,28). However, high lymphatic absorption is recognized to be mostly a cause of inherent UFF and, more rarely, a cause of acquired UFF (23,29). The fact that UFF presented mostly in our patients with longer time on PD may counteract the effect of this limitation.
CONCLUSIONS
Quantification of FWT is important for detecting causes of UFF beyond increased effective capillary surface. Such quantification is feasible during a routine 4-hour 3.86% PET evaluation with temporary drainage at 60 minutes. This two-in-one protocol provides reliable and useful clinical information concerning both small-solute transport and the various water transport pathways. Furthermore, complicated calculations needed to correct for sodium diffusion are avoided, allowing the test to be easily applied in daily clinical practice. The proposed two-in-one protocol, documenting the most common peritoneal membrane dysfunctions and giving prognostic information, is a simple method for timely detection of membrane failure. We therefore advocate using this PET evaluation in routine annual PD patient management so that therapy can be properly adjusted.
DISCLOSURES
The authors have no financial conflicts of interest to declare.
Acknowledgments
This study was performed partially with the help of investigation grants to RS from Sociedade Portuguesa Nefrologia, Instituto de Salud Carlos III, Fondos FEDER (REDinREN, RETICS 06/0016), and FIS 09/00641.
REFERENCES
- 1. Heimbürger O, Waniewski J, Werynski A, Tranæus A, Lindholm B. Peritoneal transport in CAPD patients with permanent loss of ultrafiltration capacity. Kidney Int 1990; 38:495–506 [DOI] [PubMed] [Google Scholar]
- 2. Krediet RT, Imholz AL, Struijk DG, Koomen GC, Arisz L. Ultrafiltration failure in continuous ambulatory peritoneal dialysis. Perit Dial Int 1993; 13(Suppl 2):S59–66 [PubMed] [Google Scholar]
- 3. Selgas R, Bajo MA, Castro MJ, del Peso G, Aguilera A, Fernández-Perpén A, et al. Risk factors responsible for ultrafiltration failure in early stages of peritoneal dialysis. Perit Dial Int 2000; 20:631–6 [PubMed] [Google Scholar]
- 4. Monquil MC, Imholz AL, Struijk DG, Krediet RT. Does impaired transcellular water transport contribute to net ultrafiltration failure during CAPD? Perit Dial Int 1995; 15:42–8 [PubMed] [Google Scholar]
- 5. Ho-dac-Pannekeet MM, Atasever B, Struijk DG, Krediet RT. Analysis of ultrafiltration failure in peritoneal dialysis patients by means of standard peritoneal permeability analysis. Perit Dial Int 1997; 17:144–50 [PubMed] [Google Scholar]
- 6. Krediet RT, Lindholm B, Rippe B. Pathophysiology of peritoneal membrane failure. Perit Dial Int 2000; 20(Suppl 4):S22–42 [PubMed] [Google Scholar]
- 7. Rippe B, de Arteaga J, Venturoli D. Aquaporins are unlikely to be affected in marked ultrafiltration failure: results from a computer simulation. Perit Dial Int 2001; 21(Suppl 3):S30–4 [PubMed] [Google Scholar]
- 8. La Milia V, Di Filippo S, Crepaldi M, Del Vecchio L, Dell’Oro C, Andrulli S, et al. Mini-peritoneal equilibration test: a simple and fast method to assess free water and small solute transport across the peritoneal membrane. Kidney Int 2005; 68:840–6 [DOI] [PubMed] [Google Scholar]
- 9. Smit W, Struijk DG, Ho-Dac-Pannekeet MM, Krediet RT. Quantification of free water transport in peritoneal dialysis. Kidney Int 2004; 66:849–54 [DOI] [PubMed] [Google Scholar]
- 10. Venturoli D, Rippe B. Validation by computer simulation of two indirect methods for quantification of free water transport in peritoneal dialysis. Perit Dial Int 2005; 25:77–84 [PubMed] [Google Scholar]
- 11. Rodrigues AS, Silva S, Bravo F, Oliveira JC, Fonseca I, Cabrita A, et al. Peritoneal membrane evaluation in routine clinical practice. Blood Purif 2007; 25:497–504 [DOI] [PubMed] [Google Scholar]
- 12. Cnossen TT, Smit W, Konings CJ, Kooman JP, Leunissen KM, Krediet RT. Quantification of free water transport during the peritoneal equilibration test. Perit Dial Int 2009; 29:523–7 [PubMed] [Google Scholar]
- 13. van Biesen W, Heimbürger O, Krediet R, Rippe B, La Milia V, Covic A, et al. Evaluation of peritoneal membrane characteristics: a clinical advice for prescription management by the ERBP working group. Nephrol Dial Transplant 2010; 25:2052–62 [DOI] [PubMed] [Google Scholar]
- 14. Garred LJ, Canud B, Farell PC. A simple kinetic model for assessing peritoneal mass transfer in chronic ambulatory peritoneal dialysis. ASAIO J 1983; 6:131–7 [Google Scholar]
- 15. Teixidó J, Cofan F, Borrás M, Bonet J, Bonal J, Galimany R, et al. Mass transfer coefficient: comparison between methods. Perit Dial Int 1993; 13(Suppl 2):S47–9 [PubMed] [Google Scholar]
- 16. Zweers MM, Imholz AL, Struijk DG, Krediet RT. Correction of sodium sieving for diffusion from the circulation. Adv Perit Dial 1999; 15:65–72 [PubMed] [Google Scholar]
- 17. Westra WM, Smit W, Zweers MM, Struijk DG, Krediet RT. Diffusion correction of sodium sieving applicable in a peritoneal equilibration test. Adv Perit Dial 2003; 19:6–9 [PubMed] [Google Scholar]
- 18. Twardowski ZJ, Nolph KD, Khanna R, Prowant BF, Ryan LP, Moore HL, et al. Peritoneal equilibration test. Perit Dial Bull 1987; 7:138–47 [Google Scholar]
- 19. Parikova A, Smit W, Struijk DG, Zweers MM, Krediet RT. The contribution of free water transport and small pore transport to the total fluid removal in peritoneal dialysis. Kidney Int 2005; 68:1849–56 [DOI] [PubMed] [Google Scholar]
- 20. Waniewski J, Debowska M, Lindholm B. Water and solute transport through different types of pores in peritoneal membrane in CAPD patients with ultrafiltration failure. Perit Dial Int 2009; 29:664–9 [PubMed] [Google Scholar]
- 21. Waniewski J, Debowska M, Lindholm B. Ultrafiltration and absorption in evaluating aquaporin function from peritoneal transport of sodium. Perit Dial Int 2007; 27:687–90 [PubMed] [Google Scholar]
- 22. Asghar RB, Davies SJ. Pathways of fluid transport and reabsorption across the peritoneal membrane. Kidney Int 2008; 73:1048–53 [DOI] [PubMed] [Google Scholar]
- 23. Parikova A, Smit W, Struijk DG, Krediet RT. Analysis of fluid transport pathways and their determinants in peritoneal dialysis patients with ultrafiltration failure. Kidney Int 2006; 70:1988–94 [DOI] [PubMed] [Google Scholar]
- 24. Rippe B, Venturoli D. Simulations of osmotic ultrafiltration failure in CAPD using a serial three-pore membrane/fiber matrix model. Am J Physiol Renal Physiol 2007; 292:F1035–43 [DOI] [PubMed] [Google Scholar]
- 25. La Milia V, Limardo M, Virga G, Crepaldi M, Locatelli F. Simultaneous measurement of peritoneal glucose and free water osmotic conductances. Kidney Int 2007; 72:643–50 [DOI] [PubMed] [Google Scholar]
- 26. Krediet RT. The effective lymphatic absorption rate is an accurate and useful concept in the physiology of peritoneal dialysis. Perit Dial Int 2004; 24:309–13 [PubMed] [Google Scholar]
- 27. Waniewski J, Debowska M, Lindholm B. How accurate is the description of transport kinetics in peritoneal dialysis according to different versions of the three-pore model? Perit Dial Int 2008; 28:53–60 [PubMed] [Google Scholar]
- 28. Waniewski J, Sobiecka D, Debowska M, Heimbürger O, Weryński A, Lindholm B. Fluid and solute transport in CAPD patients before and after permanent loss of ultrafiltration capacity. Int J Artif Organs 2005; 28:976–86 [DOI] [PubMed] [Google Scholar]
- 29. Smit W, Parikova A, Struijk DG, Krediet RT. The difference in causes of early and late ultrafiltration failure in peritoneal dialysis. Perit Dial Int 2005; 25(Suppl 3):S41–5 [PubMed] [Google Scholar]