Abstract
Dialysis regimens for continuous ambulatory peritoneal dialysis (CAPD) patients vary with the need for fluid removal, but also because of concerns about the local and systemic consequences of high glucose exposure. The implications of various regimens for dialysis adequacy—that is, fluid and small-solute removal—are not always clear. We therefore analyzed ultrafiltration (UF) and adequacy indices for 4 different combinations of dialysis fluid.
Collections of 24-hour dialysate and urine were carried out in 99 patients on CAPD. On 4 separate occasions, each patient performed 4 exchanges in 24 hours, including 3 daily exchanges with 1.36% glucose and 1 night exchange with either 1.36% glucose (G1 schedule), 2.27% glucose (G2 schedule), 3.86% glucose (G3 schedule), or icodextrin (Ico schedule). Weekly, total, and dialysis Kt/V and KT were calculated for both urea and creatinine.
The mean values of urea Kt/V and KT were significantly lower for the G1 schedule than for the G3 and Ico schedules. The adequacy indices for overnight application of 3.86% glucose and icodextrin were similar. Using dialysis fluids with 1.36% and 2.27% glucose overnight reduces glucose exposure, but those schedules may provide inadequate UF and small-solute removal in some patients (UF < 1 L daily, Kt/V < 1.7).
Keywords: Continuous ambulatory peritoneal dialysis, ultrafiltration, dialysis adequacy, Kt/V, KT, clearance, urea, creatinine
Glucose is the most commonly used osmotic agent in peritoneal dialysis (PD) fluids, and bags containing solutions with 1.36%, 2.27%, and 3.86% glucose are available in most countries. Among the important problems in PD therapy are the potential side effects of a high glucose load, including metabolic problems and damage to the peritoneal membrane. Icodextrin, a glucose polymer, has been introduced as an alternative to the glucose in PD solutions because it provides better ultrafiltration (UF) during long dwells and reduces the metabolic effects (1,2). The application of various dialysis fluids influences fluid and solute removal.
The European Best Practice Guidelines and the Kidney Disease Outcomes Quality Initiative guidelines indicate that adequacy targets for dialysis should include both urea removal and fluid removal (3,4). Targets should be based only on the removals achieved by PD. According to the guidelines, the minimum peritoneal target for urea Kt/V should be 1.7 weekly, and the minimum peritoneal target for net UF (in anuric patients) should be 1.0 L in 24 hours (3,4). Previously, a minimum weekly creatinine clearance target of 60 L/1.73 m2 was commonly applied (5); however, this target clearance is not included in the current guidelines (4).
In the present study, we used a uniform schedule of daily exchanges to investigate both fluid removal (peritoneal net UF, urine volume, and total fluid removal) and a battery of dialysis adequacy indices (DAIs) based on small solutes (both urea and creatinine) in anuric and non-anuric continuous ambulatory PD (CAPD) patients.
METHODS
The study was performed in 99 patients on CAPD (mean age: 54 ± 13 years; 56 men). Four patients were low transporters, 38 were low-average, 48 were high-average, and 8 patients were high transporters according to Twardowski’s peritoneal equilibration test classification (9); 1 patient was not classified because of lack of data. Of the 99 patients, 46 were anuric (daily urine output <100 mL), 52 were non-anuric, and 1 patient was not classified.
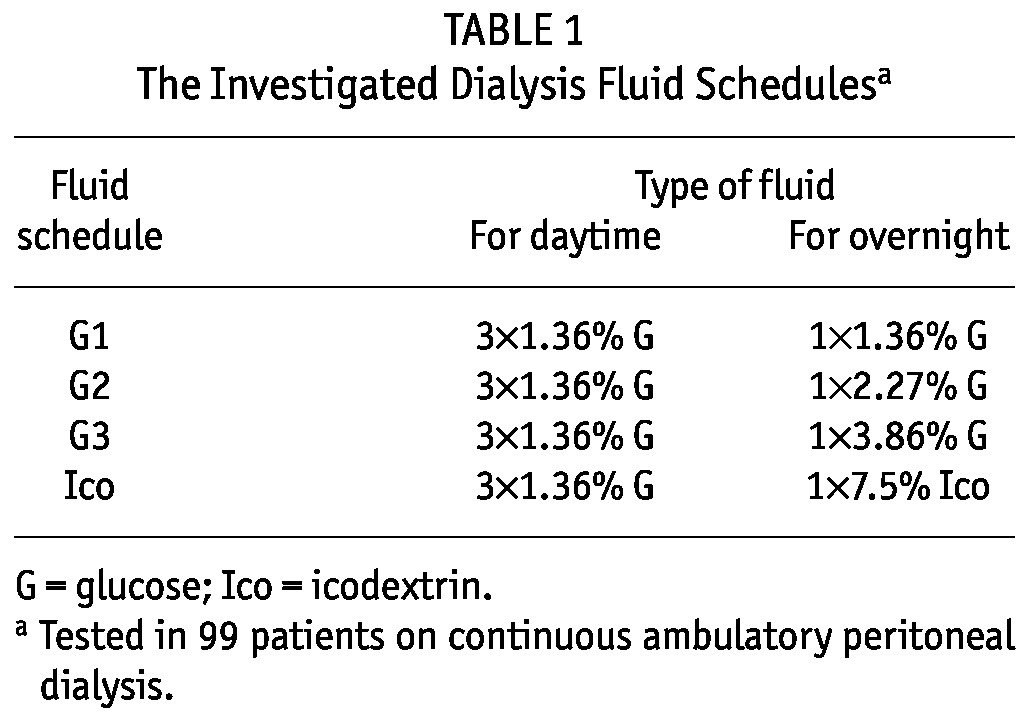
The 4 study schedules each consisted of 4 exchanges in 24 hours (Table 1): 3 daytime exchanges using one type of glucose-based dialysis fluid (always 1.36% glucose) and 1 overnight exchange using 4 different types of dialysis fluid in each patient: 1.36% (G1 schedule), 2.27% (G2 schedule), or 3.86% glucose (G3 schedule), or 7.5% icodextrin (Ico schedule). Typically, the infused volume was 8.3 L daily, but in 13 of 396 collections, it was less—that is, 6 L - 7.6 L—including the overfill volume at 75 mL per bag [see, for example, Davies (10) and La Milia et al. (11)]. Each schedule was performed in each patient, and 24-hour drained dialysate and urine were collected. The fluids were mixed (separately by patient), and urine and dialysate samples were taken for concentration measurements.
TABLE 1.
The Investigated Dialysis Fluid Schedulesa
The DAIs used in the study included the fractional volume cleared from urea or creatinine; Kt/V, which is a type of fractional solute removal index; and KT (weekly clearance) of urea or creatinine, which is a type of equivalent continuous clearance (6-8). Volumes of urine and dialysate (by 24-hour collection) and of total body water (by bioimpedance), and serum concentrations of urea and creatinine were measured. The measured solute concentrations and volumes were used to estimate DAIs based on a calculation of the total solute mass in the patient’s body and the solute mass removed from the body.
Weekly dialysis (subscript “d”) and weekly total Kt/V and KT (in liters) were calculated as follows (6,7):
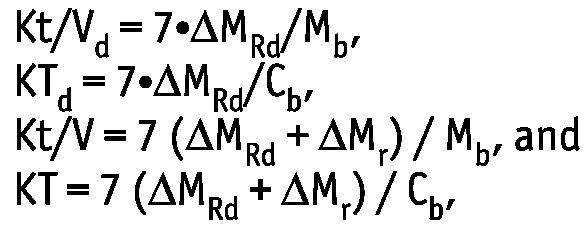 |
where ΔMRd and ΔMr are, respectively, the solute masses in 24-hour dialysate and urine collections; Mb is the solute mass in the body; and Cb is the solute concentration in serum. Dialytic Kt/V and total Kt/V are the same as the index Kt/V urea regularly used in clinical practice for the assessment of PD efficiency.
For creatinine, the weekly clearance, ClCr, scaled to body surface area (BSA), is often calculated as follows:
 |
where ΔMR,Cr is the sum of the creatinine mass in 24-hour dialysate and urine collections, and Cb,Cr is the serum creatinine concentration. Thus, ClCr is equal to creatinine KT scaled by the factor 1.73 / BSA.
Ultrafiltration was calculated as the difference between the volume of collected dialysate and the volume of fluid infused per bag of dialysate.
STATISTICAL ANALYSIS
For multiple comparisons of the results obtained by applying the 4 different fluid schedules, a one-way analysis of variance and the Tukey-Kramer honestly significant difference criterion were applied. Comparisons between anuric and non-anuric patients were performed using the t-test or two-sided rank sum test, as applicable. For each variable, the hypothesis about normal distribution was checked by a chi-square goodness-of-fit test. Spearman correlation analysis was used to investigate possible relations between the studied parameters. A p value less than 0.05 was considered statistically significant.
RESULTS
Urea and creatinine concentrations in serum (measured once for 4 daily collections) were, respectively, 116.7 ± 36.1 mg/dL and 10.7 ± 3.6 mg/dL.
UF AND TOTAL FLUID REMOVAL
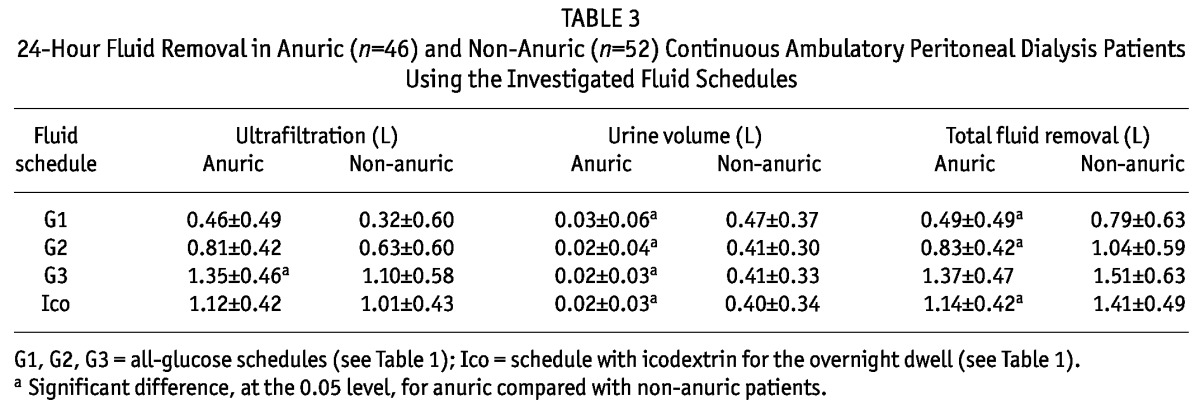
The 24-hour net peritoneal UF was different for most of the dialysis schedules, except for G3 and Ico, which had similar daily UF values. The 24-hour urine volumes collected concomitantly with the dialysate collections were all similar (Table 2). In the G1 and G2 schedules, the daily mean UF was less than 1 L, a value that may not be acceptable for anuric patients. In fact, 24-hour UF and total fluid removal were much lower than 1 L for the G1 and G2 schedules in anuric patients (Table 3). There was a tendency for UF to be higher in anuric than in non-anuric patients, but the difference was statistically significant only for the G3 schedule (Table 3). The total fluid removal was lower in anuric than in non-anuric patients, but for schedule G3, the difference was not statistically significant (Table 3).
TABLE 2.
Adequacy Parameters (Mean ± Standard Deviation) for the Investigated Fluid Schedules
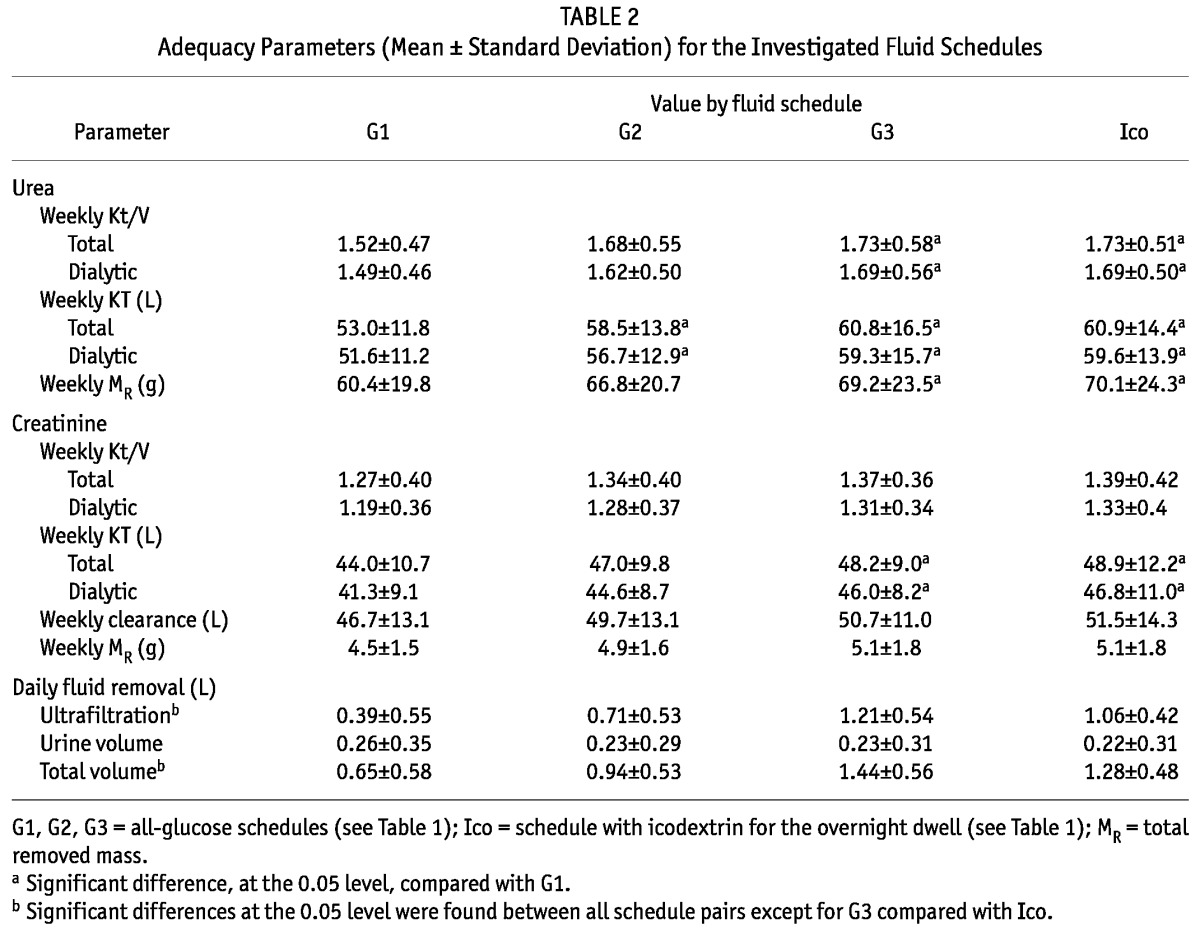
TABLE 3.
24-Hour Fluid Removal in Anuric (n=46) and Non-Anuric (n=52) Continuous Ambulatory Peritoneal Dialysis Patients Using the Investigated Fluid Schedules
ADEQUACY OF VARIOUS DIALYSIS SCHEDULES
Table 2 shows the Kt/V and KT for urea and creatinine and the ClCr for the 4 dialysis fluid schedules. The mean value of urea Kt/V in schedule G1 (and marginally in schedule G2) was below 1.7—that is, the minimum suggested by international guidelines (3,4). The mean value of urea Kt/V was significantly lower for the G1 schedule than for the G3 and Ico schedules. The mean values of creatinine Kt/V and ClCr were similar in all investigated schedules. The Kt/V and KT for urea were about 26% higher than those for creatinine. Weekly ClCr—that is, KT scaled using 1.73 m2 /BSA m2—was about 6% higher than KT without scaling.
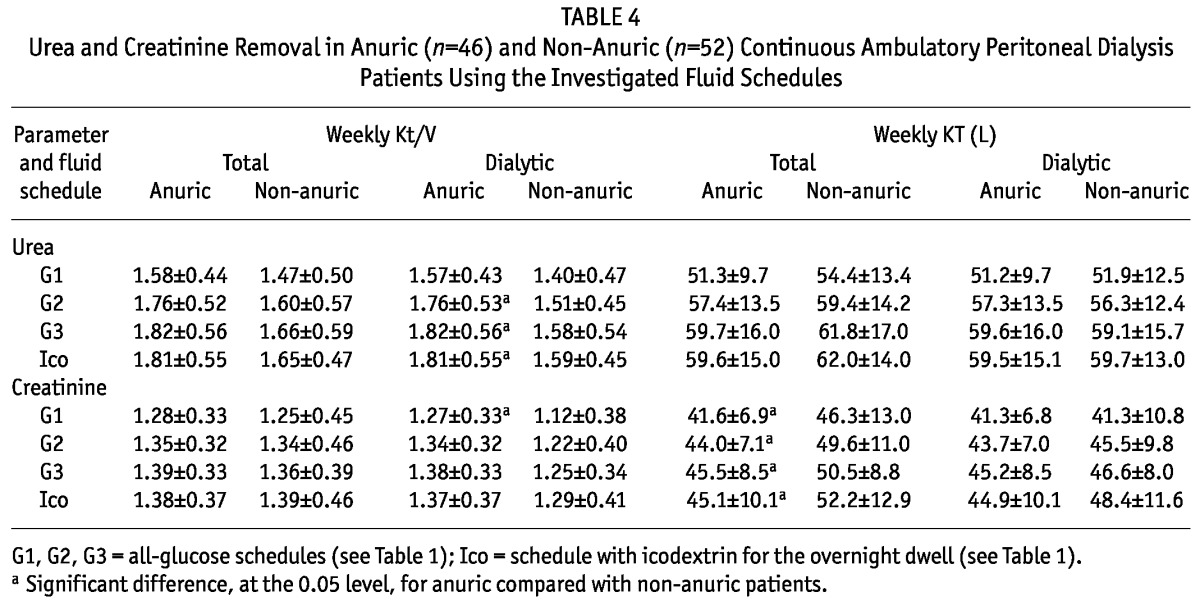
The KTd was similar in anuric and non-anuric patients for both urea and creatinine; however, the Kt/Vd was higher for anuric than for non-anuric patients (Table 4) because of a lower V for anuric patients (total body water was 33.9 ± 7.5 L for anuric patients and 39.0 ± 9.3 L for non-anuric patients, p < 0.01). Total KT—that is, dialytic plus residual renal KT—was, as expected, lower for anuric patients (although the difference was statistically significant only for creatinine). No significant difference was found for total Kt/V (Table 4).
TABLE 4.
Urea and Creatinine Removal in Anuric (n=46) and Non-Anuric (n=52) Continuous Ambulatory Peritoneal Dialysis Patients Using the Investigated Fluid Schedules
CORRELATIONS BETWEEN KT/V, KT, UF, AND SERUM CONCENTRATIONS AND REMOVED MASSES OF UREA AND CREATININE
In the analyzed dialysis schedules, urea Kt/V and urea KT both correlated with UF (0.23 < r < 0.53, p < 0.05). However, no correlation was observed between the dialysis adequacy indices (Kt/V and KT) for creatinine and UF, except in the Ico schedule (0.35 < r < 0.42, p < 0.01).
The correlations between the various DAIs and other parameters, and their statistical significance, were similar when analyzed separately for each schedule. We therefore present only the pooled data for all schedules (Tables 5, 6, and 7). Urea Kt/V was positively correlated with creatinine Kt/V, and urea KT with creatinine KT, but the latter correlation was weaker (Table 5). There was a strong relation between the urea and creatinine masses removed by the kidneys (r = 0.95, p < 0.01), but the correlation between the urea and creatinine masses removed by dialysis was weaker (r = 0.57, p < 0.01). Serum urea and creatinine concentrations were also correlated (Table 5). The masses removed by dialysis correlated positively with serum concentrations for urea and creatinine (r = 0.76 and r = 0.79 respectively), but similar correlations for the masses removed in urine were much weaker and negative for creatinine (r = 0.15 for urea and r = -0.24 for creatinine, Tables 6 and 7).
TABLE 5.
Correlations (r Values)a Between Creatinine- and Urea-Based Adequacy Parameters in All Patients
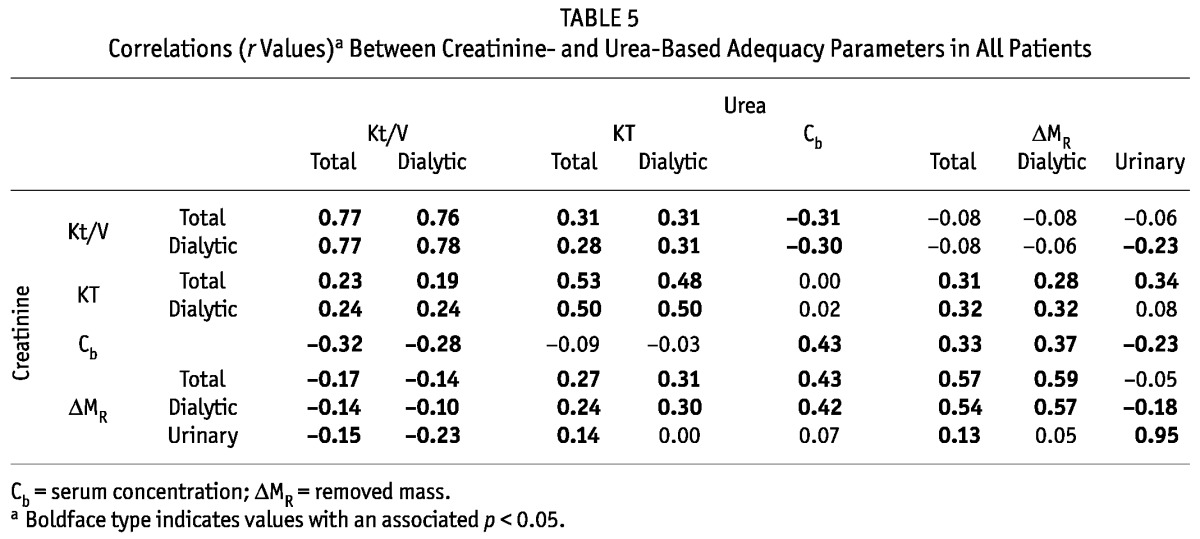
TABLE 6.
Correlations (r Values)a Between Urea-Based Adequacy Parameters in All Patients
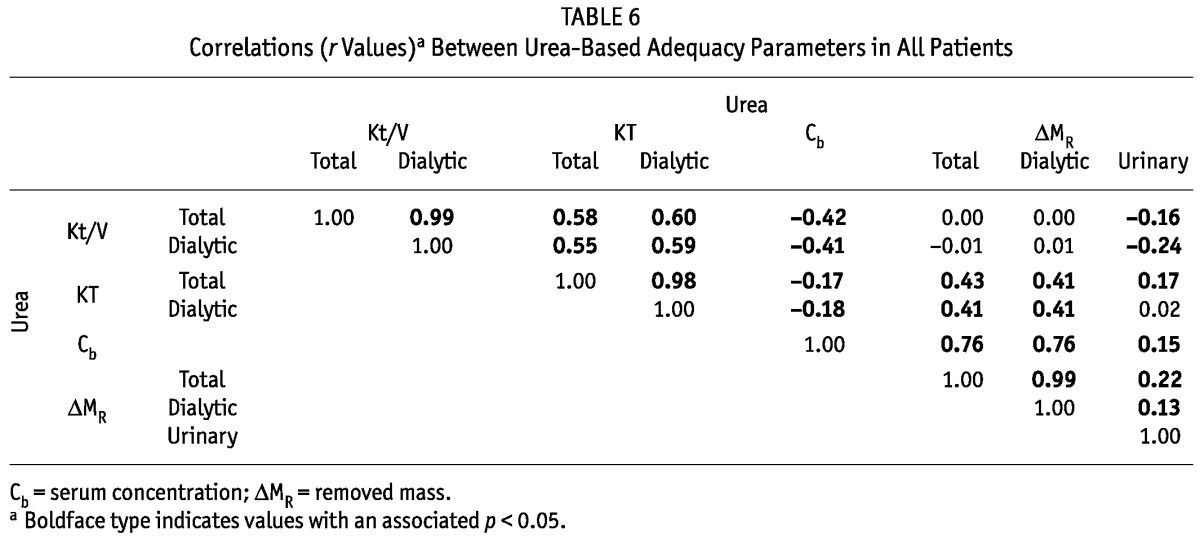
TABLE 7.
Correlations (r Values)a Between Creatinine-Based Adequacy Parameters in All Patients
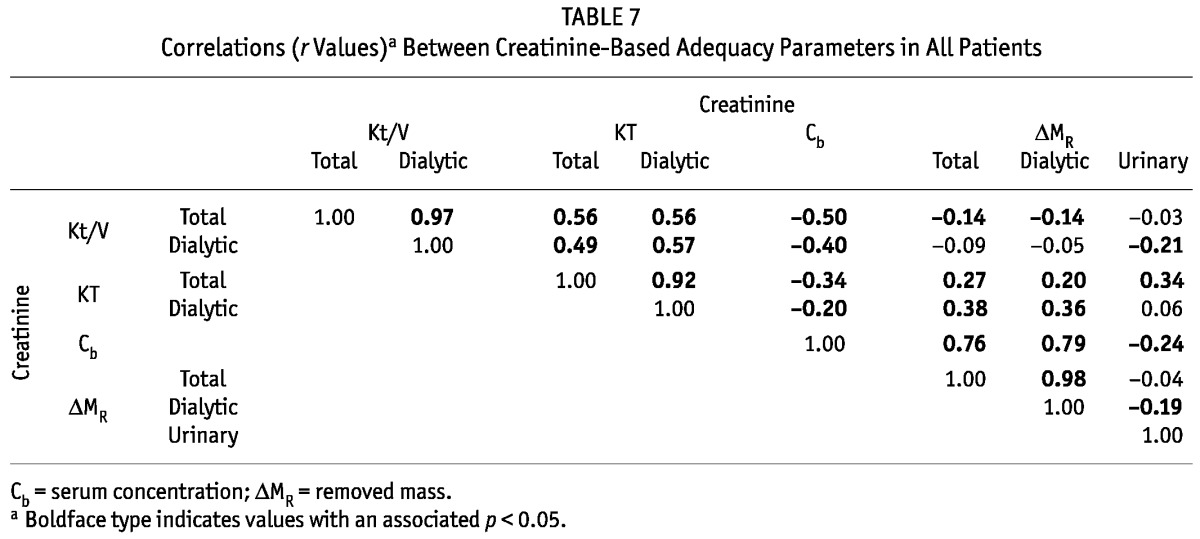
When considered separately for urea and creatinine, total and daily KT correlated with the respective Kt/V (Tables 6 and 7). For creatinine and urea, we observed negative associations between the serum concentration and the Kt/V and KT (-0.5 ≤ r ≤ -0.17, Tables 6 and 7). No or only a weak relation was observed between the total removed mass of urea and creatinine and total Kt/V, but correlations were found between total KT and total removed mass for urea and creatinine (r = 0.43 and r = 0.27 respectively, Tables 6 and 7). Similar correlations, or a lack of correlation, were found between the masses removed by dialysis and the estimated DAIs (Tables 6 and 7).
DISCUSSION
Assessments of adequacy for 4 different CAPD schedules were performed using two different DAIs (Kt/V and KT, estimated for both urea and creatinine) in 99 patients from 24-hour collections of dialysate and urine. Peritoneal net UF, urine volume, and total fluid removal were investigated separately in anuric and non-anuric patients. To the best of our knowledge, neither the KT for urea, nor the Kt/V and KT for creatinine, have previously been reported for CAPD patients, although some studies have addressed those indices for other treatment modalities (12-14).
Our work showed that, in some patients, the use of 3 daily 1.36% glucose exchanges and 1 overnight exchange with either 1.36% glucose (G1) or 2.27% glucose (G2) may not provide acceptable dialysis adequacy (“inadequacy” here defined as a weekly Kt/V urea below 1.7). The G1 and G2 schedules both resulted in a 24-hour net peritoneal UF below 1.0 L in several patients, which can be considered too low according to current guidelines (3). The UF volumes and DAIs for patients using 3.86% glucose (G3) or icodextrin (Ico) overnight were similar and generally accorded with established targets.
The analysis of various dialysis schedules showed that UF correlated better with urea adequacy indices than with creatinine indices, because urea concentrations in dialysate and in blood equilibrate during dialysis. By contrast, the creatinine concentration in dialysate is considerably lower than that in serum at the end of a dwell (15). The removal of urea in PD therefore strongly depends on fluid removal, but the dialytic removal of creatinine depends on both the UF and the rate of creatinine diffusive transport.
The urea and creatinine masses removed by dialysis correlated positively with serum concentrations, but similar correlations for the mass removed with urine were much weaker and even negative for creatinine (Tables 6 and 7). That observation agrees with the prevailing understanding of diffusive transport for those two solutes during dialysis. However, the solute DAIs correlated negatively with their respective serum concentrations (Table 6 and 7), meaning that patients with higher DAIs have lower serum levels of the removed solutes, despite the solute mass removed by dialysis being generally lower in patients with a low serum concentration of that solute. It is important to note that the 24-hour studies reported here used fluid schedules that were not the schedules prescribed for the study patients (nevertheless, 95 of the 99 patients routinely used one of the 4 fluid schedules in the clinical protocol), and therefore the removed mass was not, in general, equal to the generated mass (except for the routine schedule of the patient). However, the DAIs can also be assessed for non-steady metabolic conditions (8,12).
It is interesting to observe that, although the Kt/V and KT indices correlated (Tables 6 and 7), the correlations were not very strong (r2 < 0.36). It might then be inferred that those two types of indices are sensitive to factors (such as differences in the generation rates for urea and creatinine) other than the removed masses and serum concentrations alone. Furthermore, the correlations between the Kt/V indices for urea and creatinine were much stronger (r2 > 0.58) than the correlations between the KT indices for those two solutes (r2 < 0.28, Table 5). In the evaluation of dialysis adequacy for patients on PD, the focus has long been on the urea Kt/V, and attention to urea KT, creatinine Kt/V, and (at least recently) creatinine KT (that is, in the form of ClCr) has been lacking. The focus on urea Kt/V in the clinical and research settings is, to some extent, justified by our finding that urea Kt/V correlates with all other DAIs. On the other hand, our data and some previous studies also show that, when only urea Kt/V is used, some information about the removal of small solutes is lost because the correlations between urea Kt/V and other parameters are generally weak [see Tables 5 and 6, and reports by other authors (16-18)]. Therefore, although the standard clinical evaluation of adequacy may be—for practical reasons—reduced to one adequacy index (urea Kt/V), it would be reasonable that future clinical studies on the relationship between dialysis adequacy and patient survival also take into account other indices in the extended DAI system, and that assessments be based at least on two small solutes, urea and creatinine.
DISCLOSURES
BL is employed by Baxter Healthcare Corporation. The remaining authors have no financial conflicts of interest to disclose.
REFERENCES
- 1. Freida P, Issad B, Dratwa M, Lobbedez T, Wu L, Leypoldt JK, et al. A combined crystalloid and colloid PD solution as a glucose-sparing strategy for volume control in high-transport APD patients: a prospective multicenter study. Perit Dial Int 2009; 29:433–42 [PubMed] [Google Scholar]
- 2. Paniagua R, Ventura MD, Avila-Díaz M, Cisneros A, Vicenté-Martínez M, Furlong MD, et al. Icodextrin improves metabolic and fluid management in high and high-average transport diabetic patients. Perit Dial Int 2009; 29:422–32 [PubMed] [Google Scholar]
- 3. Dombros N, Dratwa M, Feriani M, Gokal R, Heimbürger O, Krediet R, et al. European best practice guidelines for peritoneal dialysis. 7. Adequacy of peritoneal dialysis. Nephrol Dial Transplant 2005; 20(Suppl 9):24–7 [DOI] [PubMed] [Google Scholar]
- 4. Peritoneal Dialysis Adequacy 2006 Work Group. Clinical practice guidelines for peritoneal adequacy, update 2006. Am J Kidney Dis 2006; 48(Suppl 1):S91–7 [DOI] [PubMed] [Google Scholar]
- 5. II. NKF-K/DOQI clinical practice guidelines for peritoneal dialysis adequacy: update 2000. Am J Kidney Dis 2001; 37(Suppl 1):S65–136 [DOI] [PubMed] [Google Scholar]
- 6. Waniewski J, Debowska M, Lindholm B. Theoretical and numerical analysis of different adequacy indices for hemodialysis and peritoneal dialysis. Blood Purif 2006; 24:355–66 [DOI] [PubMed] [Google Scholar]
- 7. Waniewski J, Lindholm B. Fractional solute removal and Kt/V in different modalities of renal replacement therapy. Blood Purif 2004; 22:367–76 [DOI] [PubMed] [Google Scholar]
- 8. Waniewski J, Debowska M, Lindholm B. Can the diverse family of dialysis adequacy indices be understood as one integrated system? Blood Purif 2010; 30:257–65 [DOI] [PubMed] [Google Scholar]
- 9. Twardowski ZJ. PET—a simpler approach for determining prescriptions for adequate dialysis therapy. Adv Perit Dial 1990; 6:186–91 [PubMed] [Google Scholar]
- 10. Davies SJ. Overfill or ultrafiltration? We need to be clear. Perit Dial Int 2006; 26:449–51 [PubMed] [Google Scholar]
- 11. La Milia V, Pozzoni P, Crepaldi M, Locatelli F. Overfill of peritoneal dialysis bags as a cause of underestimation of ultrafiltration failure. Perit Dial Int 2006; 26:503–5 [PubMed] [Google Scholar]
- 12. Debowska M, Lindholm B, Waniewski J. Adequacy indices for dialysis in acute renal failure: kinetic modeling. Artif Organs 2010; 34:412–19 [DOI] [PubMed] [Google Scholar]
- 13. Leypoldt JK, Burkart JM. Small-solute and middle-molecule clearances during continuous flow peritoneal dialysis. Adv Perit Dial 2002; 18:26–31 [PubMed] [Google Scholar]
- 14. Leypoldt JK, Jaber BL, Lysaght MJ, McCarthy JT, Moran J. Kinetics and dosing predictions for daily haemofiltration. Nephrol Dial Transplant 2003; 18:769–76 [DOI] [PubMed] [Google Scholar]
- 15. Waniewski J, Heimbürger O, Werynski A, Park MS, Lindholm B. Diffusive and convective solute transport in peritoneal dialysis with glucose as an osmotic agent. Artif Organs 1995; 19:295–306 [DOI] [PubMed] [Google Scholar]
- 16. Blake P, Burkart JM, Churchill DN, Daugirdas J, Depner T, Hamburger RJ, et al. Recommended clinical practices for maximizing peritoneal dialysis clearances. Perit Dial Int 1996; 16:448–56 [PubMed] [Google Scholar]
- 17. Blake PG. Creatinine is the best molecule to target adequacy of peritoneal dialysis. Perit Dial Int 2000; 20(Suppl 2):S65–9 [PubMed] [Google Scholar]
- 18. Vonesh EF, Moran J. Discrepancies between urea Kt/V versus normalized creatinine clearance. Perit Dial Int 1997; 17:13–16 [PubMed] [Google Scholar]


