Abstract
♦ Background: Fast transport status, acquired with time on peritoneal dialysis (PD), is a pathology induced by peritoneal exposure to bioincompatible solutions. Fast transport has important clinical consequences and should be prevented.
♦ Objective: We analyzed the repercussions of initial peritoneal transport characteristics on the prognosis for peritoneal membrane function, and also whether the influence of peritonitis and high exposure to glucose are different according to the initial peritoneal transport characteristics or the moment when such events occur.
♦ Methods: The study included 275 peritoneal dialysis patients with at least 2 peritoneal function studies (at baseline and 1 year). Peritoneal kinetic studies were performed at baseline and annually. Those studies consist of a 4-hour dwell with glucose (1.5% during 1981 - 1990, and 2.27% during 1991 - 2002) to calculate the peritoneal mass transfer coefficients of urea and creatinine (milliliters per minute) using a previously described mathematical model.
♦ Results: Membrane prognosis and technique survival were independent of baseline transport characteristics. Fast transport and ultrafiltration (UF) failure are reversible conditions, provided that peritonitis and high glucose exposure are avoided during the early dialysis period. The first year on PD is a main determining factor for the membrane’s future, and the mass transfer coefficient of creatinine at year 1 is the best functional predictor of future PD history. After 5 years on dialysis, permeability frequently increases, and UF decreases. Icodextrin is associated with peritoneal protection.
♦ Conclusions: Peritoneal membrane prognosis is independent of baseline transport characteristics. Intrinsic fast transport and low UF are reversible conditions when peritonitis and high glucose exposure are avoided during the early dialysis period. Icodextrin helps in glucose avoidance and is associated with peritoneal protection.
Keywords: Peritoneal transport outcome, bioincompatible solution, peritonitis
As a kidney substitutive treatment, peritoneal dialysis (PD) has been shown to achieve results similar to those achieved with hemodialysis (HD) in the medium term (1-4). However, the ability to use a living tissue for dialysis is determined by intrinsic membrane differences, including structural characteristics and reactions to inflammation and to exposure to bioincompatible fluids. In fact, during the era of bioincompatible solutions, 20% - 30% of patients experienced an increase in peritoneal permeability to small solutes, accompanied by a decrease in ultrafiltration (UF) capacity, after 3 - 4 years on PD (5-9). This phenomenon, called “acquired fast transport” (FT), has been attributed to various factors, mainly peritoneal inflammation (5) and solutions with an acidic pH or a high glucose concentration (8-10). It is also associated with dialysis-induced anatomic changes such as epithelial-to-mesenchymal transition of mesothelial cells (11), submesothelial fibrosis, and angiogenesis (12). However, most of the basal or acquired variability in peritoneal transport remains unexplained, and genetic or intrinsic factors may play an important role (13).
Controversy surrounds the influence of intrinsic (demonstrable at PD initiation) conditions on patient and membrane survival. Earlier studies conducted by our group showed a large variability in peritoneal transport—both for water and small solutes—at PD start (14), with no effects on peritoneal or patient survival (15). Those findings contrast with data presented by other authors that show a relationship between faster initial transport and poorer survival (16). Also, our data and those of others have shown that initial FT values decline toward normal values over the first dialysis year (6,17,18); however, other authors have found a very early and persistent increase in peritoneal permeability (9). A recent review divided inherent membrane failure in two types, one associated with vasculopathy and endothelial dysfunction and related to comorbidity; and the other associated with a large peritoneal surface area. The prognosis is usually poor in the former case and good in the latter (19).
Our objectives in the present study were to analyze the repercussions of initial peritoneal transport characteristics on the prognosis for peritoneal membrane function, and also whether the influence of peritonitis and high exposure to glucose are different according to the initial peritoneal transport characteristics or the moment when such events occur. A secondary aim was to discover whether clinical maneuvers such as use of automated PD (APD) and icodextrin prevent the development of acquired FT.
METHODS
PATIENTS
Initially, the study encompassed 403 incident patients from the La Paz University Hospital PD program who were treated between 1980 and 2002. All had a peritoneal function study performed during the first 2 months on PD. Exclusion criteria were age under 18 or over 85 years; previous time on PD or kidney transplantation; and use of PD fluids low in glucose degradation products or containing bicarbonate or amino acids. Patients using an icodextrin bag daily either from the beginning or at any time were included. Table 1 shows the demographic, clinical, and baseline peritoneal characteristics of those 403 patients.
TABLE 1.
Demographic, Clinical, and Baseline Peritoneal Function Characteristicsa of the Study Patients
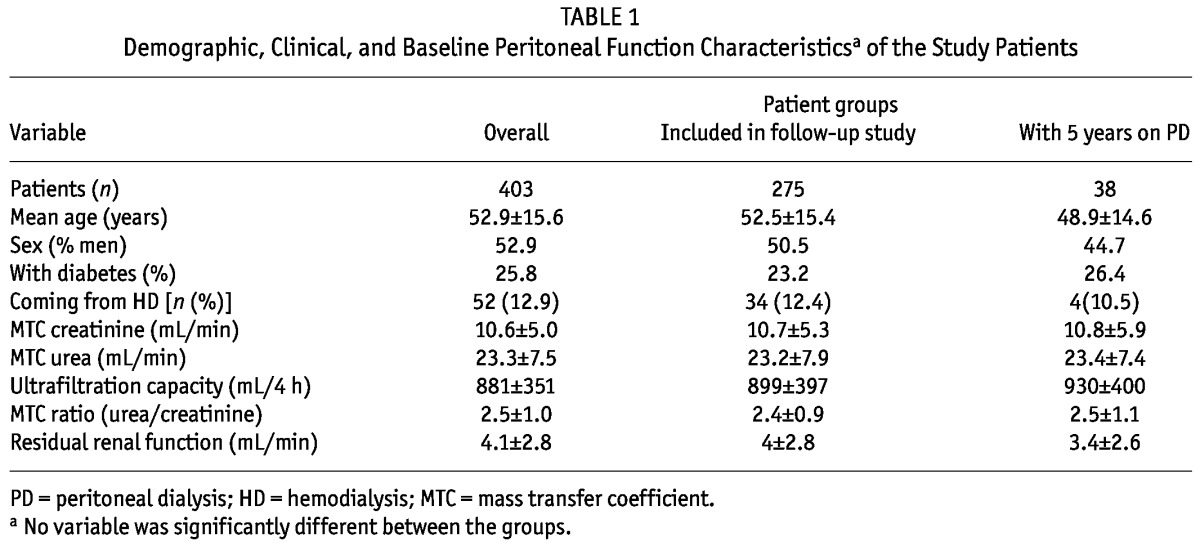
Peritoneal kinetic studies were performed at baseline and annually. The patients included in each annual period from baseline to dialysis year 9 numbered 403, 275, 170, 101, 67, 38, 27, 16, 12, and 9. Because the purpose of the present study was to investigate peritoneal function outcome, we analyzed the 275 patients who had at least 2 peritoneal function studies (baseline and year 1). All results and analysis refer to that group, which was not demographically and clinically different from the entire group of patients (Table 1).
Peritonitis episodes, registered both as episodes and as number of days of peritoneal inflammation, were recorded for each dialysis year to evaluate any direct effects on the subsequent peritoneal kinetic study. To evaluate the effect of PD on peritoneal function in the absence of peritonitis, patients were studied until a first peritonitis episode.
To quantify the effect of peritoneal glucose load on peritoneal function, we calculated the percentage of bags with 2.27% and 3.86% glucose content. Use of 2.27% bags exceeding 75% or use of 3.86% bags exceeding 25% was considered to be high glucose exposure (HGE); this level of exposure was expressly selected in all our cases to exceed the more than 6% described by Davies as high exposure (9). To evaluate the direct effect of such exposure on a subsequent peritoneal kinetic study, data were recorded for each dialysis year.
From PD start, only 21 and 14 patients used icodextrin or APD respectively, but changes in PD modality [APD to or from continuous ambulatory PD (CAPD)] and use of icodextrin were recorded in subsequent dialysis years. At years 1, 2, 3, 4, and 5 respectively, patients using icodextrin numbered 41, 39, 18, 14, and 6, and those using APD numbered 47, 44, 20, 19, and 11.
PERITONEAL FUNCTION STUDIES
Each peritoneal transport kinetic study consisted of a 4-hour glucose dwell (1.5%, 1981-1990; 2.27%, 1991-2002), with 6 peritoneal effluent samples (at 0, 30, 60, 120, 180, and 240 minutes) and 1 blood sample being taken for calculation of the peritoneal mass transfer coefficient (MTC) of urea and creatinine (Cr) in milliliters per minute using a previously described mathematical model (5). All studies were performed while the patients were stable on PD, not having experienced a peritonitis episode during at least the preceding 4 weeks.
Daily UF capacity was estimated by weighted negative balance between infused and drained bags under a standardized dialysis schedule: three 2-L exchanges with 1.5% glucose, and one 2-L exchange with 4.25% glucose on the same day. For patients not using that schedule, we developed a nomogram for use by all members of the PD unit to calculate UF capacity under equivalent exchange conditions for dwell and glucose level; that methodology has already been described by our group (5).
STATISTICAL ANALYSIS
Using quartile distribution, the MTC Cr was divided into low [L (slow)] transporters (<7.2 mL/min; mean: 5.5 ± 1.3 mL/min; n = 72); low-average (LA; 7.2 - 9.7 mL/min; mean: 8.4 ± 0.7 mL/min; n = 66); high-average (HA; 9.7 - 12.9 mL/min; mean: 11.3 ± 0.9 mL/min; n = 70), and high [H (fast)] transporters (>12.9 mL/min; mean: 17.8 ± 5.3 mL/min; n = 67).
Values are expressed as percentages and means ± standard deviations, or as medians and ranges when distribution is not normal. Percentages were compared using the chi-square test; means, the Student t-test for unpaired data; and medians, the Mann-Whitney test. To analyze the simultaneous effect of several variables on UF failure, a Cox proportional hazards analysis was applied. A value of p < 0.05 was considered statistically significant.
Because of the progressive introduction of APD (starting in 1995) and icodextrin (starting in 1998) at our facility, and a change in the glucose level of the PD fluid used for peritoneal kinetic studies (to 2.27% from 1.36%), an analysis by dialysis vintage was performed.
Comparisons between groups were conducted by fitting a linear regression to the repeated measures in each group and by comparing the slopes of the corresponding regression lines (post-hoc Bonferroni test). To study the variable outcomes, a mixed-model analysis that allows for the evaluation of co-variables (the appearance of peritonitis, changes in intraperitoneal glucose load, and use of icodextrin during the interval) was applied. The linear mixed-model analysis, with its unstructured covariance matrix for quantitative variables (UF and creatinine transport parameters) in the framework of generalized mixed-models, allowed for the study of the complete outcome of each variable over time. The results should be interpreted as follows:
“Significant group” means that having or not having peritonitis is different, but that the variation over time is not significantly different (parallelism is maintained).
“Significant time” means that time affects both groups similarly.
“Significant model” means that the group-time interaction is p < 0.01.
For the statistical analysis, we used the SPSS software program (version 15: SPSS, Chicago, IL, USA).
RESULTS
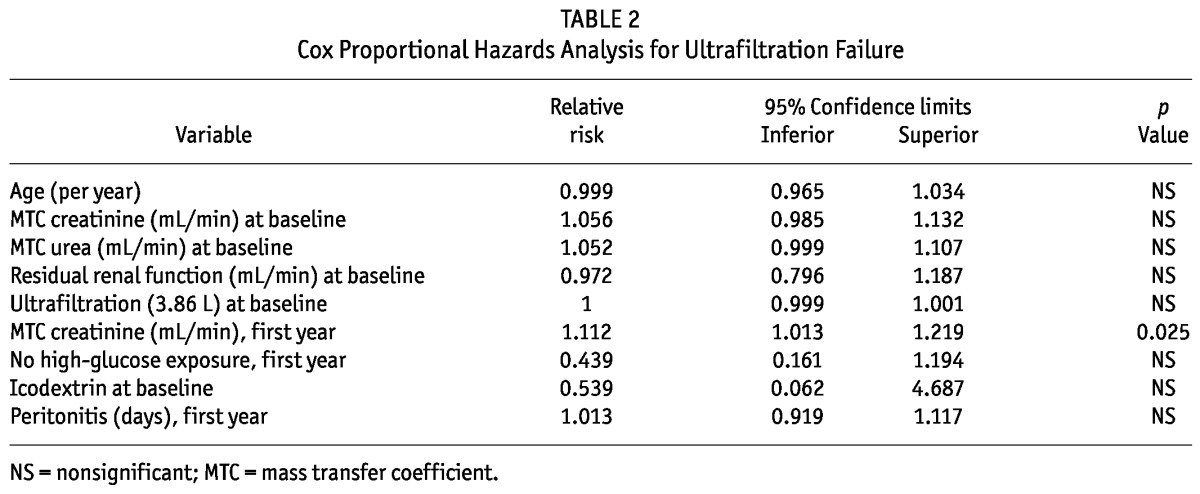
The median follow-up time for the complete series was 30 months (range: 12 - 193 months). During follow-up, 16 patients were transferred to hemodialysis because of UF failure. Comparing those patients with the rest of the cohort, we found a significant difference in median follow-up [48 months (range: 16 - 127 months) vs 30 months (range: 12 - 193 months), p < 0.05] and median accumulated days of active peritonitis [9.5 months (range: 0 - 32 months) vs 2 months (range: 0 - 36 months), p < 0.05]. At baseline, no differences in MTC Cr, UF capacity, and residual renal function (RRF) were found. A Cox proportional hazards analysis that included the results of peritoneal transport kinetic studies at baseline and year 1, RRF, and peritonitis episodes and glucose overexposure during year 1, showed that only the 1-year MTC Cr was significantly associated with UF failure (Table 2). The table omits data about year 1 MTC urea, UF, and RRF because those variables do not fit into the model when year 1 MTC Cr is included (relative risk: 1.112; 95% confidence interval: 1.013 to 1.219; p = 0.025).
TABLE 2.
Cox Proportional Hazards Analysis for Ultrafiltration Failure
MTC CR OUTCOME
Figure 1 shows the MTC Cr outcome over the study period. Similar results are seen for patients reaching 1, 2, 3, 4, and 5 years on dialysis [Figure 1(A)]. In all groups, we observed a decrease in MTC Cr from baseline to year 2 and a general increase after 4 - 5 years on PD. Figure 1(B) shows the MTC Cr outcome for the 38 patients who reached 5 years on PD. In their case, the year 1 to year 2 decrease was nonsignificant relative to baseline, but a statistically significant increase was observed from year 4 to year 5 (from year 1 to year 5: p = 0.036; from year 2 to years 4 and 5: p = 0.037 and p = 0.007 respectively).
Figure 1.
— Mass transfer coefficient of creatinine (MTCcr) (A) in all patients, and (B) in the 38 patients who reached 5 years on peritoneal dialysis. In the latter patients, the decline in MTCcr from year 1 to year 2 was nonsignificant relative to baseline. * Statistically significant increase compared with year 1. † Statistically significant increase compared with year 2.
UF CAPACITY OUTCOME
Figure 2 shows the UF capacity outcome. In mirror image relative to the MTC Cr, a nonsignificant increase in UF capacity over the first year is seen, with a significant and progressive decline after 4 - 5 years on PD, especially relative to values at years 1 and 2. Significance was confirmed by the mixed-model analysis.
Figure 2.
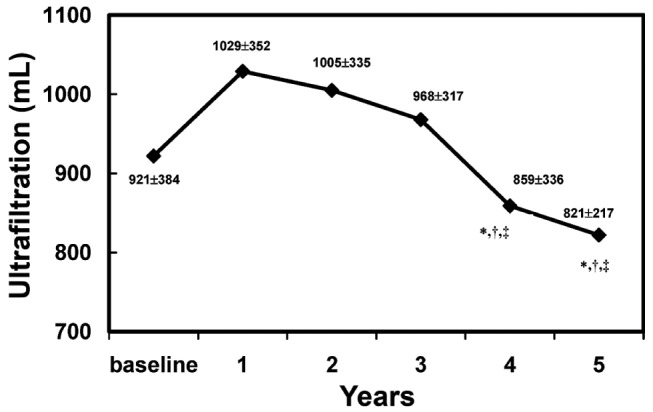
— Ultrafiltration capacity over time. Ultrafiltration capacity increased nonsignificantly during year 1. * Statistically significant decrease compared with year 1. † Statistically significant decrease compared with year 2. ‡ Statistically significant decrease compared with year 3.
EFFECT OF BASELINE TRANSPORT CHARACTERISTICS
Baseline MTC Cr values by transport quartile were associated with different outcomes after 5 years on PD (Figure 3). Patients in the faster transport quartiles showed a tendency toward diminishing MTC Cr values, and patients in the slower quartiles tended to show increasing MTC Cr values over time. Those differences appeared just after year 1 and were most pronounced between the L and the H and HA quartiles, as shown by the post-hoc Bonferroni test: L vs H, p = 0.001, and L vs HA, p = 0.003.
Figure 3.
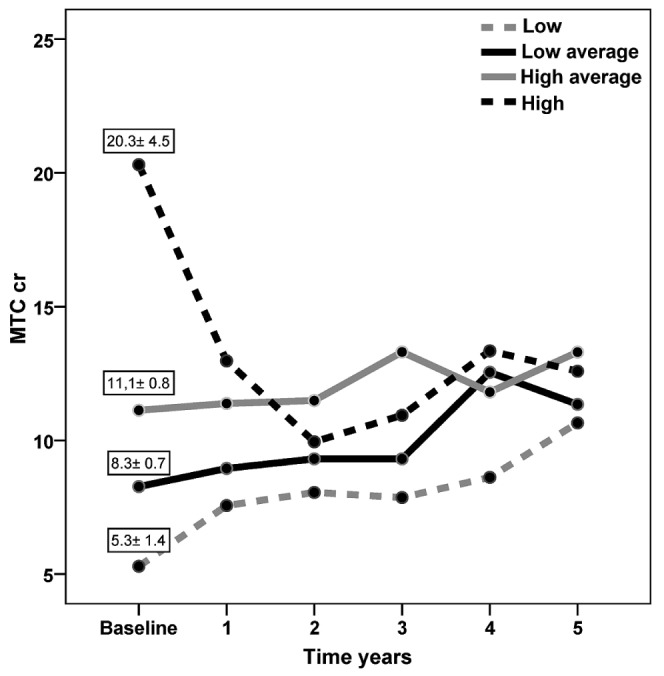
— Mass transfer coefficient of creatinine (MTCcr) during 5 years on peritoneal dialysis, by MTCcr quartile at baseline. Patients in the faster transport quartiles (high, high-average) tended to show a diminishing MTCcr; patients in the slowest transport quartile (low) tended to show an increasing MTCcr.
To confirm those findings, we performed a mixed-model analysis to study factors influencing MTC Cr outcome. Taking baseline MTC Cr as a co-variable and time as the main factor, the model confirms that baseline MTC Cr values are associated with significantly different behavior only up to the end of the first year on PD (p = 0.011).
EFFECT OF PERITONITIS
During the study, 113 patients remained free from peritonitis, and 162 patients experienced 1 or more peritonitis episodes (195 episodes in total). Figure 4(A) shows how the appearance of peritonitis during year 1 was significantly associated with a neutralization of the decline in MTC Cr shown in patients free from peritonitis during that period. However, in later annual periods, this inverse phenomenon was not repeated [Figure 4(B)]. Mixed-model and repeated measures analysis of the MTC Cr outcome confirmed the effect of early peritonitis, with minimal effects after year 4.
Figure 4.
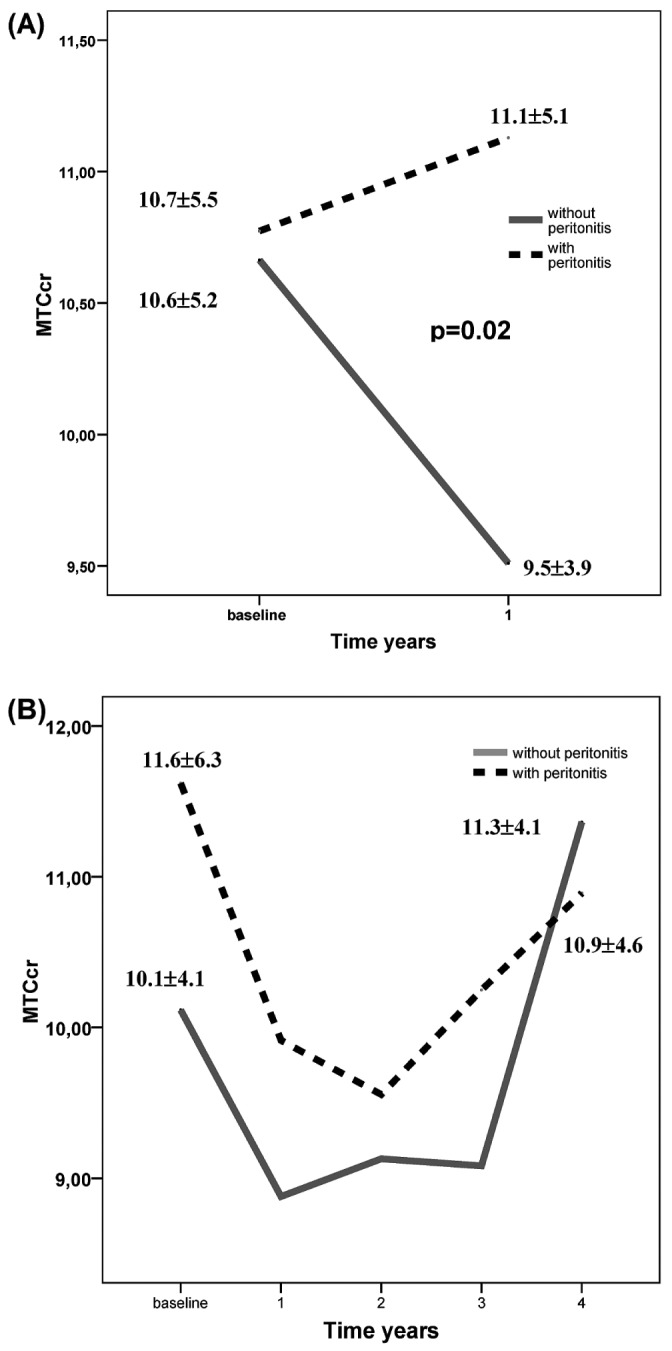
— (A) Evolution of the mass transfer coefficient of creatinine (MTCcr) during year 1 for patients with (n = 185) and without (n = 89) peritonitis. (B) Evolution of the MTCcr was not significantly different over a period of 4 years in patients with (n = 48) and without (n = 20) peritonitis.
To determine whether the initial peritoneal transport type would condition the effect of peritonitis on MTC Cr outcome, we included baseline MTC Cr as a co-variable. The analysis confirmed the significant influence of peritonitis on MTC Cr outcome early during PD (p < 0.023) regardless of the starting MTC Cr value. Accumulated days of peritoneal inflammation showed an influence only during the first 3 years (p = 0.005, p = 0.003, and p = 0.002 respectively).
EFFECT OF HGE
The percentages of patients with HGE during years 1, 2, 3, 4, and 5 were 37.7%, 31%, 43.9%, 47.5%, and 52.2% respectively. Patients with HGE during year 1 showed a higher baseline MTC Cr value (11.7 ± 5.6 mL/min vs 10.0 ± 5.1 mL/min, p = 0.012) and a lower baseline UF capacity (803.4 ± 292.8 mL vs 943.5 ± 369.8 mL, p < 0.001), but no differences in RRF, age, or diabetes status.
Figure 5 shows the results for patients who reached 5 years on PD, in which a strong and statistically significant MTC Cr increase is noted for those with HGE; no changes were observed for patients having low glucose exposure (LGE).
Figure 5.
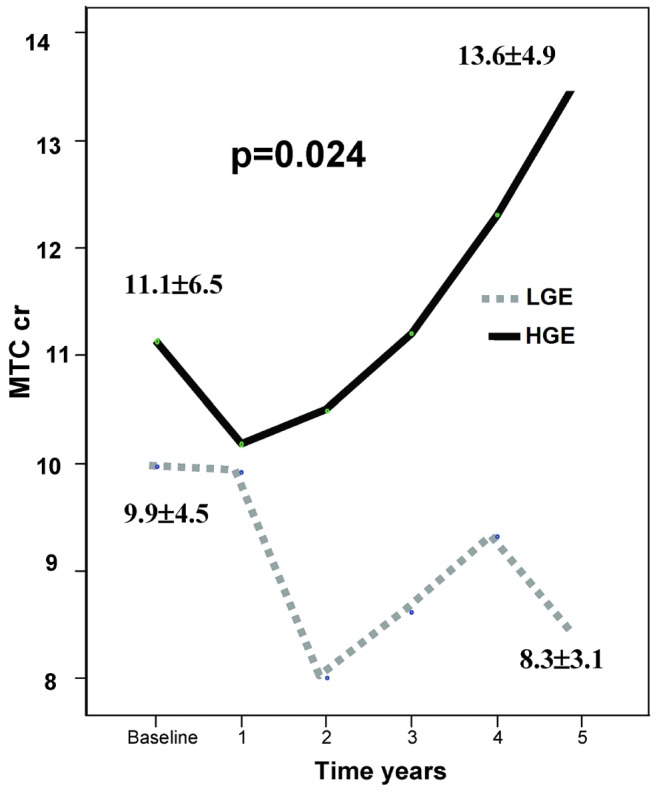
— In 12 patients with low glucose exposure (LGE), the mass transfer coefficient of creatinine (MTCcr) remained stable over time, but in 26 patients with high glucose exposure (HGE), the MTCcr showed an increase at some point in time. This difference was statistically significant (p = 0.024).
Some of the HGE may be dictated by the basal transport type and the loss of RRF that occurs over time on PD. To avoid those interferences and to isolate the role of glucose exposure with regard to peritoneal function, we explored the effect of glucose in only the intermediate quartiles (HA, LA) of MTC Cr. Because overuse of glucose is less conditioned by the initial type of peritoneal transport in those patients, the expectation is that H transporters would massively overuse, and that L transporters would rarely overuse. As Figure 6 shows, in a group of patients starting with similar values for peritoneal function, overuse of glucose led to a significant divergence in the MTC Cr outcome during year 1.
Figure 6.
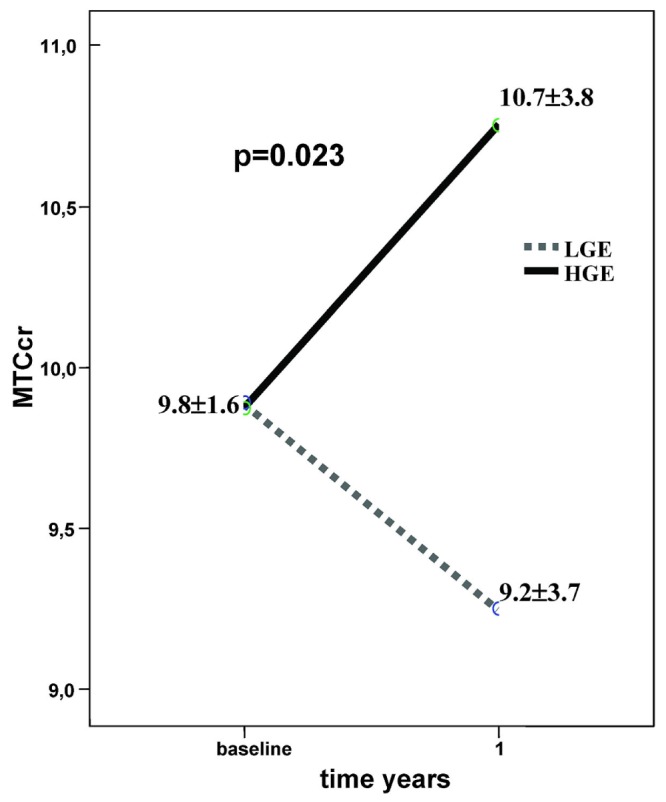
— Among patients in the intermediate transport quartiles (quartiles 2 and 3), those with high glucose exposure (HGE) in year 1 showed an increase in MTCcr. In those with low glucose exposure (LGE), the MTCcr diminished during year 1. This difference was statistically significant (p = 0.023).
With regard to RRF, we found no differences at baseline and at year 1 between patients with HGE and LGE (baseline: 3.9 ± 2.8 mL/min vs 4.1 ± 2.8 mL/min; year 1: 2.5 ± 2.2 mL/min vs 2.2 ± 1.8 mL/min respectively; all nonsignificant). At baseline, UF capacity was not different between those groups (924 ± 379 mL vs 824 ± 284 mL, nonsignificant). However, after the first year, patients with LGE have a higher UF than do patients with HGE (999 ± 313 mL vs 847 ± 290 mL, p < 0.01). No differences in days of active peritonitis during the first year were observed between the groups.
APD AND ICODEXTRIN USE
The analysis that follows is limited because, from the beginning of PD, only 21 and 14 patients started with icodextrin and APD respectively. In both groups, we found a nonsignificant trend toward a higher MTC Cr at baseline and a greater decline over year 1. The assessment of the influence of both factors was completed by mixed-model analysis, taking into account patients who started on icodextrin and APD over time. That analysis revealed that APD was not an influencing variable. By contrast, icodextrin use showed a statistically significant association with a lesser increase in MTC Cr over time, specifically when the baseline MTC Cr value was included in the model (p = 0.041, time-icodextrin-baseline MTC Cr). We then extended the analysis to explore changes in MTC Cr according to the use of icodextrin in the preceding year. Figure 7 presents the results of that mixed model, which shows that, in patients using icodextrin, MTC Cr was lower in the subsequent year, although it had been higher at baseline. The data are insufficient for analyses during later periods.
Figure 7.
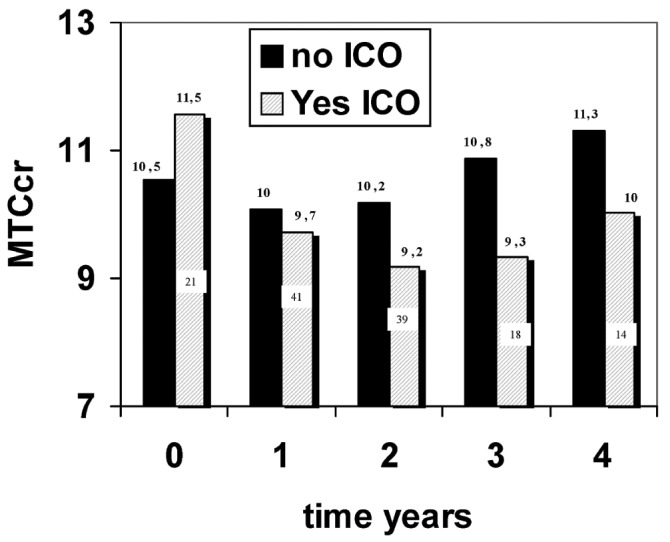
— The mixed model shows that, in patients using icodextrin (ICO), the mass transfer coefficient of creatinine (MTCcr) was lower in the subsequent year, although MTCcr values in those patients had been higher at baseline. During years 2 and 3, patients on ICO showed a significant decrease in MTCcr relative to baseline.
VINTAGE EFFECT
In the 1990s, we progressively introduced the use of APD (starting in 1995) and icodextrin (starting in 1998), and we changed the PD fluid used during peritoneal kinetic studies to 2.27% from 1.36% glucose. An analysis by vintage was therefore necessary. The MTC Cr and UF capacity outcomes in patients treated preferentially or totally during the 1980s and 1990s showed nonsignificant or non-clinically relevant differences.
DISCUSSION
In the present study, we tried to determine the influence of baseline peritoneal conditions on the development of FT status and, at the same time, to analyze how the other risk factors (the degree and timing of peritonitis and glucose exposure) modified that influence. With the present data, we confirm that initial FT and UF failure are reversible conditions that, under favorable conditions, tend to normalize over the first year on PD. As shown in Figure 3 and confirmed by the mixed-model analysis of peritoneal permeability, outcome at year 1 is not different for different transport values at baseline. That finding leads us to hypothesize that, with bioincompatible PD solutions, inherent and acquired FT are intrinsically and prognostically different. Attributing poorer survival and technique prognosis to transitory inherent FT seems to be inconsistent (14,21,22). Similarly, we suggest that the MTC Cr at year 1 is the most predictive value in the patient’s history. For that reason, we emphasize the importance of analyzing the influence of peritonitis and HGE on peritoneal permeability during the first year.
We observed the influence of peritonitis from PD start: episodes occurring during year 1 invert the usual spontaneous trend of a reduction in solute transport. Cho et al. (23) proved that this behavior is associated with high levels of interleukin 6, transforming growth factor β, and vascular endothelial growth factor in peritoneal effluent. All those mediators cause peritoneal capillary vasodilation and FT, transitory and definitive. Episodes appearing over subsequent years also have an influence on peritoneal transport, leading to a switch to HD because of UF failure, as we previously described (24). Accumulated days of peritoneal inflammation and late peritonitis were the main causes of switches to HD and membrane failure in our population (data not shown), which might explain why we found no effect of peritonitis in the analysis from year 4 onwards. Somehow, patients that stay on PD beyond the fourth year are a selected population with a low incidence or influence of peritonitis.
Adverse effects from exposing the peritoneum to high glucose concentrations are abundantly observed with the use of bioincompatible PD fluids both in animal models (25,26) and in clinical studies (8,9). Animal models have shown the benefit of using fluids low in glucose degradation products (compared with conventional fluids) in terms of vasculopathy and fibrosis (27). We recognize that, in clinical studies, it is difficult to show the specific and separate effect of glucose content because of the generally unavoidable coincidence between high glucose use and peritoneal FT. To try to clarify that issue, we explored the influence of HGE on peritoneal transport only during year 1 in the group of patients with intermediate permeability. Choosing that group of patients and having ruled out differences in RRF, baseline UF, and peritonitis incidence, we were able to investigate the effects of glucose dose alone. In the selected group, a greater use of glucose was unquestionably associated with the maintenance of FT; patients who did not overuse glucose showed a decline in solute permeability. Davies, writing alone and with colleagues (8,9), showed similar results, confirming that early overuse of glucose transforms the membrane in terms of transport. In our series, icodextrin consistently protected the peritoneum, given that the use of icodextrin was associated with a delay in the increase of solute permeability. Use of icodextrin from the very beginning of PD has also been associated with a greater decline in solute transport during year 1 among patients with FT at baseline (28). Moreover, icodextrin has been reported to stop the increase in peritoneal solute permeability in prevalent anuric patients on APD (29).
The main strengths of the present study are the significant number of patients being followed in a single unit using a stable peritoneal function methodology. Also, as shown in Figure 1(A), peritoneal function across time was similar in all patients (MTC Cr decline during the first 2 years). Finally, as shown in Table 1, the demographic and peritoneal transport characteristics of the 403 initial patients, the 275 patients studied repeatedly, and the 38 patients who reached 5 years on PD were all similar. Both findings suggest that these two analyzed PD populations (275 and 38 respectively) are representative of the entire population, leading us to think that the analysis excludes biased drop-out or positive selection attributable to peritoneal membrane problems.
The main limitations of the present study are these:
The change made in the functional evaluation of the peritoneum. The MTC Cr was determined using 1.36% glucose until 1990 and 2.27% glucose thereafter—although we previously showed that 1.36% and 2.27% glucose produced similar results (data not shown).
The fact that, until 2004, no internationally accepted method to measure the UF rate was available (20). We had to use a clinically useful and reproducible 24-hour standard UF methodology that could, in fact, depend on factors other than pure peritoneal UF capacity— including RRF or an intake-driven need for volume removal. To rule out decisive influences on results, we analyzed the effect of 1980s and 1990s dialysis vintage on the transport parameter outcome, finding no significant differences.
In our population, membrane failure as the cause of technique failure was infrequent (occurring in only 16 patients). That circumstance might explain why some factors that usually show a negative influence with time (such as peritonitis and HGE) did not reach statistical significance in the Cox analysis for membrane failure.
CONCLUSIONS
Prognosis for the peritoneal membrane is independent of baseline transport characteristics. Fast transport and UF failure are reversible conditions when peritonitis and HGE are avoided during the early dialysis period. Year 1 is among the main determining factors of the membrane’s future, with the MTC Cr at 12 months being the best predictor of future peritoneal function. Icodextrin helps with glucose avoidance and is associated with peritoneal protection. We think that these data provide a historical framework within which to compare the natural history of the peritoneal membrane under bioincompatible and biocompatible solutions.
DISCLOSURES
Some of the authors belong to REDinREN, the Spanish Kidney Research Network supported by Instituto de Salud Carlos III, from Ministerio de Ciencia y Tecnología (RETICS 06/0016) and European FEDER Funds. RS received a grant from the same institute for peritoneal research programs (FIS 09/00641) and an Extramural Grant from Baxter Healthcare Corporation (Deerfield, IL, USA) that supported the present study. Instituto Reina Sofia de Investigación Nefrológica (IRSIN) from Fundación Renal Iñigo Alvarez de Toledo (FRIAT) gives support for research to this group.
Acknowledgments
We thank Dr. F. Alvarez-Ude for help in the writing of this manuscript.
REFERENCES
- 1. Maiorca R, Vonesh EF, Cavalli P, De Vecchi A, Giangrande A, La Greca G, et al. A multicenter, selection-adjusted comparison of patient and techniques survivals on CAPD and hemodialysis. Perit Dial Int 1991; 11:118–27 [PubMed] [Google Scholar]
- 2. Collins AJ, Hao W, Xia H, Ebben JP, Everson SE, Constantini EG, et al. Mortality risk of peritoneal dialysis and hemodialysis. Am J Kidney Dis 1999; 34:1065–74 [DOI] [PubMed] [Google Scholar]
- 3. Gokal R, Figueras M, Ollé A, Rovira J, Badia X. Outcomes in peritoneal dialysis and hemodialysis—a comparative assessment of survival and quality of life. Nephrol Dial Transplant 1999; 14(Suppl 6):24–30 [DOI] [PubMed] [Google Scholar]
- 4. Weinhandl ED, Foley RN, Gilbertson DT, Arneson TJ, Snyder JJ, Collins AJ. Propensity-matched mortality comparison of incident hemodialysis and peritoneal dialysis patients. J Am Soc Nephrol 2010; 21:499–506 [DOI] [PMC free article] [PubMed] [Google Scholar]
- 5. Selgas R, Fernandez-Reyes MJ, Bosque E, Bajo MA, Borrego F, Jimenez C, et al. Funtional longevity of human peritoneum—for how long is chronic peritoneal dialysis possible? Results of a prospective medium long-term study. Am J Kidney Dis 1994; 23:64–73 [DOI] [PubMed] [Google Scholar]
- 6. Struijk DG, Krediet RT, Koomen GC, Boeschoten EW, Hoek FJ, Arisz L. A prospective study of peritoneal transport in CAPD patients. Kidney Int 1994; 45:1739–44 [DOI] [PubMed] [Google Scholar]
- 7. Davies SJ, Bryan J, Phillips L, Russell GI. Longitudinal changes in peritoneal kinetics: the effects of peritoneal dialysis and peritonitis. Nephrol Dial Transplant 1996; 11:498–506 [PubMed] [Google Scholar]
- 8. Davies SJ, Phillips L, Naish PF, Russell GI. Peritoneal glucose exposure and changes in membrane solute transport with time on peritoneal dialysis. J Am Soc Nephrol 2001; 12:1046–51 [DOI] [PubMed] [Google Scholar]
- 9. Davies SJ. Longitudinal relationship between solute transport and ultrafiltration capacity in peritoneal dialysis patients. Kidney Int 2004; 66:2437–45 [DOI] [PubMed] [Google Scholar]
- 10. Parikova A, Smit W, Struijk DG, Krediet RT. Analysis of fluid transport pathways and their determinants in peritoneal dialysis patients with ultrafiltration failure. Kidney Int 2006; 70:1988–94 [DOI] [PubMed] [Google Scholar]
- 11. Del Peso G, Jiménez-Heffernan JA, Bajo MA, Aroeira LS, Aguilera A, Fernández-Perpén A, et al. Epithelial-to-mesenchymal transition of mesothelial cells is an early event during peritoneal dialysis and is associated with high peritoneal transport. Kidney Int Suppl 2008; (108):S26–33 [DOI] [PubMed] [Google Scholar]
- 12. Honda K, Hamada C, Nakayama M, Miyazaki M, Sherif AM, Harada T, et al. Peritoneal biopsy study group of the Japanese Society for Peritoneal Dialysis. Impact of uremia, diabetes, and peritoneal dialysis itself on the pathogenesis of peritoneal sclerosis: a quantitative study of peritoneal membrane morphology. Clin J Am Soc Nephrol 2008; 3:720–8 [DOI] [PMC free article] [PubMed] [Google Scholar]
- 13. Kim YL. Update on mechanisms of ultrafiltration failure. Perit Dial Int 2009; 29(Suppl 2):S123–7 [PubMed] [Google Scholar]
- 14. Selgas R, Bajo MA, Cirugeda A, del Peso G, Valdés J, Castro MJ, et al. Ultrafiltration and small solute transport at initiation of PD: questioning the paradigm of peritoneal function. Perit Dial Int 2005; 25:68–76 [PubMed] [Google Scholar]
- 15. Reyes MJ, Bajo MA, Hevía C, Del Peso G, Ros S, de Miguel AG, et al. Inherent high peritoneal transport and ultrafiltration deficiency: their mid-term clinical relevance. Nephrol Dial Transplant 2007; 22:218–23 [DOI] [PubMed] [Google Scholar]
- 16. Brimble KS, Walker M, Margetts PJ, Kundhal KK, Rabbat CG. Meta-analysis: peritoneal membrane transport, mortality, and technique failure in peritoneal dialysis. J Am Soc Nephrol 2006; 17:2591–8 [DOI] [PubMed] [Google Scholar]
- 17. del Peso G, Fernández-Reyes MJ, Hevia C, Bajo MA, Castro MJ, Cirugeda A, et al. Factors influencing peritoneal transport parameters during the first year on peritoneal dialysis: peritonitis is the main factor. Nephrol Dial Transplant 2005; 20:1201–6 [DOI] [PubMed] [Google Scholar]
- 18. Lo WK, Brendolan A, Prowant BF, Moore HL, Khanna R, Twardowski ZJ, et al. Changes in the peritoneal equilibration test in selected chronic peritoneal dialysis patients. J Am Soc Nephrol 1994; 4:1466–74 [DOI] [PubMed] [Google Scholar]
- 19. Chung SH, Heimbürger O, Lindholm B. Poor outcomes for fast transporters on PD: the rise and fall of clinical concern. Semin Dial 2008; 21:7–10 [DOI] [PubMed] [Google Scholar]
- 20. Mujais S, Nolph K, Gokal R, Blake P, Burkart J, Coles G, et al. Evaluation and management of ultrafiltration problems in peritoneal dialysis. International Society for Peritoneal Dialysis Ad Hoc Committee on Ultrafiltration Management in Peritoneal Dialysis. Perit Dial Int 2000; 20(Suppl 4):S5–21 [PubMed] [Google Scholar]
- 21. Johnson DW, Hawley CM, McDonald SP, Brown FG, Rosman JB, Wiggins KJ, et al. Superior survival of high transporters treated with automated versus continuous ambulatory peritoneal dialysis. Nephrol Dial Transplant 2010; 25:1973–9 [DOI] [PubMed] [Google Scholar]
- 22. Yang X, Fang W, Bargman JM, Oreopoulos DG. High peritoneal permeability is not associated with higher mortality or technique failure in patients on automated peritoneal dialysis. Perit Dial Int 2008; 28:82–92 [PubMed] [Google Scholar]
- 23. Cho JH, Hur IK, Kim CD, Park SH, Ryu HM, Yook JM, et al. Impact of systemic and local peritoneal inflammation on peritoneal solute transport rate in new peritoneal dialysis patients: a 1-year prospective study. Nephrol Dial Transplant 2010; 25:1964–73 [DOI] [PubMed] [Google Scholar]
- 24. Selgas R, Paiva A, Bajo MA, Cirugeda A, Aguilera A, Díaz C, et al. Consequences of peritonitis episodes appearing late during peritoneal dialysis (PD) in patients able to continue PD. Adv Perit Dial 1998; 14:168–72 [PubMed] [Google Scholar]
- 25. De Vriese AS, Flyvbjerg A, Mortier S, Tilton RG, Lameire NH. Inhibition of the interaction of AGE-RAGE prevents hyperglycemia-induced fibrosis of the peritoneal membrane. J Am Soc Nephrol 2003; 14:2109–18 [DOI] [PubMed] [Google Scholar]
- 26. Nakayama M, Kawaguchi Y, Yamada K, Hasegawa T, Takazoe K, Katoh N, et al. Immunohistochemical detection of advanced glycosylation end-products in the peritoneum and its possible pathophysiological role in CAPD. Kidney Int 1997; 51:182–6 [DOI] [PubMed] [Google Scholar]
- 27. Kim CD, Kwon HM, Park SH, Oh EJ, Kim MH, Choi SY, et al. Effect of low glucose degradation products peritoneal dialysis fluid on peritoneal fibrosis and vasculation in a chronic rats model. Ther Apher Dial 2007; 11:56–64 [DOI] [PubMed] [Google Scholar]
- 28. Fernández-Reyes MJ, Bajo MA, del Peso G, Olea T, Sánchez-Villanueva RL, González E, et al. Effect of using icodextrin as a starting therapy for peritoneal permeability [Spanish]. Nefrologia 2009; 29:130–5 [DOI] [PubMed] [Google Scholar]
- 29. Davies SJ, Brown EA, Frandsen NE, Rodrigues AS, Rodriguez-Carmona A, Vychytil A, et al. Longitudinal membrane function in functionally anuric patients treated with APD: data from EAPOS on the effects of glucose and icodextrin prescription. Kidney Int 2005; 67:1609–15 [DOI] [PubMed] [Google Scholar]


