

Abstract
Computational fluid dynamics (CFD) models are useful for predicting site-specific dosimetry of airborne materials in the respiratory tract and elucidating the importance of species differences in anatomy, physiology, and breathing patterns. We improved the imaging and model development methods to the point where CFD models for the rat, monkey, and human now encompass airways from the nose or mouth to the lung. A total of 1272, 2172, and 135 pulmonary airways representing 17±7, 19±9, or 9±2 airway generations were included in the rat, monkey and human models, respectively. A CFD/physiologically based pharmacokinetic model previously developed for acrolein was adapted for these anatomically correct extended airway models. Model parameters were obtained from the literature or measured directly. Airflow and acrolein uptake patterns were determined under steady-state inhalation conditions to provide direct comparisons with prior data and nasal-only simulations. Results confirmed that regional uptake was sensitive to airway geometry, airflow rates, acrolein concentrations, air:tissue partition coefficients, tissue thickness, and the maximum rate of metabolism. Nasal extraction efficiencies were predicted to be greatest in the rat, followed by the monkey, and then the human. For both nasal and oral breathing modes in humans, higher uptake rates were predicted for lower tracheobronchial tissues than either the rat or monkey. These extended airway models provide a unique foundation for comparing material transport and site-specific tissue uptake across a significantly greater range of conducting airways in the rat, monkey, and human than prior CFD models.
Key Words: CFD, PBPK, respiratory airflows, respiratory dosimetry, acrolein.
The respiratory system is an important interface between the body and the environment. As a result, it serves as a significant portal of entry or target site for environmental agents or as a route of administration for drug delivery. For decades, computational models have been developed to describe this interface and predict exposures to target tissues. Historically, such models utilized empirical, mass-transfer, or compartmental approaches based on measured, idealized, or assumed anatomic structures (Anderson et al., 2003; Anjilvel and Asgharian, 1995; Asgharian et al., 2001; Gloede et al., 2011; Hofman, 1990; Horsfield et al., 1971; ICRP, 1994; NCRP, 1997; Weibel, 1963; Yeh et al., 1979; Yeh and Schum, 1980). Generally, these approaches are computationally efficient, which facilitates the analysis of variabilities in model parameters. However, the lack of realistic airway anatomy, which varies significantly between airway regions and across species, limits the usefulness of these approaches for assessing site-specific dosimetry or the impact of heterogeneities in airway ventilation that may affect toxicity or drug delivery.
To address this shortcoming, three-dimensional (3D) computational fluid dynamic (CFD) models have been developed to more accurately capture the consequences of anatomic detail and the impact on inhaled material transport (Kabilan et al., 2007; Kitaoka et al., 1999; Kleinstreuer et al., 2008b; Lin et al., 2007; Longest and Holbrook, 2011; Ma and Lutchen, 2006; Martonen et al., 2005). One application of CFD modeling that has been particularly important in toxicology has been the use of nasal models for the rat, monkey, and human to assess the potential risks for exposure to highly reactive water-soluble gases and vapors such as formaldehyde, hydrogen sulfide, and acrolein (Garcia et al., 2009a; Hubal et al., 1996, 1997; Kepler et al., 1998; Kimbell, 2006; Kimbell and Subramaniam, 2001; Kimbell et al., 1993, 1997, 2001a,b; Moulin et al., 2002; Schroeter et al., 2006a,b, 2008). While such models have proven extremely useful for comparing results from animal toxicity studies with realistic human exposures when nasal tissues are sensitive targets, many volatile chemicals may not be fully absorbed by nasal tissues and will penetrate beyond the nose affecting lower airways. Furthermore, humans are not obligate nasal breathers and exposures to chemicals can occur via mouth breathing, leading to appreciable doses in lower respiratory airways. Although CFD models have been developed for these lower airways, they have not been integrated with the upper respiratory system nor have they been developed for laboratory animals used in toxicology (Balashazy et al., 2002, 2008; Darquenne and Prisk, 2008; Kleinstreuer et al., 2008a,b; Longest and Holbrook, 2011; Longest and Vinchurkar, 2007; Longest and Xi, 2007; Martonen and Gibby, 1982; Martonen and Schroeter, 2003a,b; Xi et al., 2008; Zhang et al., 2005). Thus, even for highly reactive gases, true risks to tissues lining conducting airways have yet to be fully characterized (Morris and Hubbs, 2009).
The major reasons for the lack of CFD models that encompass all airway regions have been the difficulty in obtaining high-resolution data on 3D geometries and limitations in computer hardware and software tools to handle the challenges associated with these more extensive models. As a result, CFD models for the nose have been used to inform lower dimensional models, such as physiologically based pharmacokinetic (PBPK) models, to provide more complete descriptions of the respiratory system of animals and humans for volatile chemicals that target the respiratory system (Andersen et al., 2000; Bush et al., 1998; Corley et al., 2009; Frederick et al., 1994, 1998, 2001; Gloede et al., 2011; Overton et al., 2001; Sweeney et al., 2004, 2009). Such models take advantage of the improved resolution in describing nasal airways, but like other simple modeling approaches, average uptake across regions thus, diluting the ability to evaluate site-specific uptake that could be important in identifying susceptible targets.
Fortunately, recent advances in medical imaging, image processing, and computational mesh development have paved the way for developing more extensive, anatomically correct airway models (Carson, forthcoming; Carson et al., 2010a,b; Corley et al., 2009; Dyedov et al., 2009; Garcia et al., 2009b; Jiao et al., 2009; Kabilan et al., 2007; Kuprat and Einstein, 2009; Lin et al., 2007; Minard et al., 2006; Tawhai et al., 2009; Timchalk et al., 2001b). In this study, we exploited these advances to develop comprehensive CFD models of the respiratory systems of the Sprague Dawley rat, Rhesus monkey, and human that extends from the external nares or mouth to the conducting airways of the lung. The anatomic detail for these models comes from high-resolution magnetic resonance (MR) and X-ray computed tomography (CT) imaging. For the first time, we can now directly compare site-specific airflows and, when coupled with chemical-specific boundary conditions, local tissue dosimetry in both the upper and lower respiratory systems of laboratory animals and humans.
As an initial example of the potential impact of these extended airway models, we adapted the nasal CFD/PBPK models developed by Schroeter et al. (2008) to evaluated acrolein uptake along all conducting airway walls of our rat, monkey, and human models. As with other reactive, water-soluble aldehydes, acrolein is a respiratory irritant that can produce pathologies in nasal tissues of rodents as well as toxicity to conducting airways at higher exposure concentrations (Cassee et al., 1996, 2008; Dorman et al., 2008; Lam et al., 1985; Leach et al., 1987). Acrolein is used as an intermediate in the production of acrylic acid and is also formed during the combustion of organic materials (Schroeter et al., 2008). Most human exposures, however, occurs through the smoking of tobacco products (Counts et al., 2005; DHHS, 2010). As a result, the ability to compare the site-specific dosimetry of acrolein following both oral and nasal breathing is critical for extrapolating between toxicity studies in obligate nasal breathers such as rats to realistic human exposures.
The approach of Schroeter et al. (2008) consisted of linking a two-compartment PBPK model to the surfaces of F344 rat and human nasal airway CFD models. One compartment represented the mucus and epithelial tissues lining the airway lumen, while the other represented subepithelial tissues with blood perfusion. The simulations of Schroeter et al. were conducted under steady-state airflow conditions for several concentrations of acrolein in each species and the results were benchmarked against experimental data on the nasal uptake of acrolein in rats (also conducted under steady-state inhalation conditions). While our interest is in a wider range of chemicals, three reasons made acrolein model of Schroeter et al. attractive as a test case for our extended airway models. First is the extensive benchmarking that Schroeter et al. performed with experimental nasal extraction data. Second, Schroeter et al. included a detailed correspondence analysis between predicted airway fluxes of acrolein and nasal lesions observed in rats following inhalation exposures. Lastly, nasal extraction of acrolein is not as extensive as other reactive chemicals, such as formaldehyde. Thus, species-specific anatomy and physiology can influence acrolein penetration in both nasal and lower conducting airway tissues.
The purpose of this paper is to provide the computational and experimental foundation for developing 3D/CFD extended airway models in laboratory animals and humans for any application where anatomic detail may be important. All models are therefore available upon request.
MATERIALS AND METHODS
MR and CT Imaging
Rat. The CFD model for an approximately 9–10-week-old, 300g male Sprague Dawley rat was based on MR imaging of the upper airways at ~125-µm resolution from the nose through the larynx as described previously (Minard et al., 2006; Timchalk et al., 2001b). Lower airway geometries from the trachea through bronchiolar airways were based on micro-CT (µCT) imaging of a lung cast to capture airways beyond the resolution achievable by MR or µCT imaging of live animals. Preparation of a rat for casting followed that of Phalen et al. (1973). To preserve airway branch angles, rigid casts were made from quick-setting, silicone-based epoxy mixed with Dow Corning 200, Fluid 200cs (Dow Corning, Midland, MI) oil (10:1 by weight) to reduce viscosity, rather than flexible silicone materials used previously. After degassing under vacuum, a calculated lung volume (~1.5ml) of the mixture was slowly injected into the lungs in situ. The cast was allowed to cure overnight, and the lung was then carefully dissected from the rat and submerged in over-the-counter bleach (undiluted) for 4–6h to remove the tissue. Finally, the casts were suspended by the trachea and allowed to dry and fully harden. The lung cast was imaged using a Skyscan 1176 µCT (Microphotonics, Inc., Allentown, PA) at 18-µm isotropic resolution.
Monkey. The CFD model for a 6-month-old, 1.3-kg male Rhesus monkey was based on CT imaging of the upper airways from the nose through the larynx and MR imaging of a silicone cast of the trachea and lung from the same animal. Immediately after sedation and euthanasia, the chest cavity was opened, the trachea clamped below the larynx, and the head and neck region separated for CT imaging using a General Electric HighSpeed FX/i system. Contiguous 1-mm slices were acquired in a bone algorithm to look at edge detail and reconstructed into a chest algorithm to look at soft tissue detail.
After removing the head and neck, the lungs were immediately inflation fixed via tracheal cannula for 4h at 30cm fluid pressure with 1% glutaraldehyde/1% paraformaldehyde in cacodylate buffer (adjusted to pH 7.4, 330 mOsm) to preserve normal topology. Lung volume was measured by fluid displacement after fixation, and lungs were stored in fixative at 4°C until casting. Before casting, the lung was removed from fixative and rinsed in phosphate-buffered saline. Airway casts were made using a modification of the negative-pressure injection technique of Perry et al. (2000). Briefly, Dow Corning 734 Flowable Sealant (Dow Corning) and Dow Corning 200 Fluid, 200cs (Dow Corning) were mixed in a heat-sealed bag until a homogenous, bubble-free mix was obtained. The lung was suspended by the tracheal cannula in a modified dessicator attached to a vacuum pump. The silicon mixture was pulled into the lungs by negative pressure (−100 mmHg) until silicone was first visualized at the pleural surface (~10–20min). The desiccator was then slowly brought back to atmospheric pressure. The cast was allowed to polymerize overnight, then excess tissue was removed by soaking in bleach, after which the cast was rinsed thoroughly in water and air-dried.
The resulting cast was prepared for MR imaging using methods described previously (Carson et al., 2010a; Einstein et al., 2008). Briefly, the silicone lung cast was submersed in 0.25% agar containing the contrast agent, Magnevist (1:500 v/v). Imaging was performed using a 2 Tesla (84.991 MHz) Varian Unity Plus MRI spectrometer. A total of 256 transverse image slices (391 µm thick), each depicting a square field of view 10cm on a side with an in-plane resolution of 391 µm, were acquired.
Human. The human CFD model was based on multi-slice CT imaging of the head and torso of a female (84 years of age) using a GE LightSpeed VCT at 623-µm isotropic resolution across a 31.9 × 31.9 × 46.1cm field of view, producing an image volume size of 512 × 512 × 739.
Approvals. The Institutional Animal Care and Use Committees of Pacific Northwest National laboratory (PNNL) and the University of California at Davis, and the Institutional Review Boards of the University of Washington and PNNL approved all animal and human volunteer works conducted under this study.
Construction of the CFD Models From Imaging Data
Lung cast and airway tissue imaging data were segmented as described by Carson et al. (2010a). Briefly, background normalization and edge-preserving hybrid median filters were used to remove both low- and high-frequency noise, respectively. Air- or agar-lung cast boundaries were identified using intensity thresholds followed by manual validation. The lung cast topology was semiautomatically evaluated and repaired when necessary to ensure no loops of overlapping lung airways caused by close proximity of smaller airways that were not resolvable by the imaging system remained. Upper airways and human lung segmentations did not require prefiltering and relied on intensity thresholding followed by visual validation and repair as described previously (Corley et al., 2009; Minard et al., 2006). To better mimic physiological breathing conditions and the influence of the external nares or mouth on the entry of air into the respiratory tract, a cylinder capturing the contours of the face of each species was added to the segmentation extending several centimeters away from the face where the distal end of the cylinder was used to initiate airflows and chemical exposures.
Triangulated surfaces were extracted by applying a variant of the Marching Cubes algorithm (Lorensen and Cline, 1987) to segmented image dataset. After isosurface extraction, the centerline of the triangulated lung surface of each species was decomposed into a topologically correct skeleton that formed the basic data structure for all morphometric measurements, manipulations, and analyses. During grid generation, the skeleton was used to automatically truncate lung geometries and introduce boundary facets at a user-specified generation or airway diameter (Jiao et al., 2009, 2010). For the rat, a cutoff diameter was set at 180 µm, resulting in a geometry consisting of 1272 outlets, not including the trachea. For the monkey, the cutoff diameter was set to 650 µm, resulting in 2172 outlets, not including the trachea. For the lower resolution human data set, all 135 outlets, not including the trachea, were utilized. The truncated surfaces of the conducting airways of the lung were then joined with the similarly extracted surfaces for the upper respiratory tract for each species using the STL surface editor MAGICS (MAGICS is a registered trademark of Materialise, Plymouth, MI; www.materialise.com/Magics).
Once a final closed surface was produced, the triangulated mesh was adapted to the gradient-limited feature size, as described previously, to prepare the surface for scale-invariant meshing (Kuprat and Einstein, 2009). The goal of scale-invariant meshing is to assure that there are a minimum number of layers across each resolved feature to accurately resolve physical gradients regardless of scale and to thus equilibrate relative error over the entire mesh (Carson et al., 2010b; Kuprat and Einstein, 2009). Thus, points spaced relative to the gradient-limited feature size were projected into the interior of the mesh, filtered, and reconnected with a modified Delaunay approach to yield a minimum of 12 tetrahedral layers across the lumen (Kuprat and Einstein, 2009). Once connected, tetrahedral quality was further improved with a combination of edge flipping and variational smoothing. Lastly, the Voronoi dual of the mesh was produced with the polyDualMesh utility of the OpenFOAM library (OpenFOAM is an open source C++ computational continuum mechanics software and is a registered trademark of OpenCFD Ltd, Reading, United Kingdom; www.openfoam.com). The resulting polyhedral mesh effectively reduces the mesh size to as little as 20% of the number of elements in the original tetrahedral mesh, producing significantly faster convergence times for the same number of processors (Greenshields et al., 2010; Juretic and Gosman, 2010; Peric, 2004). An example of the tetrahedral and corresponding polyhedral meshes generated from this approach is shown in the Supplementary figure 1.
Defining Airway Surface Regions for Interfacing With PBPK Model for Vapor Uptake
To assign regionally specific vapor uptake parameters used in airway PBPK models, epithelial maps and anatomic regions were specified for each species based on published data. Specifically, each volume element and boundary facet was assigned to a nonoverlapping region to automatically assign boundary conditions for the PBPK model and to determine compartment statistics such as airway lumen surface areas and volumes associated with each compartment.
Airway compartments were created by intersecting geometric primitives (i.e., planes, spheres, and cylinders) with the respective airway geometry at locations dictated by epithelial cell type (nose) or anatomic region (remaining airways). Approximate nasal epithelial compartments for the rat, monkey, and human were based on published nasal epithelial cell maps (Carey et al., 2007; Schroeter et al., 2008). The remaining airways were compartmentalized according to distinct anatomic regions because detailed cellular maps are lacking. Thus, for each species, anatomic regions beyond the nose consisted of the nasopharynx, oropharynx (human only), larynx, trachea (to the first bifurcation), main bronchi, and secondary bronchi and bronchioles associated with each lobe (Fig. 1). After appropriate subdivision, template header files for tissue compartments and differential equations were automatically generated, as were initial vapor concentration files for implementation in CFD/PBPK simulations. These same subdivisions were used during postprocessing to determine compartment-by-compartment fluxes of acrolein based on the two-compartment PBPK model described below.
FIG. 1.


Surface maps of hybrid CFD/PBPK models for (a) the male Sprague Dawley rat, (b) male Rhesus monkey, and (c) female human showing specific regions of the respiratory airways categorized by epithelial cell type (nose) or anatomic region as indicated by the different surface colors. The cylinders in each model include the external facial features (nose or mouth) and are used to initialize inhalation atmospheric concentrations of acrolein. Shading is used to show the surface boundaries for each airway compartment (color coding for all figures can be viewed in the online version).
Boundary Conditions for Acrolein Uptake
Anatomy. With a few modifications, the two-compartment PBPK model developed by Schroeter et al. (2008) to describe the nasal uptake of acrolein in a male F344 rat and human was applied to the current male Sprague Dawley rat, male Rhesus monkey, and female human extended airway CFD models. This two-compartment model consisted of an inner (to the airway lumen) epithelium layer, which was combined with the mucus, as one compartment and an outer, subepithelial tissue compartment with associated blood flows. The depths of each rat and human nasal airway epithelial compartment were provided by Schroeter et al. (2008) and were used in this study. Similar data for the monkey were obtained from Carey et al. (2007). The surface areas for each nasal epithelial region were based on the actual compartments for the CFD models developed in this study and are similar to those reported by Schroeter et al. For the extended airway models, tissue thicknesses of each anatomic region outside the nose were obtained from the ICRP human lung model (ICRP, 1994) and are reported in Table 1; these tissue thicknesses were assumed to be the same for the monkey (Table 2).
TABLE 1.
Anatomic Parameters Used in the Human PBPK Models
| Dimension (tissue/region) | Compartment 1 (mucus + epithelium)a | Compartment 2 (subepithelium)b |
| Compartment surface area (cm2)c | ||
| Nose; squamous (vestibule) | 24.3 | 24.3 |
| Nose; respiratoryd | 160.6 | 160.6 |
| Nose; olfactory | 15.3 | 15.3 |
| Oral (+ pharynx) | 61.7 | 61.7 |
| Pharynx | 13.3 | 13.3 |
| Larynx | 50.6 | 50.6 |
| Trachea | 53.4 | 53.4 |
| Main bronchi | 33.3 | 33.3 |
| Secondary bronchi + bronchioles | 122.0 | 122.0 |
| Compartment thickness (cm) | ||
| Nose; squamous (vestibule)e | 0.0050 | 0.0015 |
| Nose; respiratoryd,e | 0.0070 | 0.0020 |
| Nose; olfactorye | 0.0070 | 0.0020 |
| Oral (+ pharynx) | 0.0065 | 0.0015 |
| Pharynxf | 0.0065 | 0.0015 |
| Larynxf | 0.0065 | 0.0015 |
| Tracheaf | 0.0066 | 0.0015 |
| Main bronchif | 0.0066 | 0.0015 |
| Secondary bronchi + bronchiolesf | 0.0066 | 0.0015 |
aCompartment 1 consists of both mucus and epithelium. The thickness of the mucus layer was 0.0020cm in all nasal compartments except the vestibule, which has no mucus coating; the thickness of the mucus layer was 0.0015cm in the oral, pharynx, and larynx and 0.0011cm in all other compartments.
bThe subepithelial compartment consists of connective tissue, capillaries, glands, macrophages, lymph vessels, etc. just below the epithelium as defined by ICRP (1994). This compartment receives the cardiac output in the model from Table 4.
cComputed from CFD model surface.
dRespiratory region in the CFD/PK model defined by Schroeter et al. (2008) also includes the transitional and lymphoepithelium.
eFrom Schroeter et al. (2008).
fICRP (1994).
TABLE 2.
Anatomic Parameters Used in the Monkey PBPK Models
| Dimension (tissue/region) | Compartment 1 (mucus + epithelium)a | Compartment 2 (subepithelium)b |
| Compartment surface area (cm2)c | ||
| Nose; squamous (vestibule) | 2.0 | 2.0 |
| Nose; respiratoryd | 15.7 | 15.7 |
| Nose; olfactory | 3.4 | 3.4 |
| Larynx | 1.7 | 1.7 |
| Trachea | 7.2 | 7.2 |
| Main bronchi | 4.0 | 4.0 |
| Secondary bronchi + bronchioles | 105.1 | 105.1 |
| Compartment thickness (cm) | ||
| Nose; squamous (vestibule)e | 0.0050 | 0.0015 |
| Nose; respiratoryd,e | 0.0070 | 0.0020 |
| Nose; olfactoryd | 0.0070 | 0.0020 |
| Larynx | 0.0065 | 0.0015 |
| Trachea | 0.0066 | 0.0015 |
| Main bronchi | 0.0066 | 0.0015 |
| Secondary bronchi + bronchioles | 0.0066 | 0.0015 |
aCompartment 1 consists of both mucus and epithelium. Except where otherwise noted, the thickness of the mucus and epithelial layer in each compartment was assumed to be the same as the human (see Table 1).
bThe subepithelial compartment consists of connective tissue, capillaries, glands, macrophages, lymph vessels, etc. just below the epithelium as defined by ICRP (1994). This compartment receives the cardiac output in the model from Table 4.
cComputed from CFD model surface.
dRespiratory region in the CFD/PK models for the rat and human defined by Schroeter et al. (2008) also includes the transitional and lymphoepithelium; this designation was maintained in the current monkey model.
eFrom Carey et al. (2007).
Similar epithelial and subepithelial thickness data in the lower respiratory tract were not available for the male Sprague Dawley rat. Therefore, six male Sprague Dawley rats (Harlan Laboratories, San Diego, CA), approximately 9–10 weeks of age and ~300±15-g body weight, were prepared for morphometric assessments. After deep anesthesia with sodium pentobarbital, each rat was killed by exsanguination, the trachea was cannulated as close to the larynx as possible, and the diaphragm punctured. The lungs were inflated in situ via the trachea cannula with fixative (1% glutaraldehyde/1% paraformaldehyde in cacodylate buffer, pH 7.4, 330 mOsm) at 30cm water pressure for 1h. The trachea was then ligated, the lungs dissected free of the chest cavity and stored at 4°C in excess fixative until trimming and processing according to Fanucchi et al. (2004). The trachea and main airway (right main bronchus) were each sectioned into nine blocks, embedded in glycol methacrylate (JB-4, Electron Microscopy Sciences, Hatfield, PA), and completely cut into 2-µ thick sections with three sections from every 50µ retained and stained with 0.25% Toluidine blue (Electron Microscopy Sciences, Hatfield, PA) for morphometric analysis (Fanucchi et al., 2004). The proportion of airway epithelial populations identified as ciliated, nonciliated, basal, or mucus cells will be reported separately. The surface areas and thicknesses of epithelial and subepithelial cell layers, which are utilized in the rat PBPK model, are presented in Table 3.
TABLE 3.
Anatomic Parameters Used in the Rat PBPK Models
| Dimension (tissue/region) | Compartment 1 (mucus + epithelium)a | Compartment 2 (subepithelium)b |
| Compartment surface area (cm2)c | ||
| Nose; squamous (vestibule) | 1.5 | 1.5 |
| Nose; respiratoryd | 11.1 | 11.1 |
| Nose; olfactory | 6.6 | 6.6 |
| Pharynx | 1.1 | 1.1 |
| Larynx | 0.5 | 0.5 |
| Trachea | 2.5 | 2.5 |
| Main bronchi | 3.3 | 3.3 |
| Secondary bronchi + bronchioles | 11.3 | 11.3 |
| Compartment thickness (cm) | ||
| Nose; squamous (vestibule)e | 0.0020 | 0.0015 |
| Nose; respiratoryd,e | 0.0040 | 0.0020 |
| Nose; olfactorye | 0.0070 | 0.0020 |
| Pharynxf | 0.0060 | 0.0015 |
| Larynxf | 0.0060 | 0.0015 |
| Tracheag | 0.0019 | 0.0020 |
| Main bronchig | 0.0016 | 0.0019 |
| Secondary bronchi + bronchiolesg | 0.0017 | 0.0015 |
aCompartment 1 consists of both mucus and epithelium. The thickness of the mucus layer was assumed to be 0.0010cm in all compartments except the vestibule, which has no mucus coating.
bThe subepithelial compartment consists of connective tissue, capillaries, glands, macrophages, lymph vessels, etc. just below the epithelium as defined by ICRP (1994). This compartment receives the cardiac output in the model from Table 4.
cComputed from CFD model surface.
dThe respiratory region in the CFD/PK model defined by Schroeter et al. (2008) also included the transitional and lymphoepithelium in the anterior and posterior regions of the nose.
eFrom Schroeter et al. (2008).
fAssumed mucus thickness same as nose; epithelium thickness same as human.
gMeasured in this study.
Physiology and biochemical data. Blood flows to subepithelial tissues of the nose and conducting airways of the extended respiratory models were taken from the literature (Brown et al., 1997; Schroeter et al., 2008; Timchalk et al., 2001a). Metabolism of acrolein was described by Schroeter et al. (2008) using a saturable pathway corresponding to aldehyde dehydrogenase enzymes and a first-order pathway for nonspecific reactions in both epithelial and subepithelial compartments. However, we modified the distribution of saturable metabolism between compartments and airway regions based on immunohistochemical localization of aldehyde and formaldehyde dehydrogenases (Bogdanffy et al., 1986; Keller et al., 1990). Thus, in the nasal respiratory and transitional epithelium, saturable metabolism was only associated with the mucus + epithelium layer, and not in the corresponding subepithelial layer, whereas in the nasal olfactory region, metabolism was only attributed to the subepithelial layer.
In addition, Schroeter et al. (2008) used a surface area scaling function to extrapolate metabolism rates from rats to humans. In the current model, metabolism was scaled by tissue volume and body weights due to the differences in tissue thicknesses for each compartment. Thus, the metabolism constants had to be recalibrated to fit experimental rat nasal absorption data (Morris, 1996; Struve et al., 2008) and scaled to the human as follows:
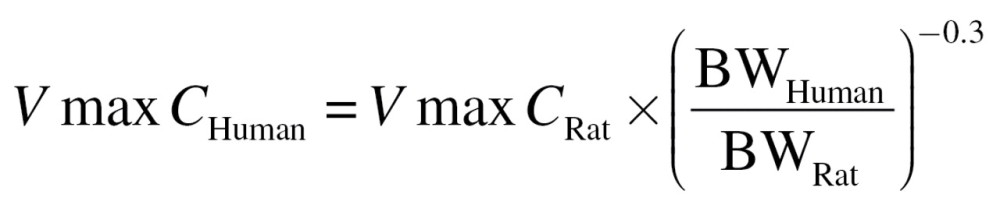 |
(1) |
where VmaxC is the scalable tissue volume-averaged maximum velocity for saturable metabolism (µg/l tissue/s) and BW is the body weight (kg). In this case, the volume refers to the volume of the mucus + epithelium compartment (or olfactory subepithelial compartment) for each discrete region described in the PBPK model (Tables 1–3). A similar equation was used to scale metabolism to the monkey, which was not included in the original study by Schroeter et al. (2008).
Saturable metabolism was also assumed to occur only in the mucus + epithelial compartments of the lower nonnasal airways, whereas nonspecific first-order reactions were assumed to occur in both compartments. However, a further adjustment was made to metabolic capacity of these lower airways according to the metabolic capacity of various aldehyde dehydrogenases in the nose, trachea, and bronchiolar region of the lung of the rat (Bogdanffy et al., 1986; Keller et al., 1990). Thus, the metabolic capacity (VmaxC) was arbitrarily reduced in the trachea and main bronchi to 25% of the capacity reported for the nose and by 50% in the bronchiolar region corresponding to observations of weak or moderate activity levels, respectively, for all three species. Since there were no data available describing the distribution of aldehyde dehydrogenases in the pharynx, larynx, or human oral cavity, VmaxC was not adjusted in these tissues. The impact of these assumed adjustments in VmaxC was evaluated as part of the sensitivity analyses described below. Physiological and biochemical parameters for the PBPK models for rats, monkeys, and humans are summarized in Table 4.
TABLE 4.
Physiological and Biochemical Parameters Used in the Rat, Monkey, and Human CFD/PBPK Models
| Parameter | Rat | Monkey | Human | Source |
| Body weight (kg) | 0.315 | 1.3 | 72.0 | Rat and human from Schroeter et al. (2008); monkey from this study |
| Total ventilation (ml/min) | 434 | 907 | 13,800 | Twice the minute volume according to Schroeter et al. (2008) |
| Cardiac output (CO; ml/min) | 106 | 303 | 5921 | Brown et al. (1997) |
| Blood flow to nasal subepitheliuma | ||||
| %CO | 1 | 1 | 1 | Schroeter et al. (2008) |
| ml/cm3/s | 0.445 | 1.225 | 2.542 | |
| Blood flow to pharynx, larynx, trachea, bronchi, and bronchiole subepithelium | ||||
| %CO | 3.8 | 3.8 | 3.8 | Timchalk et al. (2001a); Brown et al. (1997) |
| ml/cm3/sec | 1.903 | 1.038 | 7.921 | |
| Acrolein-specific parameters | ||||
| Air diffusivity (cm2/s) | 0.105 | 0.105 | 0.105 | Schroeter et al. (2008) |
| Water diffusivity (cm2/s) | 1.22 × 10⁻⁵ | 1.22 × 10⁻⁵ | 1.22 × 10⁻⁵ | Schroeter et al. (2008) |
| Water:air partition coefficient | 88 | 88 | 88 | Schroeter et al. (2008) |
| K f (sec−1) | 0.05 | 0.02b | 0.02 | Schroeter et al. (2008) |
| K m (µg/l) | 0.5 | 0.5 | 0.5 | Schroeter et al. (2008) |
| VmaxC (µg/l/s)c | 573 | 375 | 112 | Recalculated in this study |
a Normalized blood flows used by Schroeter et al. (2008) to the volume of each regional subepithelial compartment (calculated from Tables 1–3) to account for different thickness along the airways beyond the nose.
b First-order metabolism in the monkey assumed to be equal to human.
c Normalized the saturable metabolism pathway Vmax from Schroeter et al. (2008) to the volume of each regional mucus+epithelium tissue compartment (calculated from Tables 1–3) to account for different thicknesses along the airways beyond the nose and re-scaled from the rat according to body weight and relative tissue volumes (see text). The resulting VmaxC, which is a tissue volume scalable Vmax, was recalibrated against the nasal extraction data of Morris (1996) and Struve et al. (2008) and was adjusted by a factor of 0.25 or 0.5 for airways beyond the nose (or mouth) corresponding to observations summarized by Franks (2005) of weak (pharynx, larynx, trachea, and main bronchi) or moderate (bronchioles) aldehyde dehydrogenase activities, respectively (see text).
Airflow Simulations
The combined CFD/PBPK model for the nasal uptake of acrolein was established by Schroeter et al. (2008) for steady-state airflow and continuous acrolein inhalation exposure conditions. For the CFD simulations, Schroeter et al. used twice the minute volume for each species to derive the flux rates of acrolein across the airway walls at the approximate peak of the inhalation cycle as a conservative surrogate for tissue dose. As discussed below, these same conditions were utilized in the current extended airway model.
CFD airflow simulations were performed using OpenFOAM. The airflow predictions were based on the laminar, 3D, incompressible Navier–Stokes equations for fluid mass and momentum:
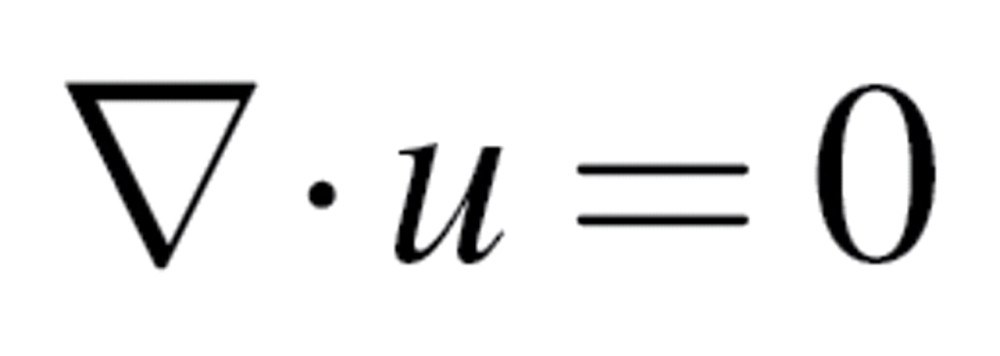 |
(2) |
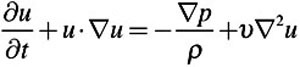 |
(3) |
where  is the density,
  is the kinematic viscosity, u is the fluid velocity vector, and p is the pressure.
For all CFD simulations, air at room temperature was considered to be the working fluid, with a density of 1.0kg/m3 and a kinematic viscosity of 1.502 × 10⁻⁵ m2/s. No attempts were made to adjust the properties of inhaled air as it enters the respiratory tract and is warmed and humidified. The inlets were prescribed a “constant flow rate” boundary condition in which the CFD code adjusts the magnitude of the inlet velocity to match the user-specified volumetric flow rate. The outlets were assigned a zero pressure, and a no-slip condition was applied to the remaining airway boundaries, which were assumed to be rigid and impermeable. Airflow was assumed to be laminar on the basis of computed Reynolds numbers at steady state. This assumption was tested using the k-omega with shear stress transport, low Reynolds number turbulent solver.
To facilitate direct comparisons of acrolein uptake between the nasal models of Schroeter et al. (2008) and the current, expanded airway models, the same steady-state flow rates at twice the minute volume was used for each species. For the rat, this corresponded to 0.434 l/min. For both the human nasal and human oral models, 13.8 l/min was specified as the flow rate. To calculate the flow rate for the monkey, the following allometric equation (Guyton, 1947) was used to compute the minute volume (MV):
| (4) |
where MV is in ml/min and BW is the body weight in grams. The weight of the imaged monkey was 1.3kg. Twice the minute volume, which is 907ml/min, was used as the flow rate for the steady-state simulation.
To verify that the solutions were independent of the mesh, the mesh densities were doubled for all the geometries. Otherwise, the same boundary conditions and solution parameters were applied. The simulations were considered “converged” if the residuals of velocity components and pressure fell below 1 × 10⁻⁵ (all units in OpenFOAM are in m-kg-s).
Acrolein Transport and Uptake Simulations
The convection–diffusion scalar transport equation
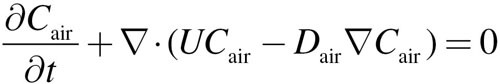 |
(5) |
was solved using the OpenFOAM solver, scalarTransportFoam, where Cair is the concentration of acrolein in the lumen, U is the fluid velocity, and Dair is the diffusion coefficient. The solver utilized the velocity field derived from the CFD simulation (i.e., the CFD simulations were decoupled from the convection–diffusion and PBPK simulations based on the assumption that acrolein has no effect on airflows). The numerical methodology used to solve the scalar transport equation in scalarTransportFoam consisted of discretization by the finite volume technique combined with an implicit integration algorithm. For all acrolein simulations, the diffusivity of acrolein in air was considered to be 1.05 × 10⁻⁵ m2/s. The acrolein concentration at the inlet and the surface of the cylinder attached to the face (see Fig. 1) ranged from 0.6 to 9.1 ppm to correspond with simulations conducted by Schroeter et al. (2008) and nasal extraction studies by Morris (1996) and Struve et al. (2008). The outlets were assigned a zero gradient for acrolein concentration.
The following one-dimensional equations were solved for mucus + epithelium layer (designated by the subscript “t” for tissue), and the corresponding subepithelial layer (designated by the subscript “b” for blood-perfusion layer) at every triangular facet on the airway walls that are covered by a mucus layer in the 3D convection–diffusion model:
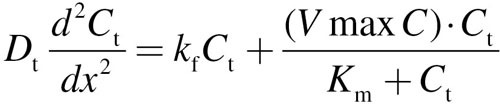 |
(6) |
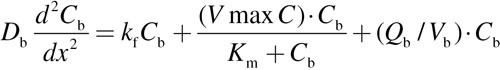 |
(7) |
For each equation, D is the diffusion coefficient, C is the acrolein concentration, x is the distance from lumen, k f is the nonspecific first-order metabolism rate constant, VmaxC represents saturable metabolism, Vmax, per unit volume of tissue, K m is the Michaelis constant, Q b is blood flow in the subepithelial layer, and V b is total volume of the subepithelial layer. The depth of each tissue compartment is L t, whereas the depth of each subepithelial compartment is L b.
At x = 0 (air–tissue interface), Equation 6 is coupled to the lumen convection–diffusion equation by matching diffusive flux by
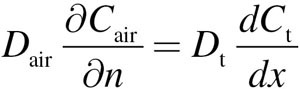 |
(8) |
where n is the surface normal direction in the 3D domain. The tissue concentration, Ct, is related to the air concentration via the air–tissue partition coefficient (i.e., 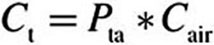 ). At
). At 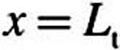 (epithelial–subepithelial interface), subepithelial concentration is related to the epithelial concentration via the tissue–blood partition coefficient (i.e.,
 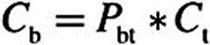 ), assuming
  . At
. At 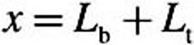 (deepest portion of subepithelial compartment), we incorporated a zero-flux (zero-Neumann) boundary condition (i.e.,
 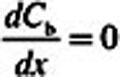 ) rather than the zero-concentration (Cb = 0 or zero-Dirichlet) boundary condition used by Schroeter et al. (2008). Although making this change did not impact the acrolein simulations (very little acrolein penetrated deep into the subepithelium), we made the assumption that the entire fraction of cardiac output to each tissue region perfused the subepithelial layer and not tissues deeper than our current two-compartment PBPK model. Thus, adopting the zero-flux boundary condition limits the clearance of acrolein from subepithelial tissues to blood perfusion (entering the subepithelium at zero concentration), metabolism (olfactory subepithelium only), and binding to macromolecules.
At every 3D convection–diffusion equation time step, an iterative root finder (zbrent [Press et al., 1992]) is called that finds the diffusive flux 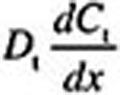 at x = 0 that is consistent with Equations 6 and 7, the
  value at x = 0, and the zero Neumann condition at
 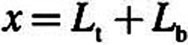 . Here Equations 6 and 7 were discretized by finite difference using 100 equally spaced intervals in each domain. This flux then determines the normal gradient of the concentration field in the CFD domain (i.e.,
 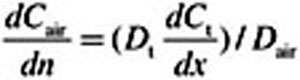 ), which is required by the convection–diffusion equation in the 3D domain.
The only region not covered by mucus is the nasal vestibule, consisting of squamous epithelium. For this region of the nose, Schroeter et al. (2008) derived a mass transfer coefficient of Ks = 7.1 × 10⁻⁴ cm/s for uptake (i.e., no tissue compartments, metabolism, nonspecific reactions, or blood flows are described for the non–mucus-coated squamous epithelium). This value was used unchanged for the nasal vestibule for all three species in the current models.
The simulations were run until the 3D convection–diffusion equation (with 1D two-compartment PBPK model coupled to each surface facet) reached steady state. Clearance from the air phase was therefore governed by air- and tissue-phase diffusion coefficients, the tissue:air partition coefficient, first-order nonspecific reactions, saturable metabolism, regional blood perfusion rates, regional tissue thickness, and the zero-Neumann boundary condition used in the PBPK model. Tecplot 360 (Tecplot, Bellevue, WA; www.tecplot.com) and Paraview (www.paraview.org) were used to analyze airflow characteristics and acrolein transport and uptake.
RESULTS
Hybrid CFD/PBPK Model Statistics
The four CFD models developed under this study ranged in size from 524,287 elements (human oral) to 2,876,905 elements (monkey) (Table 5). For the rat and monkey, the numbers of generations captured by each airway outlet were normally distributed and ranged from 5 to 33 generations. Utilization of lung casts significantly improved the numbers of airways that could be included in the animal models versus the numbers of airways that can be resolved from CT scans of human volunteers. Thus, the airways in the human lung model ranged from 6 to 12 generations.
TABLE 5.
CFD/PBPK Model Statistics
| Statistic | Rat | Monkey | Human (nasal breathing) | Human (oral breathing) |
| Total elements | 1,856,765 | 2,876,905 | 1,060,784 | 524,287 |
| Hexahedral | 12,429 | 3559 | 3360 | 1054 |
| Prism | 288 | 11 | 21 | 7 |
| Polyhedrala | 1,844,048 | 2,873,335 | 1,057,403 | 523,226 |
| Nodes | 10,480,448 | 16,468,373 | 6,147,249 | 2,969,494 |
| Surface facets | 632,304 | 966,585 | 238,535 | 156,562 |
| Total number of outlets | 1272 | 2172 | 135 | 135 |
| Generations (range) | 6–28 | 5–33 | 6–12 | 6–12 |
| Generations (mean ± sd)b | 17±7 | 19±9 | 9±2 | 9±2 |
| CFD | ||||
| Reynolds number (Re)c | ||||
| URT (or oral cavity) | 136 | 142 | 790 | 550 |
| Larynx | 279 | 490 | 2281 (3495) | 2416 (3526) |
| LRT | 64 | 74 | 404 | 386 |
| Acrolein PBPK | ||||
| Extraction (%) | ||||
| Nose | 69.5 | 54.74 | 24.04 | — |
| Whole model | 98.5 | 95.8 | 45.2 | 34.8 |
Note. URT, upper respiratory tract; LRT, lower respiratory tract.aThe polyhedral elements averaged 13 sides, which included a variety of face geometries.
bThe incidences in numbers of airways by generation were normally distributed as shown in Supplementary figure 2a.
cCalculated from representative cross-sectional slices in each region according to 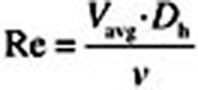 , where Vavg is the average simulated velocity, D
h is the hydraulic diameter of the representative cross sections (see Figs. 2–4), and v is the kinematic viscosity of air under steady-state inhalation at twice the resting minute volume for each species. Reynolds numbers calculated using the proscribed total volumetric flow for the human larynx where secondary recirculating currents are predicted (Fig. 4) are shown in parentheses.
, where Vavg is the average simulated velocity, D
h is the hydraulic diameter of the representative cross sections (see Figs. 2–4), and v is the kinematic viscosity of air under steady-state inhalation at twice the resting minute volume for each species. Reynolds numbers calculated using the proscribed total volumetric flow for the human larynx where secondary recirculating currents are predicted (Fig. 4) are shown in parentheses.
Simulation times for the CFD airflow models to converge under steady-state inhalation conditions ranged from under a minute to over a day depending on the model and the number of processors utilized (generally 48–144 2.8 Ghz Intel Westmere-based processors were used for each simulation). The use of scale-invariant meshing where every airway, no matter how small, has a minimum number of elements across ensured that flow profiles could be adequately captured and resolved in the model. Thus, increasing the mesh density by a factor of two had little impact on model convergence, establishment of flow profiles, or acrolein uptake. Mass-balance losses of airflows were all insignificant (i.e., all <1.17 × 10⁻⁵%).
Simulations of acrolein airway convection and diffusion with PBPK model-based tissue uptake and metabolism took longer to reach steady-state (7–48h using 144 processors). This is not surprising given the number of surface facets (Table 5), each with its own PBPK model boundary condition that required solving. Nevertheless, it was possible to utilize the hybrid CFD/PBPK model itself to recalibrate the VmaxC for saturable metabolism according to tissue volume rather than iterating between stand-alone PBPK models and CFD models as Schroeter et al. (2008) was forced to do because of prior computing challenges. Mass-balance calculations in all airway and tissue compartments verified that losses of acrolein were insignificant (< 0.2%) except for the monkey, which was slightly higher (4.56%) due to four nonorthogonal face elements that were not readily repaired. Given the small error and lack of data in the monkey to verify extraction efficiencies, no corrections were made to these results. Nonetheless, mesh refinement remains an ongoing effort.
Comparisons of CFD Airflows
Inlet angles can affect the airstreams entering different regions of the nose or mouth. Thus, the current models incorporated the external nares or mouth to allow the inhaled air to pass over these external features and into the conducting airways. A cylinder attached to the face of each model was used to initialize airflows and acrolein exposures. Although this is a rigid, “as-imaged” representation of external features, it does provide an initial unbiased source for airflow entry. Once airstreams pass the larynx, however, the impact of airway inlet vectors is significantly diminished.
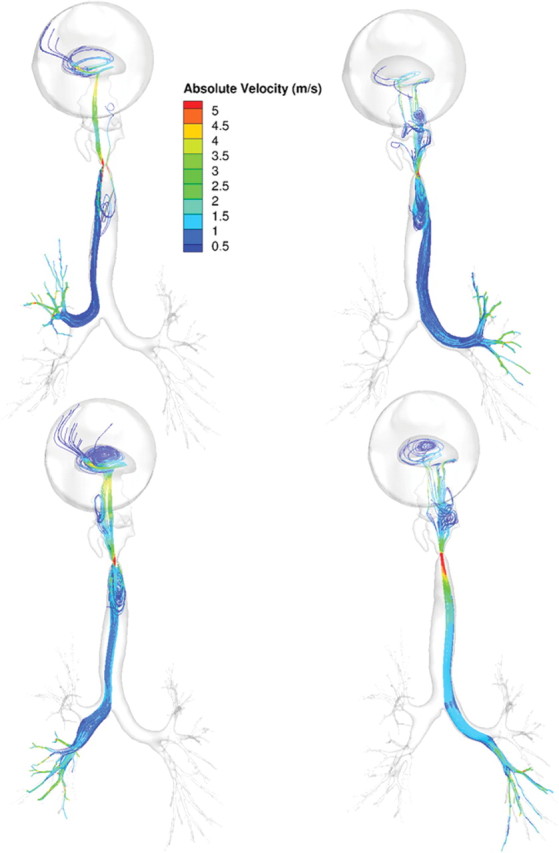
Maximum airflow rates achieved under steady-state conditions were 5.2, 5.6, and 11.3 m/s for the rat, monkey, and human, respectively. As expected from these flow rates and hydrodynamic airway diameters, the Reynolds (Re) numbers for these simulations were largely consistent with laminar flow profiles (Table 5; Figs. 2–4). However, in the laryngeal region of the human models and to a lesser degree, the monkey, the Reynolds numbers increased and secondary currents were clearly observed (Figs. 3 and 4) before reestablishment of laminar flow profiles in the lower trachea and lung. Application of a turbulence model (k-omega with shear stress transport, low Reynolds number turbulent solver) had little impact on simulations. Thus, all results were reported using the laminar airflow model calculations.
When airflows in the lung were compared within a generation, the range in flows varied from factors of two or three to one or two orders of magnitude in all three species (see Supplementary fig. 2). Although part of the heterogeneity in airflows is due to anatomic differences within a generation, the laminar airflow profiles entering each lobe and the use of zero pressure boundary conditions at every airway outlet likely contributed as well. For example, in the rat and human oral models, the upper (cranial) lobes are largely ventilated from airstreams traveling along the outer wall of the trachea at rapidly diminishing velocities, whereas those ventilating the lower lobes (caudal) primarily come from airstreams traveling down the center of the trachea at higher velocities consistent with parabolic flow profiles (Figs. 5 and 6). Similar results were obtained with the monkey and human nasal simulations (not shown) and in prior CFD simulations of the sheep lung (Kabilan et al., 2007).
FIG. 2.

Regional airflow velocities (m/s) in the nose, larynx, and lung and corresponding acrolein flux rates (pg/cm2/s) of the rat CFD/PBPK model. Steady-state CFD simulations were conducted at twice the resting minute volume (434ml/min) and a constant inhalation concentration of 0.6 ppm acrolein in the cylinder. Solid black lines in the CFD airflow simulations indicate cross sections of the nose, mouth, larynx, and lung regions used to calculate the Reynolds numbers in Table 5.
FIG. 3.

Regional airflow velocities (m/s) in the nose, larynx, and lung and corresponding acrolein flux rates (pg/cm2/s) of the monkey CFD/PBPK model. Steady-state CFD simulations were conducted at twice the resting minute volume (907ml/min) and a constant inhalation concentration of 0.6 ppm acrolein in the cylinder. Solid black lines in the CFD simulations indicate cross sections of the nose, mouth, larynx, and lung regions used to calculate the Reynolds numbers in Table 5.
Acrolein Uptake and Tissue Distribution
Nasal extraction efficiencies were 69.5, 54.7, and 24.0% in the rat, monkey and human nasal models, respectively, for steady-state inhalation of 0.6 ppm acrolein exposures at twice the resting minute volume. These are similar to Schroeter’s CFD/PBPK predicted uptake of ~62% in the rat and ~28% in the human under the same exposure conditions. The differences between the current model and the prior model of Schroeter et al. (2008) consist of the following: (1) different sources for airway geometries; (2) use of tissue volume-averaged VmaxC associated with only one PBPK compartment in the current model (see methods); and (3) the current VmaxC was calibrated against the Struve et al. (2008) and Morris (1996) data using the same steady-state flow rate as the experiment (300ml/min). Results from this recalibration against the experimental data of Struve et al. (2008) and Morris (1996) are shown in Figure 7. No changes were made in the first-order rate constants for nonspecific reactions with tissue macromolecules and, as in the Schroeter et al. (2008) model, were applied uniformly in all compartments and airways. In the end, the PBPK model parameters for the extended airway models were either identical to that of Schroeter et al. or recalibrated (VmaxC only) to facilitate scaling to the additional species (monkey), extended airways, and compartmentalization of metabolic enzymes.
FIG. 7.

Comparison of nasal extraction predictions from the CFD/PBPK model with time-averaged experimental data in rats from Struve et al. (2008) and Morris (1996). Simulations and experiments were conducted at 300ml/min steady-state inhalation.
FIG. 4.


Regional airflow velocities (m/s) in the nose, mouth, larynx, and lung and corresponding acrolein flux rates (pg/cm2/s) of the (a) human nasal and (b) human oral breathing CFD/PBPK models. Steady-state CFD simulations were conducted at twice the resting minute volume (13.8 l/min) and a constant inhalation concentration of 0.6 ppm acrolein in the cylinder. Solid black lines in the CFD simulations indicate cross sections of the nose, mouth, larynx, and lung regions used to calculate the Reynolds numbers in Table 5.
FIG. 5.

Ventral views of airflow streamlines (shaded by absolute velocities, m/s) showing different upper respiratory tract origins for lobar ventilation in the rat under steady-state inhalation conditions at twice the resting minute volume (434 ml/min). Airflows were visualized by seeding streamlines across the bronchi ventilating the right upper, right caudal, accessory, and left lobes (left to right).
FIG. 6.
Ventral views of airflow streamlines (shaded by absolute velocities, m/s) showing different upper respiratory tract origins for lobar ventilation in the human (oral breathing) under steady-state inhalation conditions at twice the resting minute volume (13.8 l/min). Airflows were visualized by seeding streamlines across the bronchi ventilating each of the lobes.
For the complete airway models, extraction efficiencies were 98.5, 95.8, 45.2, and 34.8% in the rat, monkey, human nasal, and human oral simulations, respectively. Human models were limited by the resolution of current CT scanners and contain on average, 10 fewer generations of airways than either the rat or monkey model (Table 5). This limitation, coupled with the lower tissue volume-averaged VmaxC for saturable metabolism in the conducting human airways, resulted in a significantly lower uptake of acrolein from the airways in both human models as they are currently structured.
Flux rates and uptake patterns of acrolein in the noses of the rat and human models were very similar to those reported by Schroeter et al. (2008) (Figs. 2 and 4a). Maximum acrolein flux rates within any region of the airway surfaces (all associated with the anterior nasal airways) were approximately 1400, 1080, and 660 pg/cm2/s for the rat, monkey, and human nasal simulations, respectively. All figures were scaled to 800 pg/cm2/s to facilitate comparisons across species and with prior figures of Schroeter et al. For the human oral simulation, the maximum flux rate was approximately 540 pg/cm2/s in the oral cavity due to the lower surface area to volume ratio than the nose. As a result, higher flux rates were also seen along conducting airways in the larynx, trachea, and lung than observed from nasal breathing. Because the metabolism of acrolein was restricted to the subepithelial compartment in the olfactory epithelium, the flux rates in this region are slightly lower than those produced by Schroeter et al. (2008) who distributed metabolism across both epithelial and subepithelial tissue layers.
Given the predominately laminar airflow profiles, hot spots for acrolein uptake beyond the nose were associated with areas of changing airflow directions and velocities as well as in the bronchiolar region where increases in metabolism increases uptake of any acrolein remaining in airway lumens. Furthermore, the heterogeneities observed in pulmonary airflows affected the distribution of site-specific flux rates, although these flux rates were low in comparison with those observed in upper airways. For other materials, the ability of anatomically correct models to capture the inherent heterogeneity in anatomy and physiology could be important, especially as transient simulations, airway and tissue mechanics, and the impact of disease are incorporated in future modeling efforts.
Sensitivity Analysis
Schroeter et al. (2008) conducted a sensitivity analysis of key model parameters on nasal extraction efficiencies and average fluxes in the nasal olfactory regions in their rat and human nasal CFD/PBPK models. Their analysis indicated that acrolein flux rates were insensitive to changes in the first-order rate constant (K f), Michaelis–Menten parameter (K m), nasal blood flow, and squamous mass transfer coefficient and mildly sensitive to the maximal metabolic rate (Vmax), air:tissue partition coefficient, and total tissue depth. Since our models, with minor modifications, are extensions of their nasal models, we supplemented their analysis by focusing on the minute volume and the arbitrary VmaxC adjustment factors used to scale metabolism in airways beyond the nose.
The impact of changes to the steady-state respiratory minute volumes was most apparent in the lower airways. For example, in the human nasal breathing model, peak concentrations of acrolein in epithelial tissues lining nasal airways through the trachea exposed to 0.6 ppm acrolein at twice the minute volume were generally only 14–28% higher than simulations conducted at the normal minute volume (see Supplementary fig. 3). However, once the airways of the lung were reached, peak concentrations were as much as 258% higher at twice the minute volume than at the normal minute volume. These results are consistent with nasal extraction studies with acrolein in rats that have shown increasing flow rates and decreased nasal extraction efficiencies (Morris, 1996), leaving higher airway concentrations that would be available for absorption in deeper respiratory tissues.
Because Schroeter et al. (2008) demonstrated that acrolein uptake simulations in human nasal tissues were insensitive to K m but mildly sensitive to Vmax, we extended their analysis by first reducing our scalable Vmax (VmaxC) in the oral, oropharynx, and laryngeal tissues to match the Vmax in the trachea (i.e., from 100 to 25% of the value used in the nose). We then performed simulations with sequential 50% increases in VmaxC in the trachea and bronchiolar regions in the human oral inhalation model. These simulations were conducted at 0.6 ppm acrolein using twice the minute volume at steady-state inhalation. Reducing the metabolism in the oral compartment had the greatest impact on regional extraction efficiencies. In this case, a 75% change in VmaxC resulted in a 36% reduction in extraction efficiencies in this region with only minor increases in uptake in lower airways (Fig. 8). Further modifications to VmaxC (50% increases) in the trachea through bronchiolar regions had very minimal effect in regional uptake efficiencies. However, site-specific flux rates, especially at bifurcations, increased significantly as VmaxC was increased distally at the same time it was lowered in the oral cavity (Fig. 8). Thus, although overall regional extraction efficiencies were mildly to moderately sensitive to VmaxC, site-specific flux rates were highly sensitive to changes in this parameter.
FIG. 8.

Impact of changes to VmaxC in nonnasal tissues in the human oral breathing model. Case 1 represents the original model where VmaxC is constant in nasal through laryngeal tissues but reduced to 25 or 50% in the trachea and main bronchi or bronchiolar region, respectively. Case 2 represents a reduction of VmaxC to 25% of the nasal values in the oral, oropharyngeal, and laryngeal tissues. Case 3 extends case 2 by increasing VmaxC in the trachea and main bronchi by 50%, whereas case 4 increases VmaxC in the bronchioles by 50%. Regional uptake efficiencies are shown in the upper graph, whereas surface flux rates are shown for each case study (bottom). Note that the scale used for surface flux rates was compressed to highlight site-specific differences in uptake. Peak fluxes and locations were 712 pg/cm2/s in case 1 (oral larynx), 506 pg/cm2/s in case 2 and 3 (lung bifurcations), and 610 pg/cm2/s in case 4 (lung bifurcations).
DISCUSSION
Multiscale computational modeling is gaining a strong foothold in mainstream biology with the rapid advancements in medical imaging and improved computational environments (Bassingthwaighte, 2000, 2008; Bassingthwaighte et al., 2009; Crampin et al., 2004; Fernandez et al., 2004; Hunter et al., 2005; Smith et al., 2007; Tawhai et al., 2009). In toxicology, this transformation has been most apparent in the respiratory system where species differences in anatomy, physiology, and cellular functions have played critical roles in extrapolating human health risks from animal bioassay data. This current study takes advantage of the advancements in imaging and computation to develop 3D/CFD airway models that extend from the external nares or mouth to the bronchiolar region of the lung in the rat, monkey, and human. Prior to this study, most CFD models of the respiratory system were limited to discrete regions such as the nose, larynx, or tracheobronchial region, whereas others were based on idealized, rather than realistic, geometries. To our knowledge, extended airway CFD models have not been published for laboratory animals commonly used in toxicology studies. For humans, models have recently been developed that extend from the mouth to the tracheobronchial region of the lung based on CT imaging (Lin et al., 2007; Longest and Xi, 2008). However, nasal airways were not included in these human models to provide comparisons between oral and nasal breathing. Thus, this study represents the first suite of anatomically correct extended airway CFD models that allows for direct comparisons across species and breathing patterns.
Current MR and CT imaging methods are suitable for capturing airway geometries that extend from the upper respiratory tract to the tracheobronchial region of the lung. For the rat and monkey, these in vivo imaging-based geometries were supplemented by imaging lung casts from either the same animal (monkey) or an age-matched animal (rat) to extend the coverage of pulmonary airways to as many as 28 (rat) or 33 generations (monkey). Although great care was taken to minimize the pressure for filling the lungs with casting material, it must be recognized that some degree of distortion of airway shape was impossible to avoid, especially in the deeper pulmonary airways that have little structural tissue support. Thus, airway geometries are assumed to be closer to total lung capacity than functional residual capacity. As part of our 3D model development, we also developed automated methods for generating tables of airway geometry from lung cast imaging data that can be used to evaluate airway variability or refine existing lower dimensional models (Einstein et al., 2008; Neradilak et al., forthcoming). Geometry data from our growing lung cast imaging data are available on request.
Since the human model was based solely on CT imaging of a female volunteer, the number of airway generations in the lung was limited by the resolution of the CT scanner. This same limitation is present in all previous imaging-based tracheobronchial models for humans (Bauer et al., 2010; Lin et al., 2007; Longest and Xi, 2008). Although human lung cast data exist (Raabe et al., 1976), only idealized geometries (i.e., cylinders) for each airway have been extracted and utilized to extend human airway models rather than actual airway geometries. Thus, the human CFD airflow models described herein were restricted to the resolution of the CT scans with no further adjustment, whereas we work to obtain and image lung casts to replace idealized with realistic airway geometries in the future. Alternative approaches, such as applying space-filling or recursive bifurcations (Tawhai et al., 2000) or coupling one-dimensional airflow models as boundary conditions for each airway outlet (Kabilan, 2011; Kuprat et al., forthcoming), to extend 3D human airway models to the gas exchange region is also an area of ongoing research.
The value of 3D/CFD models that respect species differences in anatomy and physiology becomes apparent when they are coupled with models that describe material transport in airways, tissue uptake, and clearance processes. In the acrolein CFD/PBPK example, the nose is clearly the primary target in the rat, with the greatest flux rates predicted in the anterior respiratory and transitional epithelium near the major airflow streams. However, as shown in Figure 7, nasal extraction efficiencies measured by Morris (1996) and Struve et al. (2008) in rats decrease with increasing concentrations; thus, tissues in lower airways can receive proportionately greater localized doses of acrolein. Similar trends are predicted for the monkey and human. Changing the airflow rates has a similar impact with greater uptake in nasal tissues occurring under lower flow rates consistent with the data of Struve et al. (2008), Morris (1996), and the analysis of Schroeter et al. (2008).
Although the anterior respiratory and transitional epithelium in the rat nose receives the highest localized flux rates, the olfactory epithelium is also sensitive as lesions occur in this region in the rat. Our preliminary analysis of tissue concentrations using transient breathing profiles supports this hypothesis. In these transient simulations, clearance rates are much slower in olfactory epithelium due to the lack of aldehyde dehydrogenase activity. This leads to a local buildup of acrolein concentrations over several breaths. Schroeter et al. (2008) concluded that olfactory lesions were the critical effect due to the enhanced sensitivity of this tissue and used tissue flux predictions to replace the default procedures in calculating an inhalation Reference Concentration (RfC). Because our focus was to demonstrate that lower airways can reach potentially significant tissue doses depending on the breathing mode, ventilation rate, and air concentration, we did not attempt to rederive an RfC based on nasal uptake.
Although we achieved significant coverage of conducting airways in the lungs of our rat and monkey CFD/PBPK models, our human models were limited by the resolution of the images to an average of nine generations. Although we are currently working to extend the coverage of human airways in our anatomically correct models, a mechanistic model of vapor transport and uptake in the human lung that extends from the trachea to the alveolar region was recently developed (Asgharian et al., 2012). In their model, Asgharian et al. predicted that peak extraction efficiencies for acrolein are reached by generation eight with a small penetration into alveolar spaces at a normal tidal volume. However, under exercise conditions (e.g., 53.3 l/min ventilation) Asgharian et al. predicted that peak flux rates would shift from generation 8–18, resulting in significantly greater extraction in alveolar spaces. Although there are several differences in model structure and assumptions, our results are comparable to those of Asgharian et al., at least at the regional levels that are covered by both models.
As pointed out by others (Martonen and Schroeter, 2003a,b), simulating target tissue doses in the respiratory system without addressing correct anatomic and physiological features, especially when they can be measured, can lead to erroneous conclusions at worst and uncertainties at best. Thus, the merging of 3D CFD models with PBPK models represents an important evolution in computational toxicology that respects these distinctions. By developing extended airway models specifically for the rat, monkey, and human, cross-species comparisons will rely less on extrapolation and more on what is known about species-specific respiratory biology. Furthermore, as progress is made in imaging, image processing, and computational modeling, multiple models covering age, gender, species, and preexisting disease states will become available.
Although this paper represents an important advancement over prior nasal-only CFD/PBPK models, several assumptions and compromises remain within the current modeling framework. These include the following: (1) the use of a simple two-compartment PBPK model, which combines mucus with the epithelium, thus ignoring mucus flow and changes due to disease or toxicity; (2) the limited data to map specific cell types with differing metabolic capacities in airways outside of the nose in each species; (3) the use of steady-state rather than transient inhalation conditions; (4) the use of nonphysiological boundary conditions for each airway outlet that ignores the heterogeneities in airway and tissue mechanics in the deeper or “unseen” lung (i.e., assuming zero pressure at each airway outlet); (5) the lack of PBPK or lower dimensional models coupled with each airway outlet to describe material transport and clearance in the deep lung beyond the existing airways; (6) the use of rigid airway models that ignore expansion and contraction, laryngeal opening and closing, the beating heart, body movement or posture; and (7) the use of human tissue thickness data as a surrogate for the monkey. Although these assumptions and compromises are justifiable, given the current state of the science, as well as being attributes of previous CFD models of discrete airway regions, they each represent areas of active research in many laboratories, including our own, and breakthroughs can be anticipated in the near future.
With the recent advances presented in this paper and by others, it should be emphasized that the time to develop extended airway CFD models that push the limits of airway resolution has been reduced from many months to at most a few weeks depending on the quality of the imaging data and the degree of airway compartmentalization that is incorporated. Thus, constructing models for multiple individuals across age, gender, species, or disease to address variability is an achievable goal. Furthermore, with improved meshing, computational software, and hardware performance, the 3D modeling is no longer the domain of laboratories with the most advanced supercomputers. In our case, the simulations presented in this manuscript were all performed using 48–144 nodes of a 168-node Linux cluster that costs below $100,000 in 2010. Thus, the development and application of these more extensive, anatomically correct respiratory models are now more affordable and achievable for a greater number of laboratories, making them a potentially valuable tool for situations where site specificity in internal dose predictions is important.
As discussed above, coupling of 3D with lower dimensional models that fully describe airflows and material transport in the complete respiratory system is an area of current emphasis in our laboratory. Regardless of material, it will become important to experimentally determine metabolism, tissue reactivity, or deposition in respiratory tissues at a significantly greater resolution than is typically performed today. Our ultimate goal is to produce multi-scale models of the complete respiratory system that allows users to define and automatically implement the level of 3D resolution that is required to answer specific questions yet decrease the resolution in where it is not needed to improve computational efficiencies. Thus, the models presented in this manuscript, and others like them, will serve as structural foundations for multi-scale models of the respiratory system and their interfaces with the body. With this foundation, models can more readily be developed for other inhaled materials that target the respiratory system.
SUPPLEMENTARY DATA
Supplementary data are available online at http://toxsci.oxfordjournals.org/.
FUNDING
All imaging, CFD model development, and comparative airflow simulations were supported by grants from the National Heart, Lung, and Blood Institute (NHLBI R01 HL073598) and the National Institute of Environmental Health Sciences (NIEHS P01 ES011617) of the National Institutes of Health. Acrolein-specific simulations were supported by R. J. Reynolds Tobacco Co. under a separate contract with Battelle (Project 56296), which involved only the coauthors Corley, Kabilan, Kuprat, and Timchalk. No author is employed by or receives personal remuneration from R.J.R., and all views expressed are those of the authors themselves and do not reflect views, policies, or control by any funding entity.
ACKNOWLEDGMENTS
The authors are grateful to Dr Jeff Schroeter, The Hamner Institutes for Health Sciences, Research Triangle Park, NC, for his assistance in re-deriving the PBPK model parameters for acrolein used in the extended respiratory airway models. A portion of the research was performed in the Environmental Molecular Sciences Laboratory (EMSL), a national scientific user facility sponsored by the Department of Energy’s Office of Biological and Environmental Research and the PNNL Institutional Computing (PIC) Facilities at the Pacific Northwest National Laboratory.
Footnotes
Disclaimer: The authors certify that all research involving human subjects was done under full compliance with all government policies and the Helsinki Declaration.
REFERENCES
- Andersen M., Sarangapani R., Gentry R., Clewell H., Covington T., Frederick C. B. (2000). Application of a hybrid CFD-PBPK nasal dosimetry model in an inhalation risk assessment: An example with acrylic acid. Toxicol. Sci. 57 312–325 [DOI] [PubMed] [Google Scholar]
- Anderson J. C., Babb A. L.,, Hlastala M. P. (2003). Modeling soluble gas exchange in the airways and alveoli. Ann. Biomed. Eng. 31 1402–1422 [DOI] [PubMed] [Google Scholar]
- Anjilvel S., Asgharian B. (1995). A multiple-path model of particle deposition in the rat lung. Fundam. Appl. Toxicol. 28 41–50 [DOI] [PubMed] [Google Scholar]
- Asgharian B., Hofman W.,, Bergmann R. (2001). Particle deposition in a multiple-path model of the human lung. Aerosol Sci. Technol. 34 332–339 [Google Scholar]
- Asgharian B., Price O. T., Schroeter J. D., Kimbell J. S.,, Singal M. (2012). A lung dosimetry model of vapor uptake and tissue disposition. Inhal. Toxicol. 24 182–193 [DOI] [PubMed] [Google Scholar]
- Balashazy I., Farkas A., Hofmann W.,, Kurunczi S. (2002). Local deposition distributions of inhaled radionuclides in the human tracheobronchial tree. Radiat. Prot. Dosimetry 99 469–470 [DOI] [PubMed] [Google Scholar]
- Balashazy I., Hofmann W., Farkas A.,, Madas B. G. (2008). Three-dimensional model for aerosol transport and deposition in expanding and contracting alveoli. Inhal. Toxicol. 20 611–621 [DOI] [PubMed] [Google Scholar]
- Bassingthwaighte J., Hunter P.,, Noble D. (2009). The cardiac physiome: Perspectives for the future. Exp. Physiol. 94 597–605 [DOI] [PMC free article] [PubMed] [Google Scholar]
- Bassingthwaighte J. B. (2000). Strategies for the physiome project. Ann. Biomed. Eng. 28 1043–1058 [DOI] [PMC free article] [PubMed] [Google Scholar]
- Bassingthwaighte J. B. (2008). Microcirculation and the physiome projects. Microcirculation 15 835–839 [DOI] [PMC free article] [PubMed] [Google Scholar]
- Bauer K., Chaves H.,, Brucker C. Visualizing flow partitioning in a model of the upper human lung airways. J. Biomech. Eng. (2010);132:031005. doi: 10.1115/1.4000871. [DOI] [PubMed] [Google Scholar]
- Bogdanffy M. S., Randall H. W.,, Morgan K. T. (1986). Histochemical localization of aldehyde dehydrogenase in the respiratory tract of the Fischer-344 rat. Toxicol. Appl. Pharmacol. 82 560–567 [DOI] [PubMed] [Google Scholar]
- Brown R. P., Delp M. D., Lindstedt S. L., Rhomberg L. R.,, Beliles R. P. (1997). Physiological parameter values for physiologically based pharmacokinetic models. Toxicol. Ind. Health 13 407–484 [DOI] [PubMed] [Google Scholar]
- Bush M. L., Frederick C. B., Kimbell J. S.,, Ultman J. S. (1998). A CFD-PBPK hybrid model for simulating gas and vapor uptake in the rat nose. Toxicol. Appl. Pharmacol. 150 133–145 [DOI] [PubMed] [Google Scholar]
- Carey S. A., Minard K. R., Trease L. L., Wagner J. G., Garcia G. J. M., Ballinger C. A., Kimbell J. S., Plopper C. G., Corley R. A., Postlethwait E. M.,, et al. (2007). Three-dimensional mapping of ozone-induced injury in the nasal airways of monkeys using magnetic resonance imaging and morphometric techniques. Toxicol. Pathol. 35 27–40 [DOI] [PubMed] [Google Scholar]
- Carson J. P., Einstein D. R., Minard K. R., Fanucchi M. V., Wallis C. D.,, Corley R. A. (2010a). High resolution lung airway cast segmentation with proper topology suitable for computational fluid dynamic simulations. Comput. Med. Imaging Graph 34 572–578 [DOI] [PMC free article] [PubMed] [Google Scholar]
- Carson J. P., Kuprat A. P.,, Jiao X., Dyedov V., Del Pin F., Guccione J. M., Ratcliffe M. B.,, Einstein D. R. (2010b). Adaptive generation of multimaterial grids from imaging data for biomedical Lagrangian fluid-structure simulations. Biomech. Model. Mechanobiol. 9 187–201 [DOI] [PMC free article] [PubMed] [Google Scholar]
- Cassee F. R., de Burbure C. Y., Rambali B., Vleeming W., van de Kuil A., van Steeg H., Fokkens P. H., van Amsterdam J. G., Dormans J. A.,, Opperhuizen A. (2008). Subchronic inhalation of mixtures of cigarette smoke constituents in Xpa-/-p53+/- knock-out mice: A comparison of intermittent with semi-continuous exposure to acetaldehyde, formaldehyde, and acrolein. Food Chem. Toxicol. 46 527–536 [DOI] [PubMed] [Google Scholar]
- Cassee F. R., Stenhuis W. H., Groten J. P.,, Feron V. J. (1996). Toxicity of formaldehyde and acrolein mixtures: In vitro studies using nasal epithelial cells. Exp. Toxicol. Pathol. 48 481–483 [DOI] [PubMed] [Google Scholar]
- Corley R. A., Minard K. R., Kabilan S., Einstein D. R., Kuprat A. P., Harkema J. R., Kimbell J. S., Gargas M. L.,, Kinzell J. H. (2009). Magnetic resonance imaging and computational fluid dynamics (CFD) simulations of rabbit nasal airflows for the development of hybrid CFD/PBPK models. Inhal. Toxicol. 21 512–518 [DOI] [PMC free article] [PubMed] [Google Scholar]
- Counts M. E., Morton M. J., Laffoon S. W., Cox R. H.,, Lipowicz P. J. (2005). Smoke composition and predicting relationships for international commercial cigarettes smoked with three machine-smoking conditions. Regul. Toxicol. Pharmacol. 41 185–227 [DOI] [PubMed] [Google Scholar]
- Crampin E. J., Halstead M., Hunter P., Nielsen P., Noble D., Smith N.,, Tawhai M. (2004). Computational physiology and the Physiome Project. Exp. Physiol. 89 1–26 [DOI] [PubMed] [Google Scholar]
- Darquenne C., Prisk G. K. (2008). Deposition of inhaled particles in the human lung is more peripheral in lunar than in normal gravity. Eur. J. Appl. Physiol. 103 687–695 [DOI] [PubMed] [Google Scholar]
- DHHS. How Tobacco Smoke Causes Disease: The Biology and Behavioral Basis for Smoking-Attributable Disease: A Report of the Surgeon General. U.S. Department of Health and Human Services, CDC, National Center for Chronic Disease Prevention and Health Promotion, Office on Smoking and Health; Atlanta, GA: (2010). [PubMed] [Google Scholar]
- Dorman D. C., Struve M. F., Wong B. A., Marshall M. W., Gross E. A.,, Willson G. A. (2008). Respiratory tract responses in male rats following subchronic acrolein inhalation. Inhal. Toxicol. 20 205–216 [DOI] [PubMed] [Google Scholar]
- Dyedov V., Einstein D. R., Jiao X., Kuprat A. P., Carson J. P.,, del Pin F. (2009). Variational generation of prismatic boundary-layer meshes for biomedical computing. Int. J. Numer. Methods Eng. 79 907–945 [DOI] [PMC free article] [PubMed] [Google Scholar]
- Einstein D. R., Neradilak B., Pollisar N., Minard K. R., Wallis C., Fanucchi M., Carson J. P., Kuprat A. P., Kabilan S., Jacob R. E.,, et al. (2008). An automated self-similarity analysis of the pulmonary tree of the Sprague-Dawley rat. Anat. Rec. 291 1628–1648 [DOI] [PMC free article] [PubMed] [Google Scholar]
- Fanucchi M. V., Day K. C., Clay C. C.,, Plopper C. G. (2004). Increased vulnerability of neonatal rats and mice to 1-nitronaphthalene-induced pulmonary injury. Toxicol. Appl. Pharmacol. 201 53–65 [DOI] [PubMed] [Google Scholar]
- Fernandez J. W., Mithraratne P., Thrupp S. F., Tawhai M. H.,, Hunter P. J. (2004). Anatomically based geometric modelling of the musculo-skeletal system and other organs. Biomech. Model. Mechanobiol. 2 139–155 [DOI] [PubMed] [Google Scholar]
- Franks S. J. (2005). A mathematical model for the absorption and metabolism of formaldehyde vapour by humans. Toxicol. Appl. Pharmacol. 206 309–320 [DOI] [PubMed] [Google Scholar]
- Frederick C. B., Bush M. L., Lomax L. G., Black K. A., Finch L., Kimbell J. S., Morgan K. T., Subramaniam R. P., Morris J. B.,, Ultman J. S. (1998). Application of a hybrid computational fluid dynamics and physiologically based inhalation model for interspecies dosimetry extrapolation of acidic vapors in the upper airways. Toxicol. Appl. Pharmacol. 152 211–231 [DOI] [PubMed] [Google Scholar]
- Frederick C. B., Gentry P. R., Bush M. L., Lomax L. G., Black K. A., Finch L., Kimbell J. S., Morgan K. T., Subramaniam R. P., Morris J. B.,, et al. (2001). A hybrid computational fluid dynamics and physiologically based pharmacokinetic model for comparison of predicted tissue concentrations of acrylic acid and other vapors in the rat and human nasal cavities following inhalation exposure. Inhal. Toxicol. 13 359–376 [DOI] [PubMed] [Google Scholar]
- Frederick C. B., Morris J. B., Kimbell J. S., Morgan K. T.,, Scherer P. W. (1994). Comparison of 4 biologically-based dosimetry models for the deposition of rapidly metabolized vapors in the rodent nasal cavity. Inhal. Toxicol. 6 135–157 [Google Scholar]
- Garcia G. J., Schroeter J. D., Segal R. A., Stanek J., Foureman G. L.,, Kimbell J. S. (2009a). Dosimetry of nasal uptake of water-soluble and reactive gases: A first study of interhuman variability. Inhal. Toxicol. 21 607–618 [DOI] [PubMed] [Google Scholar]
- Garcia G. J., Tewksbury E. W., Wong B. A.,, Kimbell J. S. (2009b). Interindividual variability in nasal filtration as a function of nasal cavity geometry. J. Aerosol Med. Pulm. Drug Deliv. 22 139–155 [DOI] [PubMed] [Google Scholar]
- Gloede E., Cichocki J. A., Baldino J. B.,, Morris J. B. (2011). A validated hybrid computational fluid dynamics-physiologically based pharmacokinetic model for respiratory tract vapor absorption in the human and rat and its application to inhalation dosimetry of diacetyl. Toxicol. Sci. 123 231–246 [DOI] [PubMed] [Google Scholar]
- Greenshields C. J., Weller H. G., Gasparini F.,, Reese J. M. (2010). Implementation of semi-discrete, non-staggered central schemes in a collated, polyhedral, finite volume framework for high-speed viscous flows. Int. J. Numer. Meth. Heat Fluid Flow 63 1–21 [Google Scholar]
- Guyton A. C. (1947). Measurement of the respiratory volumes of laboratory animals. Am. J. Physiol. 150–70–77 [DOI] [PubMed] [Google Scholar]
- Hofman W., Koblinger L. (1990). Monte Carlo modeling of aerosol deposition in human lungs. Part II: Deposition fractions and their sensitivity to parameter variations. J. Aerosol Sci. 21 675–688 [Google Scholar]
- Horsfield K., Dart G., Olson D. E., Filley G. F.,, Cumming G. (1971). Models of the human bronchial tree. J. Appl. Physiol. 31 207–217 [DOI] [PubMed] [Google Scholar]
- Hubal E. A., Schlosser P. M., Conolly R. B.,, Kimbell J. S. (1997). Comparison of inhaled formaldehyde dosimetry predictions with DNA-protein cross-link measurements in the rat nasal passages. Toxicol. Appl. Pharmacol. 143b 47–55 [DOI] [PubMed] [Google Scholar]
- Hubal E. A. C., Kimbell J. S.,, Fedkiw P. S. (1996). Incorporation of nasal-lining mass-transfer resistance into a CFD model for prediction of ozone dosimetry in the upper respiratory tract. Inhal. Toxicol. 8 831–857 [Google Scholar]
- Hunter P., Smith N., Fernandez J.,, Tawhai M. (2005). Integration from proteins to organs: The IUPS Physiome Project. Mech. Ageing Dev. 126 187–192 [DOI] [PubMed] [Google Scholar]
- ICRP. (1994). Human respiratory tract model for radiological protection. A report of a Task Group of the International Commission on Radiological Protection. Ann. ICRP 24 1–482 [PubMed] [Google Scholar]
- Jiao X., Einstein D. R.,, Dyedov V. (2010). Local orthogonal cutting method for computing medial curves and its biomedical applications. SIAM J. Sci. Comput. 32 947–969 [DOI] [PMC free article] [PubMed] [Google Scholar]
- Jiao X., Einstein D. R., Dyedov V.,, Carson J. P. (2009). Automatic identification and truncation of boundary outlets in complex imaging-derived biomedical geometries. Med. Biol. Eng. Comput. 47 989–999 [DOI] [PMC free article] [PubMed] [Google Scholar]
- Juretic F., Gosman A. D. (2010). Error analysis of the finite-volume method with respect to mesh type. Numer. Heat Tr. B-Fund. 57 414–439 [Google Scholar]
- Kabilan S. (2011). Multiscale modeling of the mammalian respiratory system,PhD Dissertation, University of Washington,Seattle, WA. [Google Scholar]
- Kabilan S., Lin C. L.,, Hoffman E. A. (2007). Characteristics of airflow in a CT-based ovine lung: A numerical study. J. Appl. Physiol. 102 1469–1482 [DOI] [PubMed] [Google Scholar]
- Keller D. A., Heck H. D., Randall H. W.,, Morgan K. T. (1990). Histochemical localization of formaldehyde dehydrogenase in the rat. Toxicol. Appl. Pharmacol. 106 311–326 [DOI] [PubMed] [Google Scholar]
- Kepler G. M., Richardson R. B., Morgan K. T.,, Kimbell J. S. (1998). Computer simulation of inspiratory nasal airflow and inhaled gas uptake in a rhesus monkey. Toxicol. Appl. Pharmacol. 150 1–11 [DOI] [PubMed] [Google Scholar]
- Kimbell J. S. (2006). Nasal dosimetry of inhaled gases and particles: Where do inhaled agents go in the nose? Toxicol. Pathol. 34 270–273 [DOI] [PubMed] [Google Scholar]
- Kimbell J. S., Gross E. A., Joyner D. R., Godo M. N.,, Morgan K. T. (1993). Application of computational fluid dynamics to regional dosimetry of inhaled chemicals in the upper respiratory tract of the rat. Toxicol. Appl. Pharmacol. 121 253–263 [DOI] [PubMed] [Google Scholar]
- Kimbell J. S., Gross E. A., Richardson R. B., Conolly R. B.,, Morgan K. T. (1997). Correlation of regional formaldehyde flux predictions with the distribution of formaldehyde-induced squamous metaplasia in F344 rat nasal passages. Mutat. Res. 380 143–154 [DOI] [PubMed] [Google Scholar]
- Kimbell J. S., Overton J. H., Subramaniam R. P., Schlosser P. M., Morgan K. T., Conolly R. B.,, Miller F. J. (2001a). Dosimetry modeling of inhaled formaldehyde: Binning nasal flux predictions for quantitative risk assessment. Toxicol. Sci. 64 111–121 [DOI] [PubMed] [Google Scholar]
- Kimbell J. S., Subramaniam R. P. (2001). Use of computational fluid dynamics models for dosimetry of inhaled gases in the nasal passages. Inhal. Toxicol. 13 325–334 [DOI] [PubMed] [Google Scholar]
- Kimbell J. S., Subramaniam R. P., Gross E. A., Schlosser P. M.,, Morgan K. T. (2001b). Dosimetry modeling of inhaled formaldehyde: Comparisons of local flux predictions in the rat, monkey, and human nasal passages. Toxicol. Sci. 64 100–110 [DOI] [PubMed] [Google Scholar]
- Kitaoka H., Takaki R.,, Suki B. (1999). A three-dimensional model of the human airway tree. J. Appl. Physiol. 87 2207–2217 [DOI] [PubMed] [Google Scholar]
- Kleinstreuer C., Zhang Z.,, Donohue J. F. (2008a). Targeted drug-aerosol delivery in the human respiratory system. Annu. Rev. Biomed. Eng. 10 195–220 [DOI] [PubMed] [Google Scholar]
- Kleinstreuer C., Zhang Z.,, Li Z. (2008b). Modeling airflow and particle transport/deposition in pulmonary airways. Respir. Physiol. Neurobiol. 163 128 ––138. [DOI] [PubMed] [Google Scholar]
- Kuprat A. P., Einstein D. R. (2009). An anisotropic scale-invariant unstructured mesh generator suitable for volumetric imaging data. J. Comput. Phys. 228 619–640 [DOI] [PMC free article] [PubMed] [Google Scholar]
- Kuprat A. P. Kabilan S. Carson J. P. Corley R. A., Einstein D. R.(forthcoming). A bidirectional coupling procedure for multiscale respiratory modeling. J. Comput. Phys. [DOI] [PMC free article] [PubMed] [Google Scholar]
- Lam C. W., Casanova M.,, Heck H. D. (1985). Depletion of nasal mucosal glutathione by acrolein and enhancement of formaldehyde-induced DNA-protein cross-linking by simultaneous exposure to acrolein. Arch. Toxicol. 58 67–71 [DOI] [PubMed] [Google Scholar]
- Leach C. L., Hatoum N. S., Ratajczak H. V.,, Gerhart J. M. (1987). The pathologic and immunologic effects of inhaled acrolein in rats. Toxicol. Lett. 39 189–198 [DOI] [PubMed] [Google Scholar]
- Lin C. L., Tawhai M. H., McLennan G.,, Hoffman E. A. (2007). Characteristics of the turbulent laryngeal jet and its effect on airflow in the human intra-thoracic airways. Respir. Physiol. Neurobiol. 157 295–309 [DOI] [PMC free article] [PubMed] [Google Scholar]
- Longest P. W., Holbrook L. T. In silico models of aerosol delivery to the respiratory tract - Development and applications. Adv. Drug Deliv. Rev. 64, 296–311. (2011) doi: 10.1016/j.addr.2011.05.009. [DOI] [PMC free article] [PubMed] [Google Scholar]
- Longest P. W., Vinchurkar S. (2007). Effects of mesh style and grid convergence on particle deposition in bifurcating airway models with comparisons to experimental data. Med. Eng. Phys. 29 350–366 [DOI] [PubMed] [Google Scholar]
- Longest P. W., Xi J. (2007). Computational investigation of particle inertia effects on sub-μm aerosol deposition in the respiratory tract. J. Aerosol Sci. Technol. 38 111–130 [Google Scholar]
- Longest P. W., Xi J. (2008). Condensational growth may contribute to the enhanced deposition of cigarette smoke particles in the upper respiratory tract. Aerosol Sci. Technol. 42 579–602 [Google Scholar]
- Lorensen W., Cline H. (1987). Marching cubes: A high resolution 3D surface construction algorithm. Comput. Graph 21 163–169 [Google Scholar]
- Ma B., Lutchen K. R. (2006). An anatomically based hybrid computational model of the human lung and its application to low frequency oscillatory mechanics. Ann. Biomed. Eng. 34 1691–1704 [DOI] [PubMed] [Google Scholar]
- Martonen T., Gibby D. (1982). Computer models of aerosol deposition in two human tracheobronchial geometries. Comput. Biomed. Res. 15 425–433 [DOI] [PubMed] [Google Scholar]
- Martonen T., Isaacs K.,, Hwang D. (2005). Three-dimensional simulations of airways within human lungs. Cell Biochem. Biophys. 42 223–249 [DOI] [PubMed] [Google Scholar]
- Martonen T. B., Schroeter J. D. (2003a). Risk assessment dosimetry model for inhaled particulate matter: I. Human subjects. Toxicol. Lett. 138 119–132 [DOI] [PubMed] [Google Scholar]
- Martonen T. B., Schroeter J. D. (2003b). Risk assessment dosimetry model for inhaled particulate matter: II. Laboratory surrogates (rat). Toxicol. Lett. 138 133–142 [DOI] [PubMed] [Google Scholar]
- Minard K. R., Einstein D. R., Jacob R. E., Kabilan S., Kuprat A. P., Timchalk C. A., Trease L. L.,, Corley R. A. (2006). Application of magnetic resonance (MR) imaging for the development and validation of computational fluid dynamic (CFD) models of the rat respiratory system. Inhal. Toxicol. 18 787–794 [DOI] [PubMed] [Google Scholar]
- Morris J. B. (1996). Uptake of acrolein in the upper respiratory tract of the F344 rat. Inhal. Toxicol. 8 387–403 [Google Scholar]
- Morris J. B., Hubbs A. F. (2009). Inhalation dosimetry of diacetyl and butyric acid, two components of butter flavoring vapors. Toxicol. Sci. 108 173–183 [DOI] [PMC free article] [PubMed] [Google Scholar]
- Moulin F. J. M., Brenneman K. A., Kimbell J. S.,, Dorman D. C. (2002). Predicted regional flux of hydrogen sulfide correlates with distribution of nasal olfactory lesions in rats. Toxicol. Sci. 66 7–15 [DOI] [PubMed] [Google Scholar]
- NCRP. Deposition, Retention and Dosimetry of Inhaled Radioactive Substances. National Council on Radiological Protection and Measurements,; Bethesda, MD.: (1997). [Google Scholar]
- Neradilak M., Pollisar N., Einstein D. R., Glenny R. W., Minard K. R., Carson J. P., Jiao X., Jacob R. E., Cox T. C., Postlethwait E.,, et al. (2012). Branch-based model for the diameters of the pulmonary airways: Accounting for departures from self-consistency and registration errors Anat. Rec. 295, 1027–1044. [DOI] [PMC free article] [PubMed] [Google Scholar]
- Overton J. H., Kimbell J. S.,, Miller F. J. (2001). Dosimetry modeling of inhaled formaldehyde: The human respiratory tract. Toxicol. Sci. 64 122–134 [DOI] [PubMed] [Google Scholar]
- Peric M. Flow simulation using control volumes of arbitrary polyhedral shape. ERCOFTAC Bull. 62, 25–29. (2004) [Google Scholar]
- Perry S. F., Purohit A. M., Boser S., Mitchell I.,, Green F. H. (2000). Bronchial casts of human lungs using negative pressure injection. Exp. Lung. Res. 26 27–39 [DOI] [PubMed] [Google Scholar]
- Phalen R. F., Yeh H. C., Raabe O. G.,, Velasquez D. J. (1973). Casting the lungs in-situ. Anat. Rec. 177 255–263 [DOI] [PubMed] [Google Scholar]
- Press W. H.,, Teukolsky S. A.,, Vetterling W. T.,, Flannery B. P. Cambridge University Press,; New York, NY.: (1992). Numerical recipes in C: The art of scientific computing, 2nd ed. [Google Scholar]
- Raabe O. G., Yeh H. C., Schum G. M.,, Phalen R. F. Tracheobronchial Geometry: Human, Dog, Rat, Hamster – A Compilation of Selected Data from the Project Respiratory Tract Deposition Models. Report LF-53. Inhalation Toxicology Research Institute, Lovelace Foundation for Medical Education and Research,; Albuquerque, NM.: (1976). [Google Scholar]
- Schroeter J. D., Kimbell J. S., Andersen M. E.,, Dorman D. C. (2006a). Use of a pharmacokinetic-driven computational fluid dynamics model to predict nasal extraction of hydrogen sulfide in rats and humans. Toxicol. Sci. 94 359–367 [DOI] [PubMed] [Google Scholar]
- Schroeter J. D., Kimbell J. S., Bonner A. M., Roberts K. C., Andersen M. E.,, Dorman D. C. (2006b). Incorporation of tissue reaction kinetics in a computational fluid dynamics model for nasal extraction of inhaled hydrogen sulfide in rats. Toxicol. Sci. 90 198–207 [DOI] [PubMed] [Google Scholar]
- Schroeter J. D., Kimbell J. S., Gross E. A., Willson G. A., Dorman D. C., Tan Y. M.,, Clewell H. J., III (2008). Application of physiological computational fluid dynamics models to predict interspecies nasal dosimetry of inhaled acrolein. Inhal. Toxicol. 20 227–243 [DOI] [PubMed] [Google Scholar]
- Smith N. P., Crampin E. J., Niederer S. A., Bassingthwaighte J. B.,, Beard D. A. (2007). Computational biology of cardiac myocytes: Proposed standards for the physiome. J. Exp. Biol. 210 1576–1583 [DOI] [PMC free article] [PubMed] [Google Scholar]
- Struve M. F., Wong V. A., Marshall M. W., Kimbell J. S., Schroeter J. D.,, Dorman D. C. (2008). Nasal uptake of inhaled acrolein in rats. Inhal. Toxicol. 20 217–225 [DOI] [PubMed] [Google Scholar]
- Sweeney L. M., Andersen M. E.,, Gargas M. L. (2004). Ethyl acrylate risk assessment with a hybrid computational fluid dynamics and physiologically based nasal dosimetry model. Toxicol. Sci. 79 394–403 [DOI] [PubMed] [Google Scholar]
- Sweeney L. M., Kirman C. R., Gannon S. A., Thrall K. D., Gargas M. L.,, Kinzell J. H. (2009). Development of a physiologically based pharmacokinetic (PBPK) model for methyl iodide in rats, rabbits, and humans. Inhal. Toxicol. 21 552–582 [DOI] [PubMed] [Google Scholar]
- Tawhai M., Bischoff J., Einstein D. R., Erdemir A., Guess T.,, Reinbolt J. (2009). Multiscale modeling in computational biomechanics: Determining computational priorities and addressing current challenges. Eng. Med. Biol. Mag. 28 41–49 [DOI] [PMC free article] [PubMed] [Google Scholar]
- Tawhai M., Pullan A. A., Hunter P. J. (2000). Generation of an anatomically based three-dimensional model of the conducting airways. Ann. Biomed. Eng. 28 793–802 [DOI] [PubMed] [Google Scholar]
- Timchalk C., Poet T. S., Lin Y., Weitz K. K., Zhao R.,, Thrall K. D. (2001a). Development of an integrated microanalytical system for analysis of lead in saliva and linkage to a physiologically based pharmacokinetic model describing lead saliva secretion. AIHAJ 62 295–302 [DOI] [PubMed] [Google Scholar]
- Timchalk C., Trease H. E., Trease L. L., Minard K. R.,, Corley R. A.(2001b). Potential technology for studying dosimetry and response to airborne chemical and biological pollutants. Toxicol. Ind. Health 17 270–276 [DOI] [PubMed] [Google Scholar]
- Weibel E. R. Morphometry of the Human Lung. Springer,; Berlin: (1963). [Google Scholar]
- Xi J., Longest P. W.,, Martonen T. B. (2008). Effects of the laryngeal jet on nano- and microparticle transport and deposition in an approximate model of the upper tracheobronchial airways. J. Appl. Physiol. 104 1761–1777 [DOI] [PubMed] [Google Scholar]
- Yeh H. C., Schum G. M. (1980). Models of human lung airways and their application to inhaled particle deposition. Bull. Math. Biol. 42 461–480 [DOI] [PubMed] [Google Scholar]
- Yeh H. C., Schum G. M.,, Duggan M. T. (1979). Anatomic models of the tracheobronchial and pulmonary regions of the rat. Anat. Rec. 195 483–492 [DOI] [PubMed] [Google Scholar]
- Zhang Z., Kleinstreuer C., Donohue J. F.,, Kim C. S. (2005). Comparison of micro- and nano-size particle depositions in a human upper airway model. J. Aerosol Sci. Technol. 36 211–233 [Google Scholar]