

Abstract
Aerobes and anaerobes alike express a plethora of essential iron enzymes; in the resting state, the iron atom(s) in these proteins are in the ferrous state. For aerobes, ferric iron is the predominant environmental valence form which, given ferric iron’s aqueous chemistry, occurs as ‘rust’, insoluble, bio-inert polymeric ferric oxide that results from the hydrolysis of [Fe(H2O)6]3+. Mobilizing this iron requires bio-ferrireduction which in turn requires managing the rapid autoxidation of the resulting FeII which occurs at pH > 6. This review examines the aqueous redox chemistry of iron and the mechanisms evolved in aerobes to suppress the ‘rusting out’ of FeIII and the ROS-generating autoxidation of FeII so as to make this metal ion available as the most ubiquitous prosthetic group in metallobiology.
Keywords: Electrochemistry, Electron transfer, Ferrireduction, Ferroxidation, Iron metabolism, Iron trafficking, Iron transport, Multicopper oxidase, Siderophore, Transferrin
1. Introduction [1-7]
Aerobes and anaerobes alike express a broad array of enzymes and other proteins whose structure and function depend on iron as a prosthetic group. These prosthetic groups include mono- and dinuclear iron; Fe-S clusters; and heme. Irrespective of the prosthetic group, the assembly of all of them requires ferrous iron, FeII. Although the functions supported by these enzymes, in particular, are broad, it is their roles in energy metabolism which allows one to say that nearly all organisms ‘run’ on enzymes with active sites metallated by ferrous iron (Fig. 1).
Fig. 1.
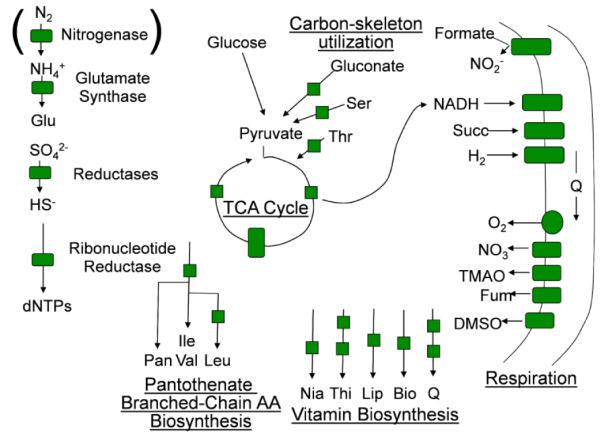
Iron enzymes common to aerobes. Nitrogenase is included although not common in aerobes. Adapted from unpublished image created by J. Imlay (with permission).
That this is true of both anaerobes and aerobes underscores the fact that these enzymes evolved along with the proliferation of anaerobic life in the Archean during which time the environmental redox potential was <0 relative to the potential of the standard hydrogen electrode (SHE). Indeed, this potential is estimated to have been ca −400 mV [8]. Under these geochemical conditions, the stable form of Fe was FeII; in the Archean, iron was soluble and biologically freely available. This fact simply reflects the speciation of iron as a function of solution E and pH which is illustrated by iron’s Pourbaix diagram (Fig. 2) [9].
Fig. 2.
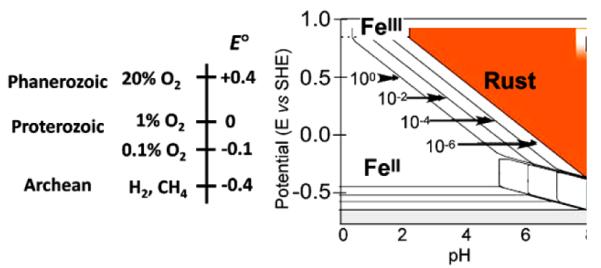
Oxygenation of the biosphere, the environmental redox potential [8], and iron’s Pourbaix diagram [9].
Given the relative availability of aqueous iron (the element which constitutes ~5% of the earth’s crust) one is not surprised that iron found its essential niche as the most common prosthetic element in biology. However, iron’s promiscuous coordination and redox chemistry truly explains why it was the metal of choice upon which to design broad-based intermediary metabolism and energy transduction pathways in evolving anaerobes. These two chemical characteristics are tightly coupled: as goes iron’s ligand sphere, so goes its redox chemistry and bioavailability. The Proposal presented here is that tuning of Fe electrode potential, E, by the metal’s coordination is a defining feature of not only iron’s function, but of its metabolism as well.
2. The aqueous chemistry of iron under air
Underlying iron’s Pourbaix diagram (Fig.2) are the details of the aqueous redox and hydrolysis equilibria associated with FeII and FeIII, equilibria which, naturally, are thermodynamically tightly linked. Fig. 3 summarizes two features of the solution behavior of these two ions (Fig. 3A) and the hydrolysis reaction involving FeIII in H2O that is associated with these behaviors (Fig. 3B) [10]. Thus, aquo FeII is relatively stable and soluble, in comparison to FeIII. The reason for this difference, and for the pH-dependent instability of FeIII in water (Fig. 2) is the rapid and pH-dependent rate of hydrolysis of [Fe(H2O)63+] which results in formation of polymeric ferric hydroxide species (Fig. 3B), known colloquially as rust [11]. The propensity for FeIII-bound H2O to lose H+ (hydrolyze) rather than for aqua-FeIII to lose H2O is reflected in the 104-fold greater rate of water exchange from ferrous in comparison to ferric iron (Fig. 3A). That is, water as a ligand to FeII is far more labile; this kinetic difference is, not surprisingly, seen with other ligand types and reflects the kinetic basis for the relative stability of ferric versus ferrous complexes involving identical ligands. The ratio of this difference in stability can be represented by log βIII/βII where β is the overall stability constant of a given complex. Of course, this ratio can be greater or less than one; broadly, for ‘hard’, oxygen-rich ligands, this ratio is >1, while for nitrogenous ligands, it is typically <1.
Fig. 3.
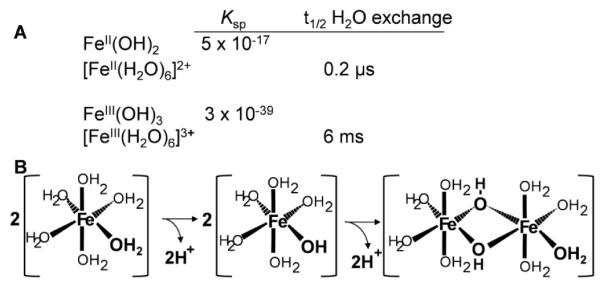
Aqueous chemistry of FeII and FeIII. (A) Solubility product constants and H2O exchange rates. (B) Hydrolysis reaction of [Fe(H2O)6]3+ . Data from [10].
The Pourbaix diagram in Fig. 2 is a direct consequence of this ratio and its dependence on [H+]; as given by the Nernst equation, this corresponds to a decrease of 60 mV per each pH unit above the standard state of 1M H+; at pH = 0 E° for the FeII/Feiii couple is +770 mV, i.e., FeII is a poor reductant. This diagram also reflects the solubility products of ferrous versus ferric hydroxide which favors ferrous iron by a factor of 1022. Thus, when [OH−] = 1M, E° = −530 mV, i.e. ferrous iron becomes a very strong reductant because the ratio, [FeIII]/[Feii] = 10−22, favors FeIII by mass action. This behavior is simply a reflection of the relative stability of the ferrous versus ferric state within the context of the iron’s ligand sphere, whether contributed solely by water or hydroxide; a ligand set composed entirely of atoms from non-solvent ligands; or a mixed ligand set composed of both water and solute-(or protein) derived atoms. Again, this relative stability is given by the ratio logβIII/βII which functions quantitatively in the Nernst equation similar to log[H+] or log[Ox]/[Red].
This equilibrium picture of iron’s aqueous redox chemistry is complemented by the kinetic one: the rate of FeII oxidation – electron transfer – to dioxygen (autoxidation) strongly correlates to the solution pH, or to logβIII/βII: stabilizing FeIII relative to FeII ‘catalyzes’ ferrous iron autoxidation. In other words, complementing iron’s Pourbaix diagram which is a reflection of equilibrium thermodynamics is electron transfer from FeII to O2. This pH-dependence of autoxidation is illustrated in Fig. 4; here the rate of FeII oxidation is quantified by the rate of O2-reduction using a Clark-type O2 electrode. Corresponding to the Pourbaix diagram, above pH 7, the half-life of FeII under air (pO2 = 160 mmHg or 240 μM) <1 min (Fig. 4). Given the rate of hydrolysis of [Fe(H2O)6]3+ which is ~3×10⁷ s−1 [11] aqueous ferric iron will precipitate as fast as it is formed by autoxidation at neutral pH and [Fe]total > 1 μM or so [12]. Put another way, 10 μM solutions of ferrous ammonium sulfate at pH 7 under air can’t be stored for later use.
Fig. 4.
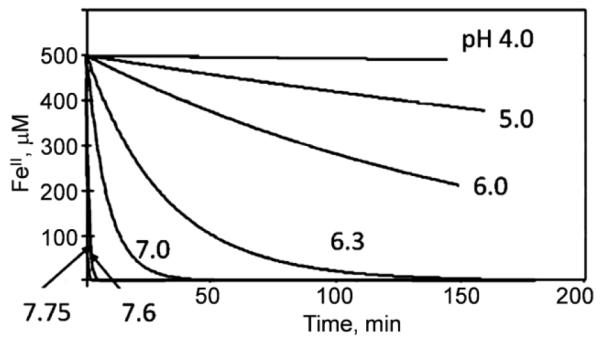
Autoxidation of FeII. FeII→FeIII conversion is quantified by consumption of O2 using a Clark electrode; the electron stoichiometry was 3.8:1 at all pH values. Overlapping buffers used were 100 mM acetate, MES and MOPS. Chen and Kosman, unpublished.
3. Ligand modulation of iron’s redox chemistry
The logβIII/βII term above reflected the solubility product constants of FeIII versus FeII when liganded to water molecules. Of course, it applies irrespective of the coordinating ligands. As noted, logβIII/βII will be positive for a ligand set that includes ‘hard’ ligand atoms (primarily containing -O) and negative for a set that includes ‘soft’ atoms such as –N. Biologically, the first ligand set would include carboxylate and hydroxamate groups; the second would encompass imidazole or pyrrole (N) and, less commonly, methionine or cysteine side chains (S). A common ligand set is represented by the carboxylate-containing ones that are minimally bi-dentate, starting with citrate, ending with EDTA. For this series, although the log stability constants (for the ferric iron complexes) vary from 11.5 to 25.1, the logβIII/βII values vary over a much smaller range, from 8 to 10.7, although always favoring FeIII. If considered in terms of a Brønsted-type relationship between stability of the FeIII complex and the logβIII/βII value, the Brønsted β value is fractional. Nonetheless, the difference in this ratio does correlate with a difference in the rate of autoxidation of the corresponding ferrous iron complexes. This is illustrated in Fig. 5. The associated rates can be plotted as a function of the logβIII/βII values which demonstrates that a linear, rate-equilibrium free energy relationship governs the kinetic stability of ferrous iron under air in relation to the coordination sphere of the metal.
Fig. 5.

‘Catalysis’ of FeII autoxidation by chelation. (A) Autoxidation of FeII in the presence of oxygenous chelators of increasing ligand stability. (B) Rate equilibrium free energy relationship between relative stability of FeIII complex and autoxidation rate. The buffer was 50 mM MES with [chelator] = 1 mM. In addition to citrate and EDTA, the chelators were: IDA, iminodiacetic acid; EDDP, ethylenediamine-N,N’-dipropionic acid; HIDA, N-(2-hydroxyethyl)iminodiacetic acid; NTA, nitrilotriacetic acid; and HEDTA, N-(2-hydroxyethyl)ethylenediamine-N,N’,N’-triacetic acid. Chen and Kosman, unpublished.
Contributing to the autoxidation rate and the underlying chemical basis for it is the iron speciation with regards to bound waters whose hydrolysis will modulate the iron’s reduction potential and thus driving force for the electron transfer to O2. Hydrolysis of bound waters increases the stability of the ferric form and thus drives down the reduction potential. An example of this is the iron-NTA system in which, depending on the number of NTA and water molecules (and their hydrolysis) in the coordination sphere logβIII varies from 24 to 52 with a corresponding decrease in reduction potential from −90 to −550 mV [13]. The experiments in Fig. 5 were carried out at pH 5 to suppress this complex speciation which follows from hydrolysis of bound waters.
Of importance to biologic iron’s redox chemistry is how the protein scaffold manages this water hydrolysis (pH) modulation of the prosthetic group’s E. At one extreme is a biologic ligand sphere that excludes H2O entirely by being fully 6-coordinate. With no inner sphere substrate ligand access, such a group would serve only in strictly outer-sphere (OS) electron transfer (ET) reactions, e.g. cytochrome c. In 5-coordinate FeII heme, e.g. the heme b in hemoglobin, the ligand sphere modulates O2 redox behavior in oxy-HbA via control of spin state and bonding so as to suppress FeII→O2 charge (electron) transfer [14] With an E°’ = 140 mV, the FeII in HbA would be a good candidate thermodynamically for autoxidation. This represents a common theme in biology: kinetic control of an otherwise thermodynamically favorable process.
The discussion above is provided to state the obvious, namely that the FeIII/FeII reduction potential can vary by well over a volt within the context of reasonably physiologic conditions of pH and coordination sphere (Fig. 6) [15]. As the strength of the ligand field increases, FeII becomes a better reductant because FeIII is relatively better stabilized; simply, Fig. 6 illustrates the logβIII/βII relationship discussed above. The diagram also illustrates the fact that the typical iron complex under air is in the ferric form. The diagram and this fact raise the two questions fundamental to iron metabolism: 1) what are the characteristics of these complexes that prevent the ferric iron from ‘rusting out’; and 2) how does an organism labilize this seemingly redox inert and coordinately stable ferric iron so as to make it a substrate for its iron metabolic pathways?
Fig. 6.

Dispersion of iron redox potentials in biologically-relevant coordination complexes. Symbols R and O denote lower and upper limits of cellular redox couples involved in iron trafficking. Consequently, to be a substrate for these metabolic pathways, the E°’ of biologic iron must fall within these limits. Diagram based on [15].
The answer to the first question is simple: provide a ligand sphere that prevents ferric iron hydrolysis. This can be achieved by excluding solvent water altogether, or by sterically restricting the oxo-bridging of FeIII atoms that leads to polymerization. Thus, many hydroxamate and catecholate siderophores are 6-coordinate [15, 16]. In transferrin (Tf), while there are two ‘open’ coordination sites, the metal ion is buried in a clam-shell fold in the protein making it sterically impossible for two Tf molecules to dimerize via the oxo-bridging of their Fe-atoms [17]. Answering the second question will be the focus of the remainder of this brief review.
4. Ferric iron binding proteins: stabilizing FeIII
Free-living unicellular aerobes must scavenge ferric iron and must do so either from the small pool of soluble ferric iron complexes, e.g., ferric citrate, or via the intermediary of catecholate and/or hydroxamate siderophores (among others) [18-24]. With affinities which correlate with logβIII values as great as 50, siderophores compete efficiently with HO− for FeIII. Siderophores are synthesized and secreted by some, but not all, bacteria and fungi; however, irrespective of whether a given microorganism synthesizes one or more of these extracellular ferric iron chelating agents, the vast majority express the exocytoplasmic protein components required for their sequestration and metabolism leading to ionic Fe-accumulation. Thus, some microbes ‘cannibalize’ siderophore iron targeted for competitor free-living organisms much as pathogens use those same side-rophores to cannibalize host iron in the context of an infection [18, 19, 25, 26]. Among multi-cellular organisms, metazoa obtain iron via transcellular trafficking of ingested iron into and across the epithelial cells of the gut. The iron species presented to these cells at their luminal (apical) side is complex, reflecting both inorganic (ferric citrate) and bioinorganic forms (siderophore, heme). The primary uptake route of this iron into the intestinal epithelium is via the divalent metal ion transporter, DMT1 [27-29].
In either system, the environmental iron form is FeIII, stabilized at neutral pH by chelation so as to prevent water hydrolysis as noted above. Obviously, to access this iron for uptake, the bacterial, fungal or epithelial cell must mobilize this tightly bound iron. This mobilization must, to some extent, be kinetically-controlled; simply having an iron mousetrap which binds FeIII more tightly doesn’t guarantee the mouse-trap will work fast enough to meet metabolic needs. Catabolism provides one pathway: the chelating agent is degraded. This occurs in some cases of siderophore iron accumulation [30], and in the recycling of iron from heme in mammals [31]. The second pathway spares the carrier, labilizing the iron by reductive release. Taking advantage of the logβIII/βII values of these chelates which favor FeIII, reductase-dependent 1e− transfer converts the bound FeIII to FeII which is, of course, more weakly bound, and which exhibits much faster rates of ligand exchange. In short, the reductive pathway acts on both the driving force for and barrier to iron release from the bio-chelate. This FeII becomes the substrate for subsequent trafficking, e.g. transport into the cell via DMT1. The latter, reductase-dependent pathway is by far the most prevalent. Being so ubiquitously expressed, it must function efficiently, but considering the electro-chemistry involved, one wonders how this is so.
This puzzle is inherent in the redox scale illustrated in Fig. 6. That is, ferric iron – predominant under air – is made bioavailable by chelation so as to prevent hydrolysis. This requires coordination that ensures large logβIII/βII values which, of course, correlate with large, negative values of iron E, e.g. Tf and siderophore FeIII with E°’ ≅ −500 mV [15, 23, 32]. To reduce this ferric iron requires a reducing agent with a significantly lower, more negative potential: there simply aren’t such bio-reductants. The ‘reducing potential’ of the cytoplasm of a mammalian cell can be estimated at −250 mV using the GSH/GSSG ratio of ca 20 as representing the dominant redox couple in this compartment. E°’ for pyridine nucleotides is lower, −315 mV, but their concentration is ~1/50 that of glutathione which is in the low millimolar range [33-35]. In short, there are no cytoplasmic reducing equivalents which can drive the FeIII/FeII couple towards FeII. Thus, if −300 mV is the lower limit of a cell’s reducing potential, to make reductase-dependent uptake possible the potential of the bound FeIII will have to be ‘tuned’ up, making the iron a better oxidant. The mammalian transferrin (Tf) and bacterial ferric iron binding protein (FbpA) exemplify how nature both protects FeIII from hydrolysis while tuning its potential to less negative values thus making it a substrate for ferri-reduction.
The FeIII coordination sites in the two proteins are illustrated in Fig. 7. They are identical in protein lig and set and configuration: 1) phenol oxygens in cis; 2) carboxylate and phenol oxygens in trans; and 3) one solute ligand site each in trans to phenol oxygen and imidazole nitrogen. Importantly, these two open coordination sites are in cis allowing for binding of both mono- and bidentate ligands. This ligand (or ligands) is generally referred to as “synergistic” since the nature of the ligand(s) modulates the overall stability of the complex and, as we will see, the iron’s reduction potential. The Tf site includes an additional feature that is linked to the modulation of ferric iron binding by pH, at the least; this is a water-bridged, H-bond network between E93 and Nδ1 in H249. DFT calculations are consistent with, although do not prove, that this network promotes the ionization of the proton from this nitrogen [36, 37]; thus, this ligand may be imidazolate and could participate in strong Im→FeIII CT, contributing to the highly negative E° exhibited by Tf-FeIII (Fig. 6).
Fig. 7.

FeIII coordination in human transferrin (A, 1A8E) and Neisseria gonorrhoeae FpbA (B, 1D9Y). Unresolved solute ligands have been inserted, CO32- in hTf, PO32- and H2O in FbpA. Note that in both proteins, solute ligation is trans to homologous His and Tyr ligands. In hTf, H-bond network between Nδ1 in H249 and E93 modulates FeIII binding, possibly by tuning Im→Fe CT.
The thermodynamic and kinetic properties of iron binding to both complexes are strongly dependent on solute-derived ligands; of interest here is how such modulation is reflected in the FeIII reduction potential. This is certainly the case in FbpA [38-41]. Crumbliss and his co-workers have demonstrated a linear relationship between stability (logKeff) and E1/2 as a function of this ligand (Fig. 8); the negative ‘β’ value is expected, of course, as it merely reflects the relation between logβIII/βII and E°’ discussed above. These data suggest the hypothesis that solvent ligand composition can play a physiologic role in regulating the binding and release of Fe in the FbpA system.
Fig. 8.
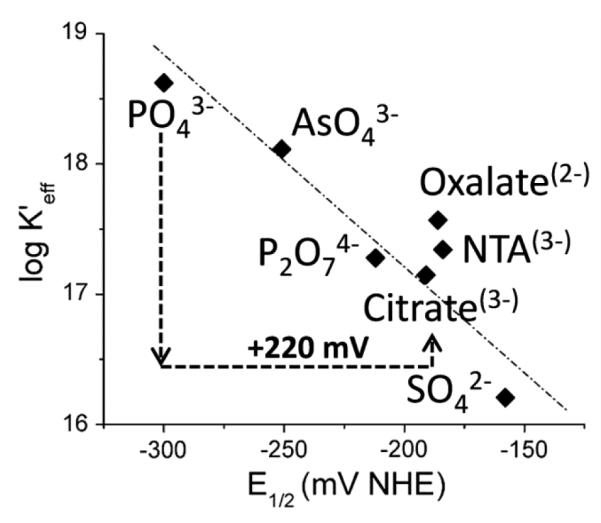
Modulation of holo-FbpA stability and FeIII reduction potential by solute ligand. Citrate effect is specifically noted. Adapted from ref. 37.
In the Fe-Tf system, the exogenous ligand does modulate FeIII release (reflecting a change in Keff) but a correlation with E°’ has not been reported. This brings the discussion back to the notion that Tf FeIII can be made a substrate for cellular reducing equivalents only if it can be made a better oxidant as, for example, citrate does in the FbpA system (Fig. 8). In fact, citrate does modulate Tf FeIII as substrate for ferri-reduction and, consequently, for Fe-uptake by both mammalian cells and yeast. We will use the yeast Fe-uptake system as a model for how ligand sphere modulates the thermodynamics and kinetics of iron mobilization and trafficking.
5. Fungal iron uptake: tuning ferric iron’s E°’ for ferri-reduction
Both pathogenic (Candida albicans, Cryptococcus neoformans) and non-pathogenic fungi (Saccharomyces cerevisiae) express two primary pathways for iron uptake [30, 42-46]. One involves receptor-mediated absorption of siderophore or heme with intracellular recovery of the iron following ligand degradation or reductive iron release. In the second pathway, iron released from its environmental chelate by ferri-reduction is substrate in a subsequent ferroxidase-dependent step. The FeIII product of the ferroxidase reaction is transported into the cytoplasm via a ferric iron transporter. This latter pathway (Fig. 9) is essential to the virulence of pathogenic fungi indicating that it plays a major role in iron acquisition [42]. As illustrated in Fig. 9 the essential protein components of this pathway in fungi are: an NADPH-dependent, heme and flavin-containing ferrireductase (the Fre family); a multicopper ferroxidase (the Fet family); and a ferric iron-specific permease (the Ftr family). The chemical ‘logic’ of this iron redox cycling is outlined as follows.
Fig. 9.
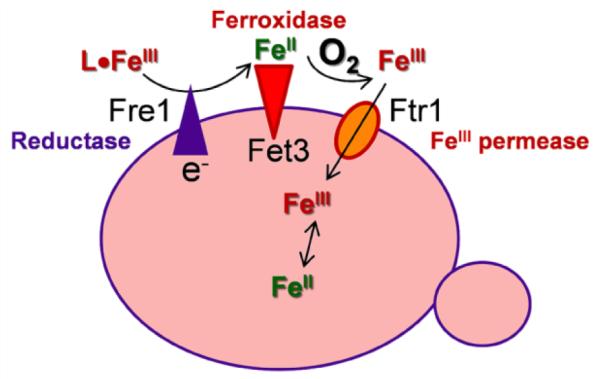
Ferri-reductase, ferri-oxidase Fe-uptake pathway in fungi. The ligand, L, can be anything from citrate to Tf. This redox cycling ‘solves’ the recalcitrant aqueous and redox chemistry of iron at neutral pH as summarized in the text.
Fungal pathogens that colonize humans have two primary sources of circulating Fe: non-transferrin bound iron (NTBI) and transferrin bound iron (TBI). The latter represents 90% of the total iron in the plasma and is therefore the pathogen’s primary iron source [47]. Fungi do not express a receptor for Tf; therefore, Fe-uptake from Tf must rely on the ferrireductase, ferroxidase-dependent pathway for Fe-acquisition [43-45]. Thus uptake of Fe into these cells from the circulation illustrates how a serum solute like citrate, provides the ‘synergy’ needed for these cells to access Tf iron. This synergy is illustrated in three ways in Fig. 10 using S. cerevisiae as a model for how fungi utilize Tf iron.
Fig. 10.

Citrate mobilization of Fe from Tr for Fe-uptake by yeast. Citrate is synergistic in Tf-FeIII reduction (A) and in 59Fe-uptake from from Tf (B). Citrate makes Tf-FeIII a better oxidant by 135 mV (C); with E°’ = −285 mV, Tf-Fe-Cit is substrate for ferri-reduction and Fe-uptake. In both (A) and (B) yeast cells are incubated with 10 μM FeCl3 for 30 min in absence or presence of citrate as noted. In (A), ferrireduction by Fre1 was quantified by trapping the FeII produced with 4,4′-(3-(2-pyridinyl)-1,2,4-triazine-5,6-diyl)bisbenzenesulfonic acid (ferrozine). In (B) Fe uptake via the Fet3, Ftr1 pathway was quantified using the radio-tracer, 59Fe. The data in (C) were obtained spectroelectrochemically following the absorbance of Tf•FeIII using a BASi Epsilon workstation. Ziegler and Kosman, unpublished.
In a buffer that lacks a potential biologic FeIII chelating agent - e.g., aspartic and glutamic acids; citrate; lactate, pyruvate, oxalate - S. cerevisiae exhibits very weak ferri-reductase activity towards FeIII-Tf (Fig. 10A); a weak 59Fe-uptake activity using 59Fe-Tf as substrate results (Fig. 10B). Addition of 100 μM citrate stimulates ferri-reduction 10-fold with a corresponding 7-fold increase in 59Fe-uptake. Other ligands (above) support a comparable stimulation. In plasma, [Cit] varies from 100-200 μM. The molecular basis for this stimulation in ferri-reduction of Tf-FeIII is indicated by the fact that 100 μM citrate increases the reduction potential of Tf iron from −410 to −285 mV (Fig. 10C). This +135 mV increase makes the FeIII a substrate for the ferri-reductase (Fre1, Fig. 9); in yeast the reducing equivalents which drive this reduction come from NADPH. Thus, citrate as the synergistic anion has a comparable effect in Tf as documented in FbpA [38, 41]; in both cases, citrate binding shifts the FeIII/FeII E°’ up into what can be thought of as iron’s ‘metabolic’ potential range which at the negative end is set by the −330 mV of the NADP/NADPH couple. This range was indicated in Fig. 6 (symbols R and O).
As indicated in Fig. 9, fungi (and alga) do not transport this FeII via a divalent metal ion transporter as in plants and metazoa. These unicellular organisms couple ferri-reduction to ferro-oxidation; it is the product of the latter reaction which is substrate for a ferric iron transporter, the Ftr protein. The ferroxidase, Fet3, is a multicopper oxidase. A summary of how this enzyme makes the FeII product of the ferri-reductase a substrate for ferroxidation concludes this review [30, 48-52].
6. Fungal iron uptake: tuning ferrous iron’s E° for ferri-oxidation
As indicated in Fig. 6, at pH 6 the E° of the FeII product of the ferri-reductase is ~420 mV. To be substrate in a ferroxidase reaction, its redox partner must be a better oxidant, that is have a 1e− potential of at least 60 mV higher to ensure a reasonable driving force, both thermodynamically and kinetically. With respect to the latter, however, electron transfer rate is more strongly dependent on the additional factors included in the Marcus equation which quantifies outersphere electron transfer (OS ET). The Marcus relationship is given in Eq. 1 [53-56].
| Eq.1 |
OS ET depends on four factors: 1) probability of a productive ET complex (SKa); 2) electronic coupling between donor and acceptor [HDA, modeled as the lowest unoccupied molecular orbital (LUMO) including both centers]; 3) the driving force, ΔG° for the redox pair; and 4) the reorganization energy, λ. Clearly, the first two factors make a proportionally greater contribution to kET than does ΔG°. Nonetheless, data suggest that the structure of the Fet3 ferroxidase site, which is representative of all multicopper ferroxidases, includes features that maximize all four factors in making FeII the specific substrate for this class of enzymes.
The structure of this active site is given in Fig. 11 [48]. Two carboxylate side chains contribute to a favorable SKa that is represented by the reciprocal of the Michaelis constant for FeII, 1/KM [49]. In addition, these carboxylates, via their H-bonds to the T1 CuII ligands, the imidazoles of H413 and H483, contribute to the electronic matrix coupling, HDA. Last, data indicate that in binding to these two oxygenous ligands, the iron is made a better reductant, with a shift in E° from its potential at pH = 6 of 420 mV, to a potential that could be as low as 190 mV [50, 52]. These data are as follows.
Fig. 11.
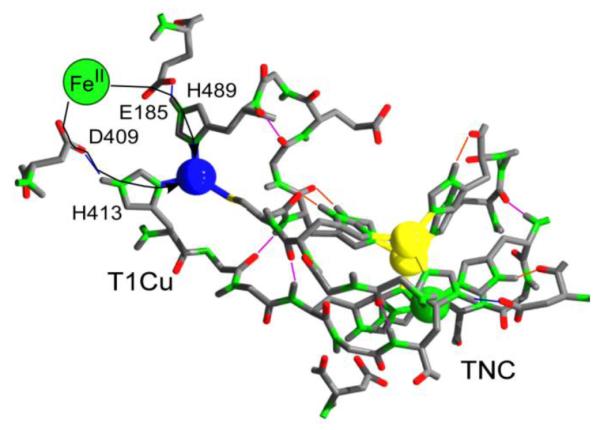
FeII ET site in Fet3 (1ZPU). E185 and D409 provide oxygenous ligand set that tunes down E° of bound FeII while supporting favorable Marcus SKa and HDA terms (Eq. 1).
Anaerobic titration of Fet3 with FeII is stoichiometric, that is, the 4 CuII in the protein are completely reduced with 4 equivalents of FeII. This result indicates that the E for the ‘cell’ FeII + CuII ↔ FeIII + CuI is greater than 120 mV corresponding to a K = 100 favoring ET from FeII→CuII. Since the T1 CuII E°’ is ~430 mV, the E°’ of the FeII bound as substrate would be no more than 310 mV to account for the observed redox equilibrium. In relation to iron’s reduction potential scale illustrated in Fig. 6, this shift towards lower reduction potential for bound FeII is equivalent to an logβIII/βII = 2 term in addition to the factor of 6 associated with the [H+]-dependent logβIII/β . In effect, moving the FeII II from pH = 6 water into the carboxylate-rich ‘solvent’ at the T1 Cu site in Fet3 is equivalent to increasing [HO−] 100-fold. Relative to its stability in bulk solvent, bound FeII is poised in a redox ‘entatic’ state [57-61].
This entasis is not functionally different than the one associated with FeII coordination by citrate in relation to FeII autoxidation. FeCit1- is the dominant species at pH 6 (Fig. 12) [62-64]. As in Fet3, the FeII ligand sphere in the monocitrate complex includes two carboxylates; these two carboxylates are sufficient to support an 5×10³-fold increase in FeII autoxidation rate (at pH 6) [62]. One can view this increase as abiologic, forward genetics in that ‘mutation’ from water to citrate increases function. In comparison, reverse genetics in Fet3, in which the corresponding two carboxylates (E185 and D409) are eliminated by substitution with alanine, results in an 800-fold decrease in electron transfer from FeII to the enzyme’s T1 CuII [49]. Given the multiple factors which contribute to kET (Eq. 1), one can’t take this similar effect to be of any more significance than support for the model that moving FeII into a ligand sphere dominated by oxygenous ligands increases the driving force for subsequent electron transfer. This ‘tuning’ concept has been the point of this review.
Fig. 12.
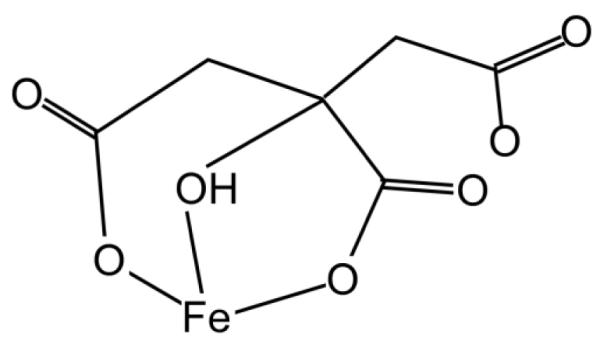
Monomeric ferrous citrate [62].
7. Summary
Iron metabolism involves cycling of iron between the metal ion’s two redox states which are thermodynamically accessible at pO2 levels between 20-160 mmHg, and in the reduction potential range set by common biologic redox couples, +400 to −300 mV, and at neutral pH (Fig. 6). In general, ferric iron is the more favored at neutral pH due to the stronger water coordination to FeIII in comparison to FeII. With hydrolysis, the solubility constant for FeIII(H2O)n is 1/1022 that of FeII. Organisms and cells keep this ferric iron in solution by secretion of chelating agents that bind FeIII more tightly than HO− and by sterically preventing the oxo-bridging of FeIII species that leads to ‘rust’. However, in stabilizing this ferric iron state, the chelating agents set the FeIII reduction potential too low for participation as oxidant in reaction with a biologic reducing agent; this ‘stable’ ferric iron is inert in regards to the ferri-reduction ‘half-reaction’ associated with normal iron metabolism.
Ferroxidation is the other ‘half-reaction’ of this metabolism; the electrochemical ‘cell’ that constitutes this redox reaction involves FeII and the T1 CuII of a multicopper oxidase. There are MCOs which have T1 Cu atoms with E values >600 mV [65, 66]. One might think these would be excellent catalysts of the ferroxidase reaction given the ~420 mV potential of FeII at pH 6. In fact, these enzymes – laccases – react very slowly with FeII despite the apparent strong driving force for this electron transfer. The reason for this sluggish reactivity is in the SKA and HDA Marcus terms which, in laccases, are maximized for electron transfer from aromatic phenols and amines, and not for ET from FeII [67]. In contrast, ferroxidases, which include the fungal Fet and algal Fox proteins [68, 69], and mammalian ceruloplasmin [70, 71] and hephaestin maximize ET from FeII with specific contributions from SKA and HDA and by making the FeII a better reductant. All three factors are contributed by a FeII ligand sphere composed of 2 or 3 carboxylate side chains, two of which are in an H-bond network with the two imidazoles which contribute to the T1 Cu binding site in all ‘blue’ copper proteins.
Potential Fe-ligands from solvent play significant roles in this redox tuning of iron for metabolism. Citrate is one of these. Its concentration in plasma varies between 100-200 μM [72]; as demonstrated in Fig. 10, this [Cit] is sufficient to make Tf iron a substrate for ferri-reduction by shifting the metal ion’s reduction potential into the biologic range. In a similar vein, one can appreciate that the biologic ferroxidase site is functionally little different from the ‘site’ represented by citrate in its coordination of FeII, one which promotes autoxidation, or ferroxidation by another name. This raises a question: If citrate is a good ‘ferroxidase’ why, for example, are ceruloplasmin and hephaestin essential to human iron metabolism? The reason is unrelated to the iron redox chemistry per se but is due to the dependence on [O2] in a given ferroxidase reaction. Abiologic autoxidation is first-order in [O2]; thus, at the typical pO2 in arterial blood – 40 mmHg, or 50 μM O2 – the rate of autoxidation is too sluggish to support normal iron redox cycling. In strong contrast, with a KM for O2 of ~5 μM, multicopper ferroxidases function at 90% capacity at this pO2 and thus continue to support iron homeostasis even under strongly ischemic conditions [73 Last, irrespective of the ambient [O2], the coupling of ferrous iron oxidation to reduction of dioxygen to water, bypassing intermediate, one-electron O2 reduction products – ROS – will have selective advantage for any organism living under air. In this regard, MCO metallo-oxidases, those with specificity towards both FeII and CuI, are important components of the anti-oxidant systems required for aerobic homeostasis.
In conclusion, the iron redox cycling apparent in fungal and algal iron uptake (Fig. 9) can be understood in terms of the differing aqueous behavior of FeII and FeIII under air. Iron available to free-living, unicellular organisms is ferric; as is the case for the intestinal enterocyte, which is “outside the body” topologically, to be mobilized for uptake, this ferric iron must be reduced. Fungi express Fre proteins for this [30, 74], enterocytes express Dcytb [27, 28]. This FeII is a pro-oxidant. In the gut, which is anoxic [75, 76], this abiologic chemistry is suppressed allowing for the direct uptake of this FeII by the enterocyte via the divalent metal ion transporter, DMT1 [27, 28]. In the microorganism under a pO2 = 160 mm Hg, autooxidation is rapid (Fig. 4 and 5), thus the inherent pro-oxidant activity of FeII must be managed, a function performed by the MCO ferroxidase. The product of the ferroxidase reaction, FeIII, is unstable at neutral pH; to suppress its hydrolysis, it must be shielded from solvent water. This is achieved by the direct, non-dissociative trafficking – the channeling – of Fet-produced FeIII to the Ftr permease for translocation into the cell. That is, much as access to coordination sites at siderophore and transferrin ferric iron can effect modulation of FeIII reduction potential, restricted water access to FeIII can modulate this metal ion’s propensity to ‘rust out.’
Highlights (for review).
Iron is a ubiquitous redox cofactor
Iron’s aerobic aqueous redox chemistry strongly limits its bioavailability and redox stability
Aerobic iron metabolism involves cycles of ferrireduction and ferroxidation
The electrode potential of the ferrous-ferric couple is ‘tuned’ for this bio-metabolism by specific coordination
Acknowledgements
This review reflects the efforts and insights of a group of talented graduate students working in the Solomon and Kosman labs. It is written in appreciation of this collaboration on the occasion of Professor Solomon’s 65th birthday and the Symposium organized by his students and colleagues in celebration. The work in the Kosman lab described here has been supported by a grant from the National Institutes of Health, DK53820, support which is gratefully acknowledged.
Abbreviations
- SHE
standard hydrogen electrode
- OS ET
outersphere electron transfer
- Tf
transferrin
- DMT1
divalent metal ion transporter 1
- FbpA
ferric iron binding protein A
- DFT
density functional theory
- CT
charge transfer
- NTBI
non-transferrin bound iron
- TBI
transferrin bound iron
Footnotes
Publisher's Disclaimer: This is a PDF file of an unedited manuscript that has been accepted for publication. As a service to our customers we are providing this early version of the manuscript. The manuscript will undergo copyediting, typesetting, and review of the resulting proof before it is published in its final citable form. Please note that during the production process errors may be discovered which could affect the content, and all legal disclaimers that apply to the journal pertain.
References
- [1].Williams RJP. Proc. Roy. Soc. Lond. Series B. 1981;213:361–397. [Google Scholar]
- [2].Crichton RR, Pierre JL. Biometals. 2001;14:99–112. doi: 10.1023/a:1016710810701. [DOI] [PubMed] [Google Scholar]
- [3].Williams RJP, da Silva J.J. Frausto. J. Theor. Biol. 2003;220:323–343. doi: 10.1006/jtbi.2003.3152. [DOI] [PubMed] [Google Scholar]
- [4].Williams RJ. FEBS Lett. 2012;586:479–484. doi: 10.1016/j.febslet.2011.05.068. [DOI] [PubMed] [Google Scholar]
- [5].Buick R. Philos Trans R Soc Lond B Biol Sci. 2008;363:2731–2743. doi: 10.1098/rstb.2008.0041. [DOI] [PMC free article] [PubMed] [Google Scholar]
- [6].Sheftel AD, Mason AB, Ponka P. Biochim. Biophys. Acta. 2011 doi: 10.1016/j.bbagen.2011.08.002. [DOI] [PMC free article] [PubMed] [Google Scholar]
- [7].Pierre JL, Fontecave M, Crichton RR. Biometals. 2002;15:341–346. doi: 10.1023/a:1020259021641. [DOI] [PubMed] [Google Scholar]
- [8].Willams RJP. J. R. Soc. Interface. 2007;4:1049–1070. doi: 10.1098/rsif.2007.0225. [DOI] [PMC free article] [PubMed] [Google Scholar]
- [9].Doctors C. http://corrosion-doctors.org/Corrosion-Thermodynamics/Potential-pH-diagram-iron.htm.
- [10].Burgess J. Ions in solution: basic principles of chemical interactions. Woodhead Publishing; Sawston (Cambridge) UK: 1999. [Google Scholar]
- [11].Hemmes P, Rich LD, Cole DL, Erying EM. J. Phys. Chem. 1971;75:929–932. [Google Scholar]
- [12].Rose AL, Waite TD. Environ Sci Technol. 2003;37:3897–3903. doi: 10.1021/es034102b. [DOI] [PubMed] [Google Scholar]
- [13].Cuculic V, Pizeta I, Branica M. Electroanal. 2005;17:2129–2136. [Google Scholar]
- [14].Nakashima H, Hasegawa J-Y, Nakatsuji H. J. Comput. Chem. 2006;27:426–433. doi: 10.1002/jcc.20339. [DOI] [PubMed] [Google Scholar]
- [15].Dhungana S, Crumbliss AL. Geomicrobiol. 2005;22:87–98. [Google Scholar]
- [16].Crumbliss AL, Harrington JM. Adv. Inorg. Chem. 2009;61:179–250. [Google Scholar]
- [17].MacGillivray RT, Moore SA, Chen J, Anderson BF, Baker H, Luo Y, Bewley M, Smith CA, Murphy ME, Wang Y, Mason AB, Woodworth RC, Brayer GD, Baker EN. Biochemistry. 1998;37:7919–7928. doi: 10.1021/bi980355j. [DOI] [PubMed] [Google Scholar]
- [18].Chu BC, Garcia-Herrero A, Johanson TH, Krewulak KD, Lau CK, Peacock RS, Slavinskaya Z, Vogel HJ. Biometals. 2010;23:601–611. doi: 10.1007/s10534-010-9361-x. [DOI] [PubMed] [Google Scholar]
- [19].Beasley FC, Heinrichs DE. J Inorg Biochem. 2010;104:282–288. doi: 10.1016/j.jinorgbio.2009.09.011. [DOI] [PubMed] [Google Scholar]
- [20].Barry SM, Challis GL. Curr Opin Chem Biol. 2009;13:205–215. doi: 10.1016/j.cbpa.2009.03.008. [DOI] [PubMed] [Google Scholar]
- [21].Clifton MC, Corrent C, Strong RK. Biometals. 2009;22:557–564. doi: 10.1007/s10534-009-9207-6. [DOI] [PubMed] [Google Scholar]
- [22].Miethke M, Marahiel MA. Microbiol Mol Biol Rev. 2007;71:413–451. doi: 10.1128/MMBR.00012-07. [DOI] [PMC free article] [PubMed] [Google Scholar]
- [23].Boukhalfa H, Crumbliss AL. Biometals. 2002;15:325–339. doi: 10.1023/a:1020218608266. [DOI] [PubMed] [Google Scholar]
- [24].Braun V, Braun M. Curr Opin Microbiol. 2002;5:194–201. doi: 10.1016/s1369-5274(02)00298-9. [DOI] [PubMed] [Google Scholar]
- [25].Siburt CJ, Roulhac PL, Weaver KD, Noto JM, Mietzner TA, Cornelissen CN, Fitzgerald MC, Crumbliss AL. Metallomics. 2009;1:249–255. doi: 10.1039/b902860a. [DOI] [PMC free article] [PubMed] [Google Scholar]
- [26].D’Onofrio A, Crawford JM, Stewart EJ, Witt K, Gavrish E, Epstein S, Clardy J, Lewis K. Chem Biol. 2010;17:254–264. doi: 10.1016/j.chembiol.2010.02.010. [DOI] [PMC free article] [PubMed] [Google Scholar]
- [27].Anderson GJ, Vulpe CD. Cell Mol Life Sci. 2009;66:3241–3261. doi: 10.1007/s00018-009-0051-1. [DOI] [PMC free article] [PubMed] [Google Scholar]
- [28].Garrick MD, Garrick LM. Biochim Biophys Acta. 2009;1790:309–325. doi: 10.1016/j.bbagen.2009.03.018. [DOI] [PubMed] [Google Scholar]
- [29].Anderson GJ, Frazer DM. Curr Gastroenterol Rep. 2005;7:365–372. doi: 10.1007/s11894-005-0005-1. [DOI] [PubMed] [Google Scholar]
- [30].Kosman DJ. Mol. Microbiol. 2003;47:1185–1197. doi: 10.1046/j.1365-2958.2003.03368.x. [DOI] [PubMed] [Google Scholar]
- [31].Knutson M, Wessling-Resnick M. Crit Rev Biochem Mol Biol. 2003;38:61–88. doi: 10.1080/713609210. [DOI] [PubMed] [Google Scholar]
- [32].Kraiter D, Zak O, Aisen P, Crumbliss AL. Inorg. Chem. 1998;37:964–968. [Google Scholar]
- [33].Jones DP, Carlson JL, Mody VC, Cai J, Lynn MJ, Sternberg P. Free Radic Biol Med. 2000;28:625–635. doi: 10.1016/s0891-5849(99)00275-0. [DOI] [PubMed] [Google Scholar]
- [34].Go YM, Jones DP. Biochim. Biophys. Acta. 2008;1780:1273–1290. doi: 10.1016/j.bbagen.2008.01.011. [DOI] [PMC free article] [PubMed] [Google Scholar]
- [35].Jones DP, Liang Y. Free Rad. Biol. Med. 2009;47:1329–1338. doi: 10.1016/j.freeradbiomed.2009.08.021. [DOI] [PMC free article] [PubMed] [Google Scholar]
- [36].Rinaldo D, Field MJ. Biophys J. 2003;85:3485–3501. doi: 10.1016/S0006-3495(03)74769-9. [DOI] [PMC free article] [PubMed] [Google Scholar]
- [37].Rinaldo D, Field MJ. Aust. J. Chem. 2004;57:1219–1222. [Google Scholar]
- [38].Dhungana S, Taboy CH, Anderson DS, Vaughan KG, Aisen P, Mietzner TA, Crumbliss AL. Proc Natl Acad Sci U S A. 2003;100:3659–3664. doi: 10.1073/pnas.0536897100. [DOI] [PMC free article] [PubMed] [Google Scholar]
- [39].Gabricevic M, Anderson DS, Mietzner TA, Crumbliss AL. Biochemistry. 2004;43:5811–5819. doi: 10.1021/bi036217y. [DOI] [PubMed] [Google Scholar]
- [40].Weaver KD, Gabricevic M, Anderson DS, Adhikari P, Mietzner TA, Crumbliss AL. Biochemistry. 2010;49:6021–6032. doi: 10.1021/bi902231c. [DOI] [PMC free article] [PubMed] [Google Scholar]
- [41].Siburt C.J. Parker, Mietzner TA, Crumbliss AL. Biochim Biophys Acta. 2012;1820:379–392. doi: 10.1016/j.bbagen.2011.09.001. [DOI] [PubMed] [Google Scholar]
- [42].Sanchez AA, Johnston DA, Myers C, Edwards JE, Jr., Mitchell AP, Filler SG. Infect Immun. 2004;72:598–601. doi: 10.1128/IAI.72.1.598-601.2004. [DOI] [PMC free article] [PubMed] [Google Scholar]
- [43].Knight SA, Vilaire G, Lesuisse E, Dancis A. Infect Immun. 2005;73:5482–5492. doi: 10.1128/IAI.73.9.5482-5492.2005. [DOI] [PMC free article] [PubMed] [Google Scholar]
- [44].Jung WH, Sham A, White R, Kronstad JW. PLoS Biol. 2006;4:e410. doi: 10.1371/journal.pbio.0040410. [DOI] [PMC free article] [PubMed] [Google Scholar]
- [45].Jung WH, Sham A, Lian T, Singh A, Kosman DJ, Kronstad JW. PLoS Pathog. 2008;4:e45. doi: 10.1371/journal.ppat.0040045. [DOI] [PMC free article] [PubMed] [Google Scholar]
- [46].Jung WH, Hu G, Kuo W, Kronstad JW. Eukaryot Cell. 2009;8:1511–1520. doi: 10.1128/EC.00166-09. [DOI] [PMC free article] [PubMed] [Google Scholar]
- [47].Kolb AM, Smit NP, Lentz-Ljuboje R, Osanto S, van Pelt J. Anal Biochem. 2009;385:13–19. doi: 10.1016/j.ab.2008.11.003. [DOI] [PubMed] [Google Scholar]
- [48].Taylor AB, Stoj CS, Ziegler L, Kosman DJ, Hart PJ. Proc. Natl. Acad. Sci. U. S. A. 2005;102:15459–15464. doi: 10.1073/pnas.0506227102. [DOI] [PMC free article] [PubMed] [Google Scholar]
- [49].Stoj CS, Augustine AJ, Zeigler L, Solomon EI, Kosman DJ. Biochemistry. 2006;45:12741–12749. doi: 10.1021/bi061543+. [DOI] [PubMed] [Google Scholar]
- [50].Quintanar L, Stoj C, Taylor AB, Hart PJ, Kosman DJ, Solomon EI. Acc. Chem. Res. 2007;40:445–452. doi: 10.1021/ar600051a. [DOI] [PubMed] [Google Scholar]
- [51].Kosman DJ. J. Biol. Chem. 2010;285:26729–26735. doi: 10.1074/jbc.R110.113217. [DOI] [PMC free article] [PubMed] [Google Scholar]
- [52].Kosman DJ. J. Biol. Inorg. Chem. 2010;15:15–28. doi: 10.1007/s00775-009-0590-9. [DOI] [PubMed] [Google Scholar]
- [53].Marcus RA, Sutin N. Biochim. Biophys. Acta. 1985;811:265–322. [Google Scholar]
- [54].Gray HB, Winkler JR. Chem Phys Lett. 2009;483:1–9. doi: 10.1016/j.cplett.2009.10.051. [DOI] [PMC free article] [PubMed] [Google Scholar]
- [55].Gray HB, Winkler JR. Proc Natl Acad Sci U S A. 2005;102:3534–3539. doi: 10.1073/pnas.0408029102. [DOI] [PMC free article] [PubMed] [Google Scholar]
- [56].Gray HB, Winkler JR. Annu Rev Biochem. 1996;65:537–561. doi: 10.1146/annurev.bi.65.070196.002541. [DOI] [PubMed] [Google Scholar]
- [57].Vallee BL, Williams RJ. Chem Br. 1968;4:397–402. [PubMed] [Google Scholar]
- [58].Vallee BL, Williams RJ. Proc Natl Acad Sci U S A. 1968;59:498–505. doi: 10.1073/pnas.59.2.498. [DOI] [PMC free article] [PubMed] [Google Scholar]
- [59].Cherepanov DA, Mulkidjanian AY. Biochim Biophys Acta. 2001;1505:179–184. doi: 10.1016/s0005-2728(01)00162-1. [DOI] [PubMed] [Google Scholar]
- [60].Kosman DJ. Inorgan. Chim. Acta. 2008;361:844–849. doi: 10.1016/j.ica.2007.10.013. [DOI] [PMC free article] [PubMed] [Google Scholar]
- [61].Yu Q, Salhi CA, Ambundo EA, Heeg MJ, Ochrymowycz LA, Rorabacher DB. J Am Chem Soc. 2001;123:5720–5729. doi: 10.1021/ja002995r. [DOI] [PubMed] [Google Scholar]
- [62].Pham AN, Waite TD. J Phys Chem A. 2008;112:643–651. doi: 10.1021/jp077219l. [DOI] [PubMed] [Google Scholar]
- [63].Silva AM, Kong X, Parkin MC, Cammack R, Hider RC. Dalton Trans. 2009:8616–8625. doi: 10.1039/b910970f. [DOI] [PubMed] [Google Scholar]
- [64].Silva AM, Kong X, Hider RC. Biometals. 2009;22:771–778. doi: 10.1007/s10534-009-9224-5. [DOI] [PubMed] [Google Scholar]
- [65].Solomon EI, Sundaram UM, Machonkin TE. Chem Rev. 1996;96:2563–2606. doi: 10.1021/cr950046o. [DOI] [PubMed] [Google Scholar]
- [66].Sakurai T, Kataoka K. Cell Mol Life Sci. 2007;64:2642–2656. doi: 10.1007/s00018-007-7183-y. [DOI] [PMC free article] [PubMed] [Google Scholar]
- [67].Bertrand T, Jolivalt C, Briozzo P, Caminade E, Joly N, Madzak C, Mougin C. Biochemistry. 2002;41:7325–7333. doi: 10.1021/bi0201318. [DOI] [PubMed] [Google Scholar]
- [68].Terzulli AJ, Kosman DJ. J. Biol. Inorg. Chem. 2009;14:315–325. doi: 10.1007/s00775-008-0450-z. [DOI] [PMC free article] [PubMed] [Google Scholar]
- [69].Terzulli A, Kosman DJ. Eukary. Cell. 2010;9:815–826. doi: 10.1128/EC.00310-09. [DOI] [PMC free article] [PubMed] [Google Scholar]
- [70].Bento I, Peixoto C, Zaitsev VN, Lindley PF. Acta Crystallogr D Biol Crystallogr. 2007;63:240–248. doi: 10.1107/S090744490604947X. [DOI] [PMC free article] [PubMed] [Google Scholar]
- [71].Zaitsev VN, Zaitseva I, Papiz M, Lindley PF. J Biol Inorg Chem. 1999;4:579–587. doi: 10.1007/s007750050380. [DOI] [PubMed] [Google Scholar]
- [72].Konigsberger LC, Konigsberger E, May PM, Hefter GT. J Inorg Biochem. 2000;78:175–184. doi: 10.1016/s0162-0134(99)00222-6. [DOI] [PubMed] [Google Scholar]
- [73].Osaki S, Johnson DA, Frieden E. J Biol Chem. 1966;241:2746–2751. [PubMed] [Google Scholar]
- [74].Kwok EY, Kosman DJ. Top. Curr. Genet. 2006;14:59–99. [Google Scholar]
- [75].Lautenschlager I, Dombrowsky H, Frerichs I, Kuchenbecker SC, Bade S, Schultz H, Zabel P, Scholz J, Weiler N, Uhlig S. Am J Physiol Gastrointest Liver Physiol. 2010;298:G304–313. doi: 10.1152/ajpgi.00313.2009. [DOI] [PubMed] [Google Scholar]
- [76].Crompton DW, Shrimpton DH, Silver IA. J Exp Biol. 1965;43:473–478. doi: 10.1242/jeb.43.3.473. [DOI] [PubMed] [Google Scholar]