Abstract
The interplay between redox-active transition metal ions and redox-active ligands in metalloenzyme sites is an area of considerable research interest. Galactose oxidase (GO) is the archetypical example, catalyzing the aerobic oxidation of primary alcohols to aldehydes via two one-electron cofactors: a copper atom and a cysteine-modified tyrosine residue. The electronic structure of the oxidized form of the enzyme (GOox) has been investigated extensively through small molecule analogues including metal-salen phenoxyl radical complexes. Similar to GOox, one-electron oxidized metal-salen complexes are mixed-valent species, in which molecular orbitals (MOs) with predominantly phenolate and phenoxyl π-character act as redox-active centers bridged by mixing with metal d-orbitals. A detailed evaluation of the electronic distribution in these odd electron species using a variety of spectroscopic, electrochemical, and theoretical techniques has led to keen insights into the electronic structure of GOox.
Keywords: Phenoxyl radical, Galactose oxidase, Transition metals, Salen, Redox-active ligands, Electrochemistry, Spectroscopy, Electronic structure
1. Introduction
Over the last fifteen years, the study of metal-coordinated phenoxyl radicals has received much attention in the literature, in large part due to their biological relevance. The presence of a tyrosyl residue is well established in various metalloenzymes, including class I ribonucleotide reductase [1,2], prostaglandin endoperoxide synthase [3,4], photosystem II [5,6], cytochrome c oxidase [7,8], glyoxal oxidase [9], and galactose oxidase (GO) [10,11]. The latter three are particularly interesting examples of metal-ligand cooperativity in facilitating redox processes.
GO is a mononuclear copper enzyme that catalyzes the aerobic oxidation of primary alcohols to aldehydes, with subsequent reduction of dioxygen to H2O2 (Scheme 1) [11,12]. The coordination sphere contains two equatorial histidine residues (His496, His581), an axial unmodified tyrosine (Tyr495), and an equatorial tyrosine covalently cross-linked to a neighboring cysteine residue in an oxidative post-translational modification (Tyr272, Cys228) [13,14]. The catalytically relevant form of the enzyme (GOox) exists as a CuII modified tyrosyl radical species. Though copper typically participates in redox processes through a single electron CuI/CuII redox couple, the Cys cross-linked tyrosyl radical provides the second oxidizing equivalent necessary for catalytic alcohol oxidation. This redox cooperativity has inspired chemists for nearly two decades to design small molecule analogues of GO, contributing to the understanding of the enzymatic system and the development of ligand frameworks capable of storing oxidizing equivalents for use in multi-electron transformations.
Scheme 1.
Consensus mechanism of GO.
Since the preparation of a stable Fe(III)-phenoxyl radical complex first reported by Wieghardt et al. in 1993, the number of small molecule metal-phenoxyl systems has grown to include a variety of metals in different ligand frameworks [15]. The focus in modeling GO has centered largely around the challenges associated with reproducing the reactivity and spectroscopic properties of the enzyme, and several excellent reviews highlighting this research are available [16-18]. More recently, interest in the mixed-valent state of GOox has developed, and in particular how the asymmetry in phenolate coordination inherent in the enzyme due to the cysteine crosslink of Tyr272 coupled to the axial/equatorial copper coordination effects the electronic structure of this tyrosyl radical species [19,20]. Delocalization of the “hole” onto the Cys cross link is suggested to stabilize GOox significantly (t1/2 = 7.2 days) [11].
It is well established that oxidized metal-salen complexes can exist, in the limiting case, as either a high-valent metal species (Mn+1L−) or a ligand radical (MnL•) depending on the nature of the ligand-field and identity of the metal center. Interestingly, metal-salen phenoxyl radical complexes are mixed-valent species akin to GOox, in which MOs with predominantly phenolate and phenoxyl π-character act as redox centers bridged by mixing with metal d-orbitals. The radical could potentially localize on one-ring (Class I), partially delocalize (Class II), or fully delocalize (Class III), following the Robin-Day classification scheme [21-24]. The extent of radical delocalization is dependent heavily on the identity of the metal center and the structure of the phenolate, which can be derivatized with various substituents to influence the locus of oxidation by introducing electronic asymmetry into the ligand. Our presentation here focuses on metal-phenoxyl complexes of salen-type ligands, with particular attention paid to the characterization of metal-salen phenoxyl radical complexes as mixed-valent species.
2. Ligand Synthesis
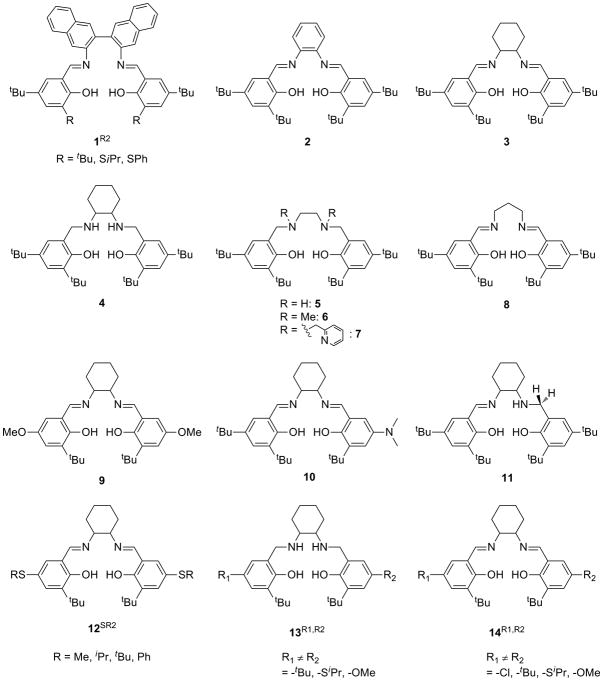
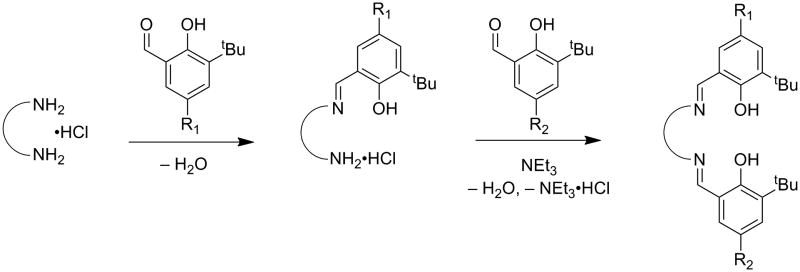
Salen ligands are used extensively in coordination chemistry and catalysis, due to their relative ease of synthesis and propensity to ligate a variety of transition metal ions in a potentially chiral, tetradentate N2O2 coordination mode [25-27]. Ligands are typically synthesized by condensation of two equivalents of salicylaldehyde with one equivalent of diamine (Scheme 2). This condensation reaction allows for a wealth of symmetric salen-type ligands to be produced through the incorporation of various functional groups on the phenolate moieties and by introduction of various diamine linkers. Reduction of the imine bonds to afford symmetric N2O2 amino-phenolate containing salens (“reduced” salens) has also been developed (4, 5, 13R1,R2, Scheme 3) [20,28-30]. Addition of metal salts to solutions of salen ligands readily leads to complexation and formation of metal-salen complexes (MX, where M = metal and X = ligand, Scheme 3). Salen-metal complexes of CuII, NiII, and ZnII are generally four coordinate, distorted planar structures. Increasing the carbon chain length of the diamine allows some CuII complexes to adopt nearly tetrahedral coordination geometries [31,32].
Scheme 2.

Generic salen condensation reaction.
Scheme 3.
Salen ligands.
A synthetic procedure reported by Campbell and Nguyen opened up a vast area in salen ligand variation by allowing for the synthesis of ligands bearing dissimilar phenolates, greatly increasing the electronic and geometric diversity of available complexes (Scheme 4) [33]. This procedure, along with reduction of imino-phenolates and the ability of these ligands to coordinate a variety of transition metal ions, allows for nearly endless permutations of metal complexes. This development has proven particularly useful for GO modeling in that alkyl-sulfanyl substituents can be introduced non-symmetrically into the salen or reduced salen frameworks, providing greater structural and electronic fidelity to the enzyme [20]. In addition to ligands bearing dissimilar phenolate substitution, ligands containing both an amino- and an imino-phenolate moiety, subsequently referred to as “half-reduced” salen, can be accessed by adaptation of the synthetic procedure (Scheme 5). In this case, the presence of a single amino-phenolate provides electronic asymmetry to the ligand framework with identically substituted phenolate moieties. Throughout this review, complexes containing identical phenolates will be referred to as “symmetric”, while complexes containing dissimilar phenolates will be referred to as “non-symmetric”. The terms “symmetric” and “non-symmetric” are used simply for convenience and are not meant to imply any rigorous molecular point group assignment.
Scheme 4.
Synthesis of non-symmetric salen ligands.
Scheme 5.
Synthesis of “half-reduced” salen ligands.
One crucial aspect of ligand design in this research area is the need for phenolate substitution in both the ortho and para positions to ensure stability of the phenoxyl radical complex generated upon oxidation. [34] Without such substitution, radical coupling of the phenoxyl radical species proceeds rapidly, even at temperatures as low as −125°C.
3. General Considerations
One-electron oxidation of metal-phenolate complexes can result, in the limiting case, in the formation of either a ligand radical (MnL•) or a high-valent metal species (Mn+1L−). Not surprisingly, localization of the hole on either the metal center or the ligand framework can lead to dramatic differences in spectroscopic and electrochemical properties. Determination of the locus of oxidation plays a central role in the characterization of these compounds and is crucial to the understanding of the interplay between ligand and metal electronic properties. Simply put, where and to what extent is the hole localized is the question asked. Various spectroscopic techniques and theoretical methods aid in addressing this question.
For a symmetric two-redox center system in the Class II regime, the two states that correspond to localization of the radical on one redox active moiety or the other are modeled by harmonic functions in a Marcus-Hush analysis of these odd electron species. These harmonic functions represent molecular vibrations that map onto the electron transfer coordinate. These diabatic states couple to form two adiabatic energy surfaces: a ground state surface whose two minima represent a partial localization of charge on each redox center, and an excited state surface with a single minimum (Figure 1a). The intervalence charge transfer (IVCT) band corresponds to the optically induced transition between the two adiabatic states, conceptualized as a phenolate-to-phenoxyl ligand-to-ligand charge transfer transition (Figure 2) [35]. These absorptions typically appear in the near infrared region (NIR, 800 - 2500 nm), and the band-shape parameters vmax, εmax, and Δv1/2 are related to the reorganizational energy of the system, λ, and the electronic coupling constant, HAB. For IVCT transitions, the absorption bandwidth is expected to increase with vmax and ΔvHTL according to equation 1. Importantly HAB can be determined experimentally from the vmax, εmax, and Δv1/2 of the IVCT band and an estimate of the electron transfer distance rCT using the Hush equation (equation 2) [22].
Figure 1.
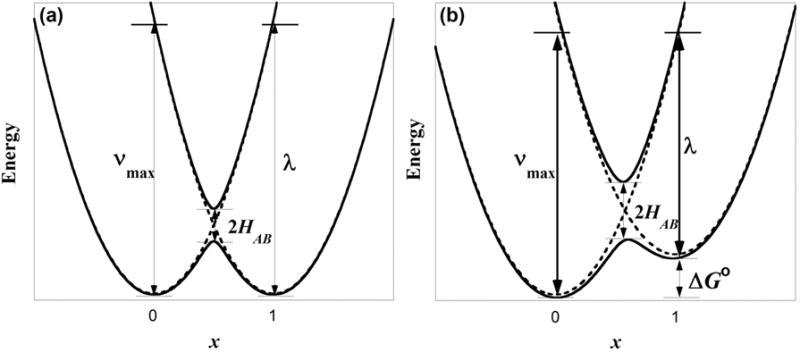
Schemes of Marcus-Hush coupling in (a) symmetric and (b) non-symmetric mixed-valent complexes.
Figure 2.
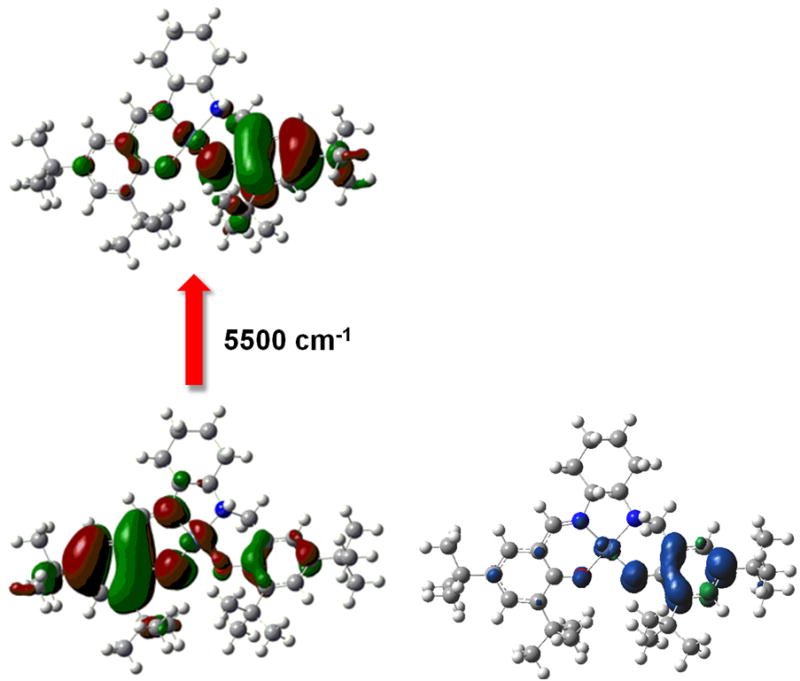
(left) TD-DFT β-HOMO → β-LUMO transition for [Ni11]+ and (right) spin density plot for [Ni11]+ showing radical localization on the amino-phenolate [35].
| (1) |
| (2) |
| (3) |
To extend the Marcus-Hush model to complexes with non-symmetric phenolates, the secular equation that defines the energy of the ground and excited state surfaces is perturbed by the addition of ΔG°, a term that represents the thermodynamic free energy difference between the two localized states (equation 3). For the non-symmetric model, the two minima of the ground state surface now lie at different energies, with the unpaired electron preferentially localized on the ring that was more readily oxidized (Figure 1b). The energy of the IVCT absorption is the sum of λ and ΔG°. Equations 1 and 2 for determining ΔvHTL and HAB are applicable for both the non-symmetric and symmetric models. Compounds bearing dissimilar phenolates will necessarily tend toward a Class II, if not Class I, description because the thermodynamic differentiation of the phenolates will attenuate delocalization; symmetric complexes have a greater possibility of existing as Class III. In the Class III regime, the energy of the IVCT band conveniently provides a direct measure of HAB, as hν = 2HAB [22].
4. Generation of phenoxyl radicals
A variety of chemical and electrochemical techniques are used to generate metal-salen phenoxyl radicals, allowing for the study of these intermediates. In most cases discussed herein, one-electron oxidation leads formally to a single phenoxyl radical rather than a high-valent metal species.
Metal-salen complexes are oxidized using a variety of common chemical oxidants (Table 1) [36]. Choice of oxidant will depend on specific reaction conditions and the potentials of the complexes. The use of oxidants with characteristic optical features is particularly helpful for spectrophotometric titration experiments and in situ optical monitoring of phenoxyl radical formation [19]. In general, metal-salen complexes containing amino-phenolates (i.e. M4, M5, M13R1,R2) are more readily oxidized than their related imino-phenolate complexes because the former are more electron rich [20,29]. However, these amino-phenoxyl radical complexes are less stable than related imino-phenoxyl radicals at room temperature [29]. Potentiometric oxidation is another common method employed to generate the radical species [28,30,37,38]. The ionic strength of the medium in these experiments facilitates oxidation of salen complexes by comparison to spectrophotometric titrations, which are often performed in the absence of electrolyte. For example, the strong chemical oxidant [thianthrene]+ (Th+, Table 1) has a redox potential of + 880 mV vs. Fc/Fc+ in CH2Cl2, but the two-electron oxidized [Cu3]2+, with a second oxidation potential at 650 mV, is not accessible in the absence of electrolyte [19]. The presence of electrolyte or in some cases the counter-anion introduced via chemical oxidants may affect the spectroscopic properties of the phenoxyl species, as anions can associate with complexes, influencing the hole locus [39,40]. A recent report suggests that the identity of the electrolyte during electrochemical oxidations of iron complexes of salen-like ligands alters significantly the sequence of phenolate oxidation through ion pairing effects [41].
Table 1.
Common chemical oxidants used to general metal-salen phenoxyl radicals [36].
| Oxidant | Solvent | E°′ (V) (vs Fc/Fc+) |
|---|---|---|
| [NO]+ | CH2Cl2 | 1.00 |
| Ce(IV) | H2O | 0.88 |
| Th+ | MeCN | 0.86 |
| [N(C6H5Br-4)3]+ | CH2Cl2 | 0.70 |
| Ag+ | CH2Cl2 | 0.65 |
| [Fe(η-C5H4COMe)2]+ | CH2Cl2 | 0.49 |
| [Fe(η-C5H4COMe)Cp]+ | CH2Cl2 | 0.27 |
In most reports, CH2Cl2 is the preferred solvent for the preparation and study of metal-salen phenoxyl radical complexes. The weak ligating abilities of CH2Cl2 to metals helps to ensure that the salen ligands remain coordinated in solution upon oxidation to phenoxyl radicals, which are weaker donors than their parent anionic phenolates. This strategy may become less reliable when operating in high concentrations of electrolyte.
5. Characterization of oxidized salen complexes
5.1. X-ray crystallography
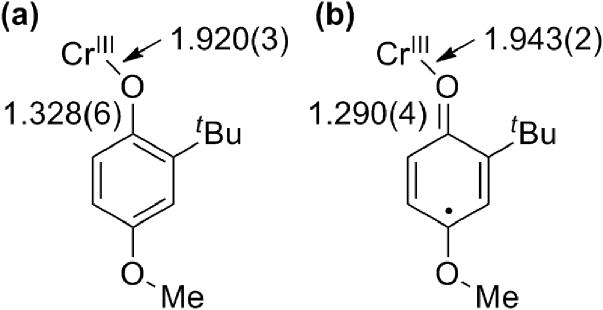
X-ray crystallography is a powerful technique for characterizing oxidized metal-salen complexes and assessing oxidation locus. The first phenoxyl radical complex structurally characterized by Wieghardt et al. (Figure 3), contains a chromium center, coordinated by two phenolates and one phenoxyl radical that differ significantly in their metrical parameters [42]. The Cr – O distance of the phenoxyl radical is elongated by 0.02 Å relative to the phenolates, while the metal bonded O – C bond of the phenoxyl radical is 0.12 Å shorter than the Cr-bonded phenolates; these metrical parameters are consistent with decreased donating ability and a quinoid-like structure for the phenoxyl ring, respectively (Figure 4). Though this metrical trend is useful for identifying phenoxyl radicals in certain systems, exceptions apply, particularly for phenoxyl radicals of salen complexes. For example, oxidation of Ni3 with the hexafluoroantimonate (SbF6−) salt of either Ag+ or Th+ leads to the formation of [Ni3]+SbF6−, solutions of which are stable for weeks at room temperature under dinitrogen [40]. The solid-state structure of [Ni3]+ displays a symmetric coordination sphere contraction, a counterintuitive result given the decreased donating abilities of phenoxyl radicals relative to phenolates. A contraction seems more consistent with a metal-based oxidation. Further spectroscopic analysis combined with density functional theory (DFT) calculations support that [Ni3]+ exists as a phenoxyl radical complex and suggests that an electron is removed from a predominately ligand-based antibonding orbital, leading to the observed coordination sphere contraction [40].
Figure 3.
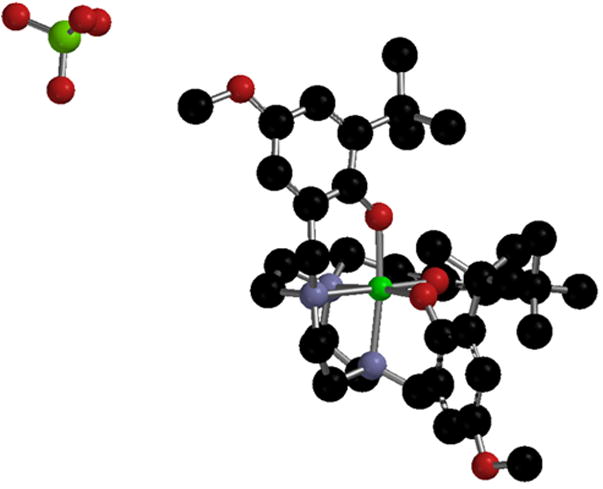
X-ray structure of Cr-tacn phenoxyl radical complex [42].
Figure 4.
Metrical parameters of (a) neutral and (b) oxidized Cr-tacn phenolate complex [42].
Shimazaki and coworkers have extended work on Ni3 to a series that includes the palladium and platinum complexes [43]. Unlike the symmetric contraction in the solid-state structures of the oxidized nickel and platinum complexes, [Pd3]+ displays a non-symmetric coordination, consistent with increased localization of the radical to one side of the molecule [43]. In a later report, the same trend was observed for the propyl-backbone series [Ni8]+, [Pd8]+, and [Pt8]+, even though the geometries are more distorted from a planar coordination due to the increased length of the diamine backbone [44]. This trend suggests that the identity of the metal center within a series plays a significant role in determining the oxidation locus, which is only affected subtly by the geometric distortions afforded by backbone length.
Thomas and coworkers recently reported the solid-state structure of [Cu9]+, providing the first example of an unambiguous Cu-salen metal-phenoxyl radical structure (Figure 5) [45]. The complex displays a non-symmetric coordination sphere change, in which the phenoxyl radical unit is characterized by an increased Cu - O bond length and a decreased O - C bond length (Δ 0.09 Å and Δ −0.06 Å, respectively) relative to the neutral CuII species. The other ring displays phenolate-like metrical characteristics, suggesting a localized ligand radical exists in the solid state. Interestingly, the SbF6− counter-anion is positioned in close proximity to the phenoxyl bearing ring, presumably stabilizing the build-up of positive charge and facilitating radical localization. A similar hole localization is observed for [Ni9]+ in the same report, but these effects may only result from crystal packing forces [45].
Figure 5.
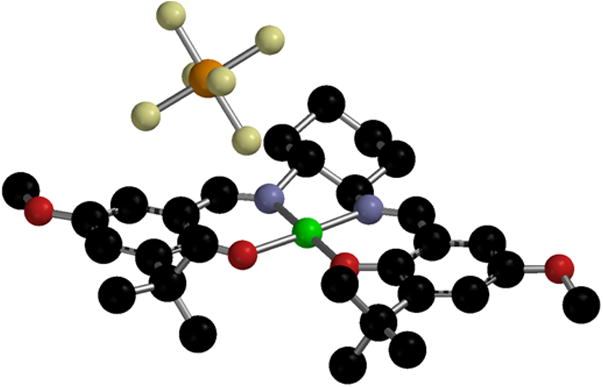
X-ray structure of [Cu9]+SbF6− [45].
The solid state structure of [Ni11]+, which possesses inherent electronic asymmetry, also shows an asymmetric coordination change. The amino-phenolate Ni-O bond is lengthened by 0.04 Å relative to Ni11, suggesting that the hole is localized predominately on the half of the ligand that was initially more electron rich [35]. In the case of [Cu3]+, a weak axial interaction between the metal ion and a fluorine atom of the SbF6− counter-anion exists (2.76 Å), presumably stabilizing the high-valent CuIII center (Figure 6) [46].
Figure 6.
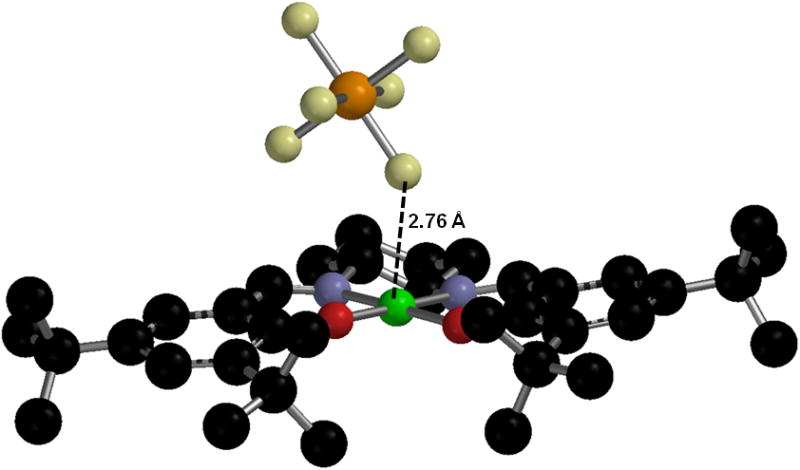
X-ray structure of [Cu3]+SbF6− [46].
Interestingly, a third motif in which the oxidation locus resides on the dimethoxy substituted diiminobenzene bridge of a Cu(II) salen complex has recently been observed by Kochem et al. [47]. In the solid state structure of the one-electron oxidized complex, the C - O bond lengths of the phenolate rings are not contracted significantly, contrary to that anticipated for a phenoxyl radical type complex. In contrast, the two O - C bonds of the methoxy groups to the diiminobenzene backbone are contracted (Δ -0.01 and -0.018 Å), suggesting significant radical localization on the extended π-system of the phenylene backbone [47].
5.2. X-ray absorption spectroscopy
Metal K-edge X-ray absorption spectroscopy (XAS) is a powerful tool for determining metal coordination metrical parameters and the locus of oxidation in metal complexes. Solution EXAFS analysis allows for metrical assessment of complexes unstable in the solid-state, and provides a means for verifying structural similarity between species in solution versus solid-state in which crystal packing effects may lead to geometric differences. For metal-salen complexes, the average metrical parameters in solution generally do not differ significantly from those in the solid state.
Unlike other spectroscopic techniques, XAS is element specific and directly probes atomic effective nuclear charge from which metal oxidation state can be empirically correlated. The metal K-edge 1s → 3d transition, or pre-edge, has been used successfully to determine the oxidation state of metal ions in various metal-salen complexes [32,35,46,48]. Copper K-edge has been used to infer indirectly the formation of a phenoxyl radical upon oxidation of Cu1tBut2 [32]; the copper pre-edge feature for solid state samples of Cu1tBu2 and [Cu1tBu2]+ both lie at 8979 eV, consistent with the copper centers retaining a 2+ oxidation state and ligand based oxidation. In the case of Cu3, however, the pre-edge feature shifts from 8979.2 to 8980.2, consistent with metal based oxidation and the formation of a CuIII species upon oxidation (Figure 7) [46].
Figure 7.
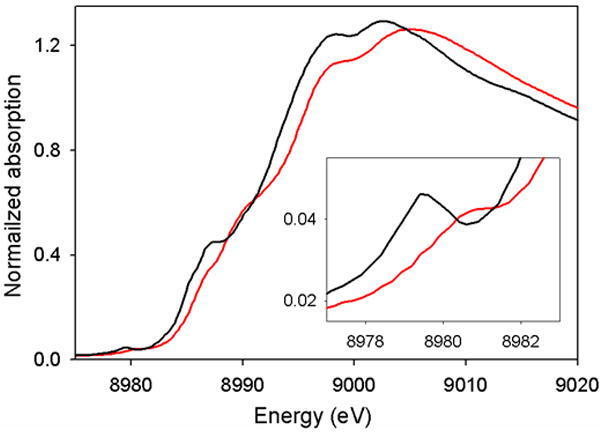
Solid state Cu K-edge of Cu3 (black) and [Cu3]+SbF6− (red) inset: Cu pre-edge region (1s → 3d transition) [46].
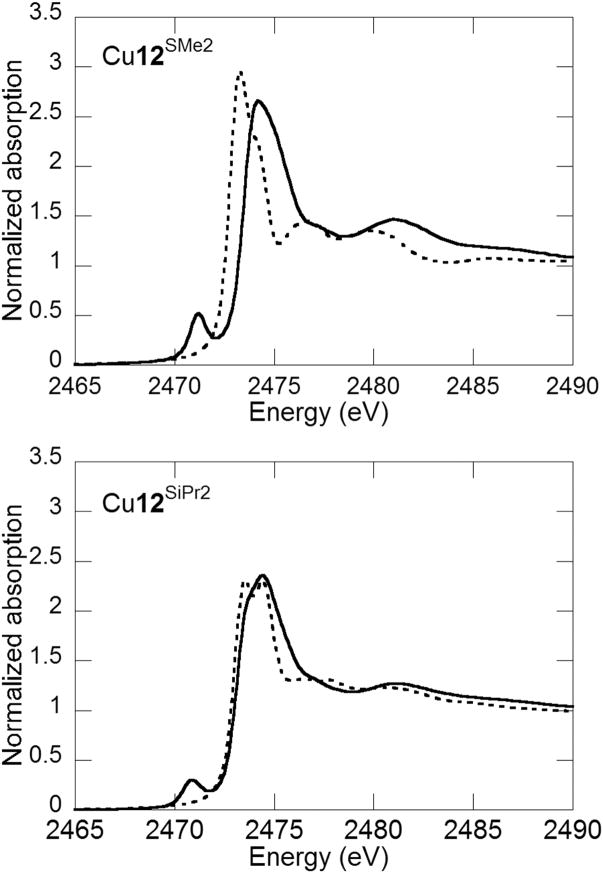
More recently, sulfur K-edge spectroscopy has been used to probe the hole character on alkyl sulfanyl phenolate substituents of oxidized Cu-salen complexes, providing potential insight into the influence of the Cys272 crosslink of GO [19,20]. Sulfur K-edge spectra of neutral Cu12SMe2 and Cu12SiPr2 are dominated by intense main-edge features at ca. 2474 eV. These features shift to higher energy for the oxidized complexes with a larger shift observed for [Cu12SMe2]+ than [Cu12SiPr]+. Such shifts are consistent with an increase of sulfur effective nuclear charge upon oxidation. The oxidized forms also exhibit an additional pre-edge feature at ca. 2471 eV, which is attributed to a S1s-to-phenoxyl singly unoccupied molecular orbital (SUMO) transition, the intensity of which reflects the degree of sulfur p-orbital mixing into the SUMO [49]. Analysis of this feature yields sulfur contributions to the phenoxyl hole of 13% and 8% for [Cu12SMe2]+ and [Cu12SiPr2]+, respectively (Figure 8) [19]. DFT calculations suggest that an orientation of the less sterically demanding -SMe substituent in plane with the phenoxyl ring maximizes S p-orbital overlap with the aromatic π system in [Cu12SMe2]+, allowing for greater delocalization of the hole onto the sulfur atoms [19]. In a recent sulfur K-edge XAS study of GOox itself, Rokhsana et al. report a sulfur contribution from the Cys-Tyr cross link to the tyrosyl hole of 24 ± 3 % [50]. This value is in good agreement with previous electron paramagnetic resonance (EPR) studies of apo-GOox that predicted a value of 20 ± 3 % [51].
Figure 8.
Solid state sulfur K-edge of neutral (dotted) and oxidized (solid) complexes Cu12SMe2 and Cu12SiPr2[19] .
5.3. UV-Visible spectroscopy
UV-Visible (UV-Vis) spectra of neutral salen complexes typically contain a broad band of intense features near 25000 cm−1 (400 nm), arising from a combination of ligand-to-metal charge transfer (LMCT) and/or Schiff base π - π* transitions. Several d-d transitions are also observed near 20000 - 16000 cm−1 (500 - 600 nm). In complexes with reduced imine bonds, Schiff-base transitions are eliminated and features near 25000 cm−1 tend to exhibit much lower intensity (ε < 2000 M−1 cm−1 vs 10000 M−1 cm−1). In contrast to the neutral complexes, the spectral features of one- and two-electron oxidized complexes are dependent heavily on the substituents of the phenolates.
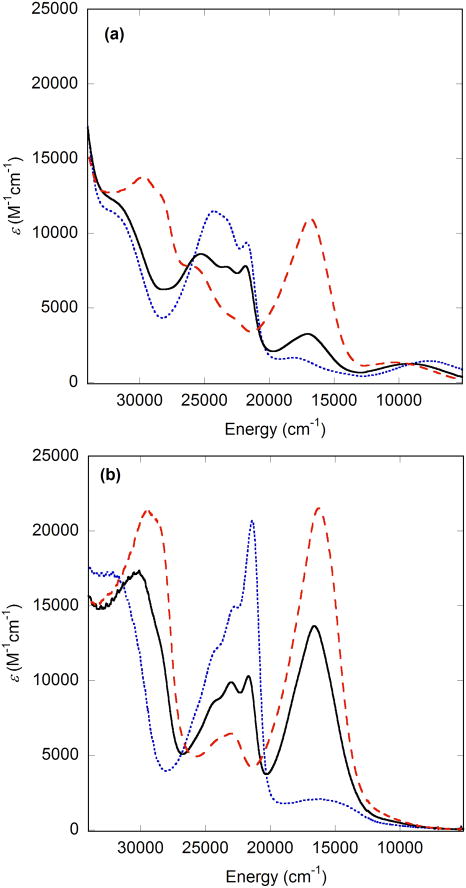
UV-Vis spectra of oxidized metal-salen complexes bearing -OMe and/or -SR substituents are dominated by intense absorptions near 22000 and/or 16000 cm−1 (ca. 450 and/or 600 nm), assigned to intra-ring methoxy-aryl π - π* or sulfur-aryl π - π* transitions, respectively. In non-symmetric complexes, sequential oxidation of the two phenolates is evident clearly by monitoring these substituent dependent absorptions [20,38]. For example, the spectrum of [Cu14SiPr,OMe]+ shows an intense feature near 22000 cm−1, assigned as a methoxy-aryl π - π* transition, and relatively little intensity in the region expected for a sulfur-aryl π - π* transition (Figure 9a). The -OMe bearing phenolate is oxidized more readily since this substituent is more electron donating. A subsequent oxidation to afford [Cu14SiPrOMe]2+ leads to the appearance of an additional feature near 16000 cm−1, consistent with oxidation of the -SiPr substituted phenolate (Figure 9b).
Figure 9.
(a) UV-Vis spectra of [Cu9]+ (blue), [Cu12SiPr2]+ (red), and [Cu14SiPr,OMe]+ (black); (b) UV-Vis spectra of [Cu9]2+ (blue), [Cu12SiPr2]2+ (red), and [Cu14SiPrOMe]2+ (black). Conditions; 0.1mM complex in CH2Cl2 at 298 K [20].
Spectrophotometric titration of Cu14tBu,SiPr with one equivalent of chemical oxidant leads to growth of a sulfur-aryl absorption near 16000 cm−1, the intensity of which does not change significantly following addition of a second oxidizing equivalent [20]. The removal of the second electron is assigned to the oxidation of the -tBu bearing phenolate, a change that contributes little to the optical spectrum in the visible range. Oxidized Mn-salen complexes bearing -OMe substituents display similar methoxy-aryl π -π* transitions near 22000 cm−1, suggesting that phenoxyl radicals are indeed generated upon oxidation and that different metal ions can lead to similar optical features [38].
5.4. Near-infrared spectroscopy
While UV-Vis transitions are useful for characterizing phenoxyl radical complexes, near-infrared (NIR) bands, attributed to phenolate-to-phenoxyl IVCT transitions, are often more diagnostic. While the presence of NIR transitions alone may suggest the formation of phenoxyl-radical complexes, a quantitative analysis of band-shape parameters provides a wealth of information regarding the mixed-valent nature and the degree of radical delocalization. In Class I systems, the electronic coupling coefficient (HAB) between the two redox centers is negligible, and no IVCT transition is observed [22]. Class II mixed-valent compounds typically display broad, weak IVCT transitions (Δv1/2 ≥ 2000 cm−1, ε ≤ 5000 M−1 cm−1), the energies of which are dependent on solvent dielectric [22]. Class III molecules have intense, narrow IVCT bands (Δv1/2 ≤ 2000 cm−1, ε ≥ 5000 M−1 cm−1), the energies of which are solvent independent, as no significant change in dipole moment results from electron transfer from the ground state to excited state. In the Class II regime, band-shape parameters and ΔvHTL (equation 1) are used to calculate HAB (equation 2).
The majority of Cu-salen phenoxyl radical complexes display Class II like behavior, regardless of phenolate substitution pattern. We have recently reported the band-shape analysis of a series of non-symmetric Cu-salen phenoxyl radical complexes ([Cu14R1,R2]+), the values of HAB for which average at 2100 ± 200 cm−1 despite the different functional groups and wide range of IVCT vmax values (Table 2). Similarly, all [Cu13R1,R2]+ complexes have HAB values centered at 1800 ± 200 cm−1.
Table 2.
IVCT analysis for [Cu13R1,R2]+ and [Cu14R1,R2]+ [20].
| complex | vmax (cm−1) | ε (M−1cm−1) | Δv1/2 (cm−1) | ΔvHTL (cm−1) | HAB (cm−1) |
|---|---|---|---|---|---|
| [Cu14tBu2]+ | 5700 | 2900 | 5600 | 3600 | 2300 |
| [Cu14tBu,OM2]+ | 8700 | 1400 | 5300 | 4500 | 1900 |
| [Cu14OMe2]+/ [Cu9]+ | 7800 | 1400 | 6200 | 4200 | 2000 |
| [Cu14OMe,SiPr]+ | 9300 | 1200 | 6300 | 4600 | 2000 |
| [Ci14SiPr2]+/ [Cu12SiPr]+ | 10200 | 1300 | 6200 | 4900 | 2200 |
| [Cu14tBu,SiPr]+ | 9300 | 1600 | 5800 | 4600 | 2200 |
| [Cu13tBu2]+ | 6300 | 2000 | 6200 | 3800 | 2100 |
| [Cu13tBu,OMe]+ | 9600 | 700 | 5400 | 4700 | 1500 |
| [Cu13OMe2]+ | 8300 | 1000 | 6200 | 4400 | 1700 |
| [Cu13OMe,SiPr]+ | 10500 | 900 | 5600 | 4900 | 1800 |
| [Cu13SiPr2]+ | 11200 | 900 | 6400 | 5100 | 2000 |
| [Cu13tBu,SiPr]+ | 10600 | 600 | 6900 | 4900 | 1600 |
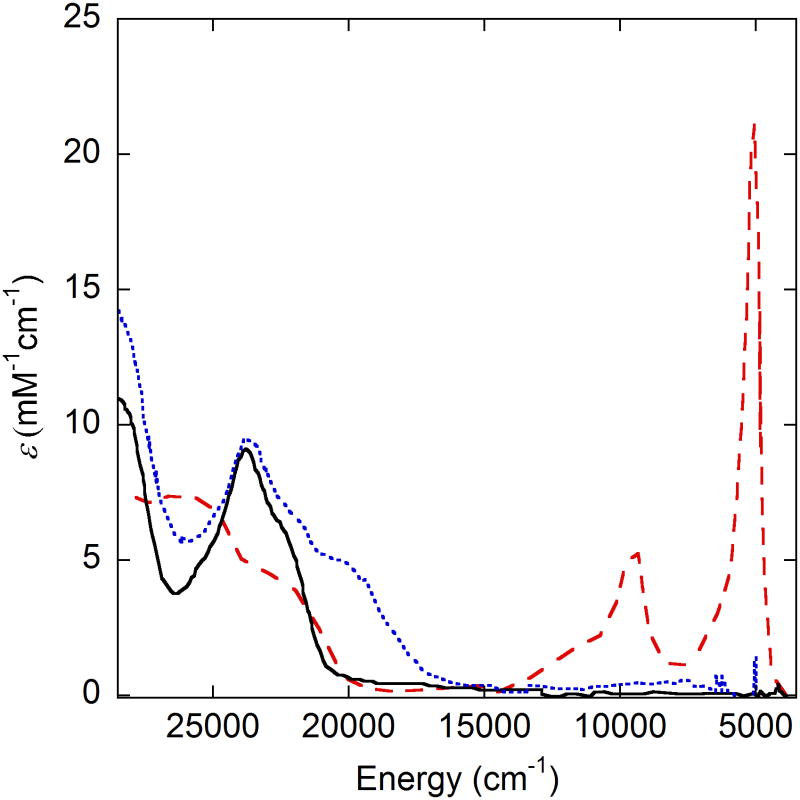
[Ni3]+ by contrast displays a very intense (ε = 21500 M−1 cm−1) and narrow transition at 4700 cm−1 (2100 nm), consistent with delocalization of the radical (consistent with DFT calculations) that suggests a Class III description with a NiII center and ligand radical (Figure 10) [40]. Upon addition of exogenous pyridine, this feature disappears, in line with EPR results that indicate the formation of a NiIII(py)2 species [37,40]. The palladium and platinum analogues of [Ni3]+ also show intense IVCT transitions in the NIR, the intensity of which increases in the order Pt > Ni > Pd, with the former two best described as Class III and [Pd3]+ best described as Class II (Figure 11) [43]. This coincides with the asymmetric quinoid-like crystal structure of [Pd3]+SbF6−[43].
Figure 10.
UV-Vis-NIR spectra of Ni3 (black), [Ni3]+ (red), and [Ni3]+(py)2 (blue). Conditions, 0.08 mM complex in CH2Cl2 at 298 K. [Ni3]+(py)2 in 1:1 CH2Cl2:pyridine [40].
Figure 11.
UV-Vis-NIR spectra of neutral (black) and one-electron oxidized (red) group 10 metal-salen series: (a) Ni, (b) Pd, (c) Pt. Conditions; 0.1 mM complex, CH2Cl2 at 298K [43].
The “half-reduced” complex Ni11, which differs only in a single imine to amine bond compared to Ni3, shows markedly different behavior. One-electron oxidation of Ni11 leads to formation of a Class II mixed valent species, as evidenced by the attenuation of the intensity of the NIR transition (ca. 2000 M−1 cm−1, Figure 12) [35]. Presumably, the radical is localized on the formerly more electron rich amino-phenolate, suggesting that ostensibly subtle ligand perturbations can lead to significant changes in the electronic properties of these complexes.
Figure 12.
UV-Vis-NIR of Ni11 (solid) and [Ni11]+ (dashed). Conditions, 0.08 mM complex in CH2Cl2 at 298 K [35].
Kurahashi and Fujii have investigated recently a series of non-symmetric manganese and nickel salen complexes. One-electron oxidation of these compounds results in the formation of phenoxyl radical complexes, with the hole localized on the phenolate that was originally more electron rich, as evidenced by the UV-Vis optical features. Interestingly, the energies of the IVCT transitions correlate directly to the electron donating/withdrawing properties of the phenolate substituents. For example, [Mn14OMe2]+ exhibits a broad IVCT transition at 7870 cm−1 (1270 nm), while [Mn14tBu,OMe]+ and [Mn14ClOMe]+ display IVCT transitions at 9850 cm−1 (1015 nm) and 11200 cm−1 (890 nm), respectively [38]. In all cases, the phenoxyl radical localizes on the -OMe bearing phenolate. A shift to higher energy observed for the IVCT bands of [Mn14tBu,OMe]+ and [Mn14ClOMe]+ relative to [Mn14OMe2]+ correlates to the electron withdrawing ability of the substituent on the unoxidized donor phenolate (−Cl > −tBu > −OMe) [38]. However, the IVCT transition energies of [Cu13R1,R2]+ and [Cu14R1,R2]+, bearing combinations of −tBu, −SiPr, and −OMe substituents, do not show a simple relationship to the electronic properties of the un-oxidized donor phenolate. This may suggest that the trend described by Kurahashi and Fujii is not general. In all observed cases, subsequent oxidation to form two-electron oxidized salen complexes results in the disappearance of NIR transitions, consistent with the formation of a bis-phenoxyl radical species lacking IVCT bands [20,29].
Kurahashi and coworkers previously reported the study of one- and two- electron oxidized iron(III) salen complexes that display interesting optical features. One-electron oxidation to afford a Fe(III)-phenoxyl radical complex (S = 2) results in broad absorptions near 12800 and 11000 cm−1 (780 and 870 nm) [52]. A second oxidation to yield the two-electron oxidized complex (S = 3/2) results in a doubling of intensity and red-shift of this feature to 10900 cm−1 (913 nm) [52]. No additional absorptions from 9000 – 4000 cm−1 (1100 – 2500 nm), the range expected for IVCT transitions in other metal-salen phenoxyl radical complexes, were observed for either the one- or two-electron oxidized complexes. Allard and coworkers reported the study of an N2O3 five-coordinate Fe(III) phenoxyl radical complex bearing a salen like ligand with a pendant phenolate arm axially coordinated to the iron center. One electron oxidation leads to localization of the phenoxyl radical on a single phenolate moiety, the identity of which varies depending on the nature of the ligand electronics [41]. Interestingly, both complexes studied show an absorption feature near 13000 cm−1 (750 nm), which is assigned as a high-energy IVCT transition [41].
5.5. EPR spectroscopy
Neutral CuII-salen complexes (d9 ground state) are paramagnetic compounds that can be characterized by EPR spectroscopy. Generally speaking, X-band EPR spectra of frozen solutions of CuII-salen complexes display axial or rhombic signals, characteristic of monomeric, nearly planar complexes, with a dx2-y2 ground state.
One-electron oxidation of CuII-salen complexes leads to various spectral changes, depending on the phenolate substitution pattern of the complexes. Upon oxidation, EPR signals for complexes bearing −tBu substituents, such as Cu3 and Cu4, are attenuated substantially, suggesting the formation of (1) a diamagnetic CuIII-phenolate species (d8), (2) an anti-ferromagnetically coupled CuII-phenoxyl species, analogous to GOox, or (3) a ferromagnetic species with a large zero-field splitting parameter. It has been confirmed that case (1) applies to [Cu3]+ at low temperatures while case (3) applies to complex [Cu4]+ using other spectroscopic and theoretical methods [20,29,46]. Orio and coworkers have calculated a zero-field splitting parameter of 0.72 cm−1 for complex [Cu9]+, a result that is consistent with the X-band EPR silence observed experimentally because the operating microwave frequency is typically on the order of 0.3 cm−1 [45]. Because dramatically different spin configurations can all lead to EPR silence, conclusions drawn for oxidized CuII-salen complexes should be carefully analyzed by integrating additional information from other spectroscopic or physical measurements.
Bulk magnetic susceptibility techniques can aid in clarifying ambiguous EPR measurements. Variable-temperature SQUID magnetometry can be applied to oxidized metal-salen complexes that are isolable as stable solids [46]. To date, these samples are generally limited to complexes containing imino-phenolate moieties, which tend to be more stable than their amino-phenolate partners upon oxidation. Variable temperature solution magnetic susceptibility measurements by Evan's method can be applied to a wider range of oxidized metal-salen complexes [46].
Oxidized complexes bearing alkyl-sulfanyl substituents show markedly different X-band EPR behavior. One-electron oxidation does not result in a loss of EPR intensity, rather, the signals broaden and the integration relative to their parent neutral forms remains relatively constant [19,20]. It is postulated that the larger inter-spin distance afforded by significant delocalization of the hole onto the sulfur atom(s) in the para position of the phenolates, leads to weaker electron-electron coupling to the copper center and a more diradical character [53].
EPR characterization of oxidized Ni-Salen complexes is often times straightforward because of the limited spin configurations. The EPR spectrum of [Ni3]+ shows a broad signal attributed to an S = ½ species at giso = 2.045, suggesting a predominantly ligand based unpaired electron (Figure 13) [40]. Shimazaki et al. investigated the temperature dependence of the locus of oxidation in [Ni3]+, using variable temperature EPR [39]. Cooling the sample shifts the oxidation locus from the ligand to the nickel center, which presumably results from counter-anion (NO3−) binding at lower temperatures rather than a purely temperature dependent radical shift [37,39,40]. Interestingly, addition of 3 equivalents of exogenous pyridine (Py) to [Ni3]+SbF6− results in a rhombic EPR pattern, characteristic of a low-spin NiIII complex with a dz2 electronic ground state [40]. In contrast to this result, Pierre and coworkers have reported that complex [Ni7]+ exists as a phenoxyl radical anti-ferromagnetically coupled to a high-spin NiII center in an octahedral-like environment, a configuration that results in an isotropic EPR signal at g = 2.22 [37].
Figure 13.
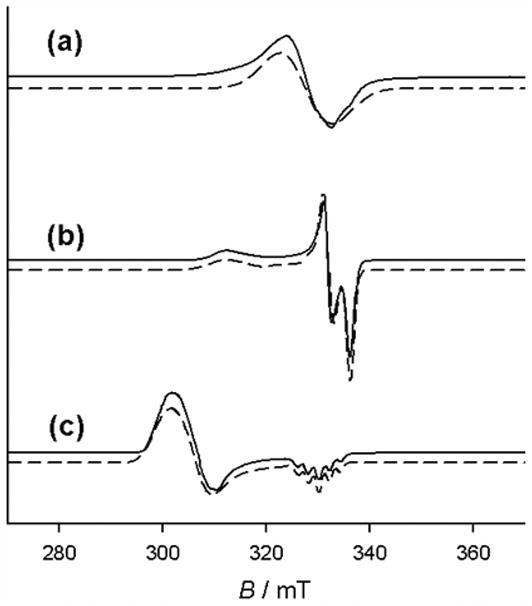
X-band EPR spectra (solid: data; dashed: simulations) of (a) 1 mM [Ni3]+ , (b) 1 mM [Ni3]+ + 0.1 M tetrabutylammonium perchlorate, (c) 1 mM [Ni3]+ + 2 eq. pyridine. Conditions, 1 mM complex in frozen CH2Cl2 at 77 K [40].
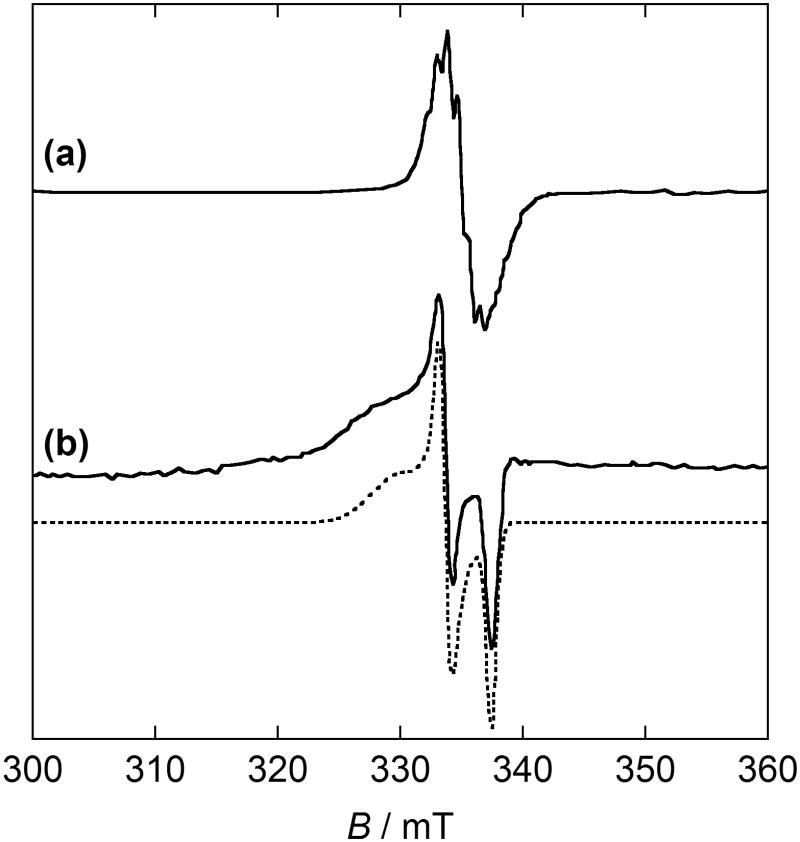
In a recent report by Kochem and coworkers, the effect of ligand protonation on the locus of oxidation in complex Ni10 was investigated. The frozen solution EPR spectrum of [Ni10]+ in CH2Cl2 exhibits a nearly isotropic signal centered at giso ≈ 2.01, the hyperfine splitting of which is consistent with a ligand radical localized on the N,N-dimethylamino phenolate with significant radical character on the nitrogen atom (Figure 14) [54]. In contrast to this result, the frozen solution EPR spectrum of [Ni10H]2+ in CH2Cl2 displays a highly anisotropic S = ½ signal at g1 = 1.994, g2 = 2.017,and g3 ≈ 2.045 (giso ≈ 2.02) [54]. These g-values are in good agreement with those calculated by DFT for a radical localized on the di-tert-butyl substituted phenolate, suggesting that protonation of the N,N-dimethylamino results in a chemically induced oxidation locus shift [54].
Figure 14.
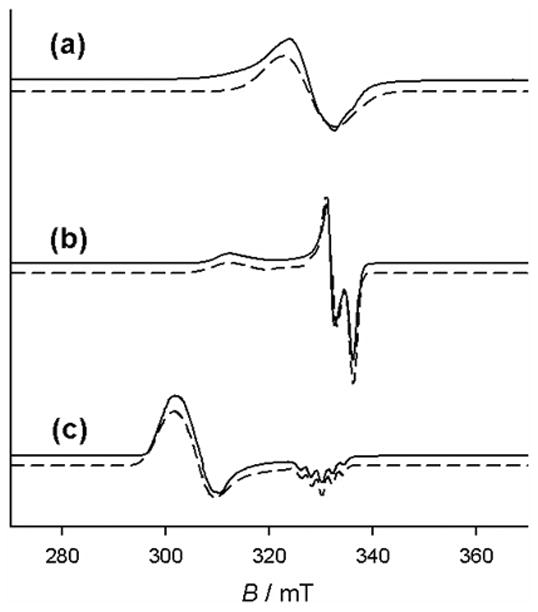
X-band EPR spectra of (a) [Cu10]+ and (b) [Cu10H]2+. Conditions, 1 mM complex and 0.1 M tetrabutylammonium perchlorate in frozen CH2Cl2 at 77 K [54].
5.6. Electrochemistry
Results from cyclic voltammetry (CV) and/or differential pulse voltammetry (DPV) provide keen insights into the nature of metal-salen complex oxidation. In most cases, results indicate that complexes display two phenolate-based oxidation processes at potentials near or greater to the Fc0/+ redox couple, with reduced salen complexes exhibiting oxidation potentials ca. 350 mV lower than complexes containing imino-phenolates. When considering symmetric salen complexes, the difference in potential between sequential oxidations is often correlated to the extent of radical delocalization in the one-electron oxidized complexes. The mixed valent mono-cations, [MX]+, exist in equilibrium with their neutral and dicationic forms in solution, with the comproportionation constant Kc equal to log Kc = (ΔE / 59 mV) at 298 K. ΔE values larger than the statistical value of 36 mV, corresponding to a Kc = 4, imply thermodynamic stabilization of the one electron oxidized species through delocalization of the radical, or in other words, electronic coupling.
In non-symmetric complexes, a thermodynamic preference for oxidation of one phenolate over the other exists, and the electrochemical splitting between the first and second redox process is a combination of this thermodynamic difference and the magnitude of electronic coupling in the one-electron oxidized species [20]. In non-symmetric manganese and nickel complexes reported by Kurahashi and Fujii, the observed electrochemical features are often correlated to the substitution patterns of the redox active phenolates (Table 3). For complexes bearing -OMe substituents, the first anodic peak potentials remain relatively constant, increasing slightly as more electron withdrawing substituents are introduced on the other phenolate. This is consistent with preferential oxidation of the -OMe bearing phenolate. A similar trend is also observed for non-symmetric copper salen complexes [20].
Table 3.
Substituent dependent redox potentials [38].
| Complex | E° (V) (vs Fc/Fc+) |
|---|---|
| Mn14OMe2 | 0.51 |
| Mn14tBu,OMe | 0.52 |
| Mn14CI,OMe | 0.56 |
| Ni14OMe2 | 0.26 |
| Ni14tBu,OMe | 0.28 |
| Ni14CI,OMe | 0.31 |
5.7. Resonance Raman spectroscopy
Resonance Raman spectroscopy (rR) is another precise tool for studying phenoxyl radical species. The rR spectra of GOox obtained with 875 nm excitation by McGlashen et al. exhibits bands attributed to both unoxidized Tyr495 and tyrosyl radical Tyr272 (Figure 15) [55]. The band observed at 1487 cm−1 is ca. 30 cm−1 lower in energy than expected for a tyrosinate C - O v7a stretch, consistent with coordination of a tyrosyl O atom to the CuII metal center. Bands at 1479, 1595, and 1185 cm−1 are slightly higher than those anticipated for ring modes v8b, v8a, and v9a, consistent with a quinoid-like structure of a tyrosyl radical ring. Since these phenoxyl radical vibrations are enhanced by excitation at 875 nm, it is postulated that this region in the absorption spectrum of the enzyme is attributed to a tyrosine-to-tyrosyl IVCT transition [55].
Figure 15.
Resonance Raman (rR) spectra of GOox (λex = 875 nm) [55].
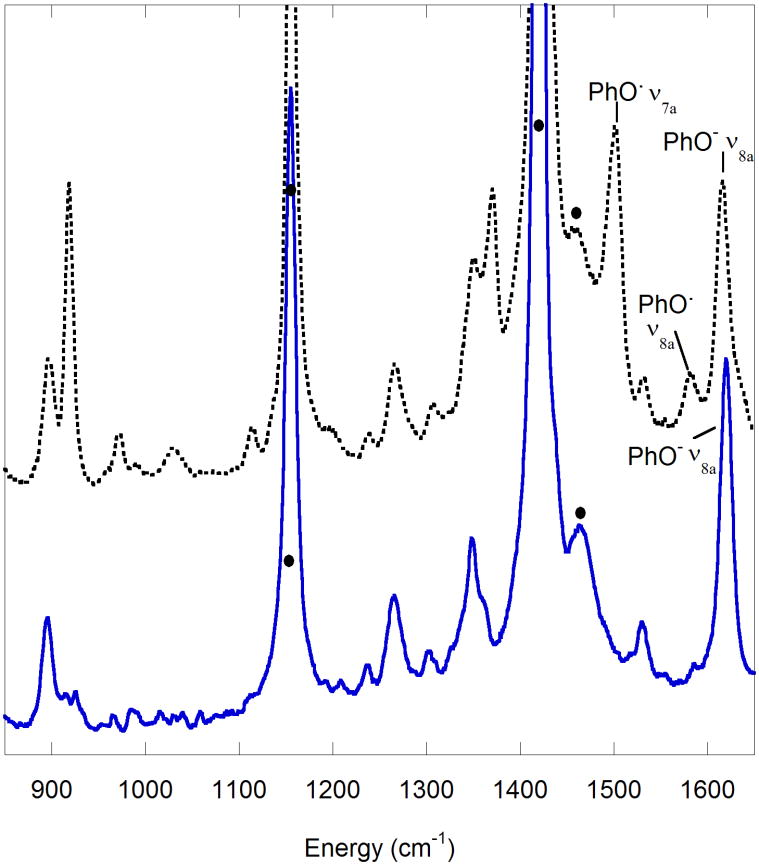
Phenoxyl radical salen complexes have also been successfully characterized using rR spectroscopy with excitation in the visible range. [Cu4]+ exhibits vibrations at 1495 and 1597 cm−1 with excitation at 413 nm (Figure 16). Interestingly, the presence of both phenoxyl and phenolate bands for [Cu4]+ may indicate localization of the phenoxyl radical on a single phenolate on the timescale of the Raman experiment [46]. In contrast, [Cu3]+ displays bands at 1530 and 1598 cm−1 that do not correlate with the expected pattern for a phenoxyl radical species, consistent with the formation of a CuIII-bis-phenolate complex upon oxidation at the low temperatures of the experiment. Similar to [Cu4]+, [Ni11]+ displays rR features that can be assigned as phenolate and phenoxyl radical vibrations, consistent with NIR spectroscopic results that suggest [Ni11]+ exists as a localized phenoxyl radical complex (Class II, Figure 17) [35]. Shimazaki and coworkers have reported rR for neutral and oxidized Ni3; the presence of bands at 1504 and 1605 cm−1 in the rR spectrum of [Ni3]+ suggests this species exists as a phenoxyl radical and are assigned as v7a and v8a vibrational modes, respectively [48].
Figure 16.
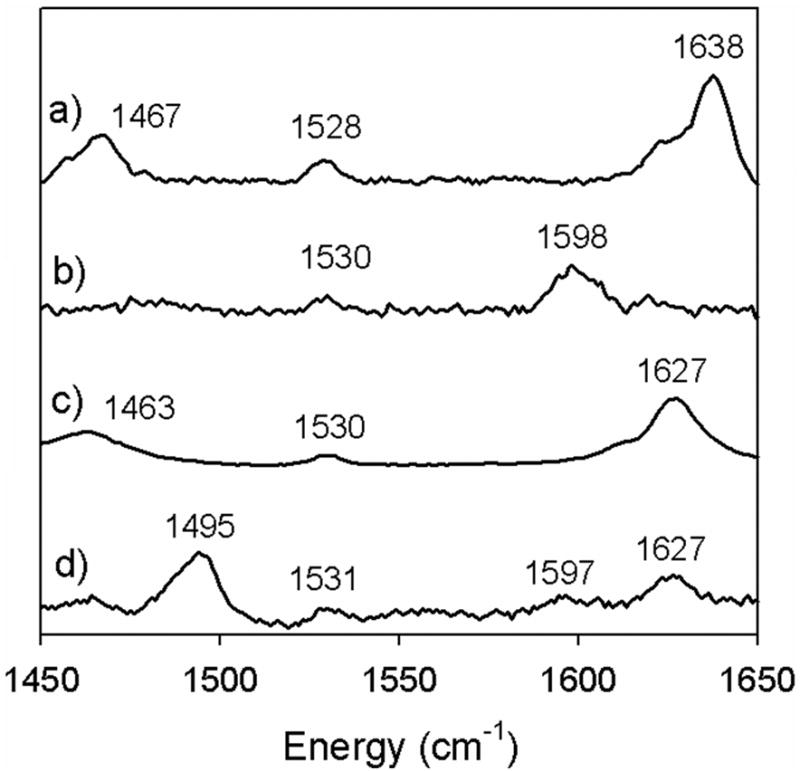
Resonance Raman (rR) spectra of (a) Cu3, and (b) [Cu3]+ at 298 K; rR spectra of (c) Cu4 and (d) [Cu4]+ at 213 K (λex = 413 nm). Conditions, 1 mM complex in CH2Cl2 [46].
Figure 17.
Resonance Raman of Ni11 (solid) and [Ni11]+ (dashed) in CH2Cl2 at 213 K (λex = 413 nm). Solvent = • Conditions, 1 mM in CH2Cl2 at 213 K [35].
6. Conclusion
The greater realized role of tyrosyl and modified tyrosyl radicals in biological systems has lead to the development of numerous model systems to help elucidate their direct and indirect role in catalysis. Oxidized metal-salen complexes have proven to be useful models of GOox as similar spectroscopic features and patterns of reactivity are found. Developments in synthetic methodology have diversified the scope of salen ligands, enabling a fine tuning of the electronics of the phenoxyl radical complexes and construction of small-molecule analogues that reproduce the electronic asymmetry afforded by the Cys-Tyr cross link in GO. A variety of spectroscopic techniques can be used to probe the locus of oxidation and degree of radical delocalization in these mixed-valent one-electron oxidized compounds. In particular, study of IVCT transitions has contributed significantly to the understanding of the electronic distribution in these systems and provides a starting point for quantitative assessment of GOox as a mixed-valent species. The coupling of spectroscopic and electrochemical techniques with experimentally calibrated DFT methods provides even greater insights. Our understanding of the low energy absorption features of GOox is incomplete however, and further study of model systems and the enzyme itself is necessary to fully realize the role of the tyrosyl radical in enzymatic activity.
Highlights.
We discuss metal-salen phenoxyl radical complexes in the context of galactose oxidase modeling
Synthetic strategies for tuning electronic properties of salen ligands are discussed
Emphasis is placed on spectroscopic and electrochemical characterization of phenoxyl radical complexes as mixed-valent species along with a Marcus-Hush analysis of their intervalence charge transfer bands
Acknowledgments
We dedicate this review to Professor E.I. Solomon in his 65th year.
Abbreviations
- GO
galactose oxidase
- GOox
oxidized galactose oxidase
- IVCT
intervalence charge transfer
- NIR
near-infrared
- Th+
thianthrenyl radical
- XAS
X-ray absorption spectroscopy
- SUMO
singly unoccupied molecular orbital
- DFT
density functional theory
- EPR
electron paramagnetic resonance
- SQUID
superconducting quantum interference device
- UV
ultraviolet
- Vis
visible
- LMCT
ligand-to-metal charge transfer
- S
total spin state
- g
g-value
- CV
cyclic voltammetry
- DPV
differential pulse voltammetry
- Kc
comproportionation constant
- rR
resonance Raman
Footnotes
Publisher's Disclaimer: This is a PDF file of an unedited manuscript that has been accepted for publication. As a service to our customers we are providing this early version of the manuscript. The manuscript will undergo copyediting, typesetting, and review of the resulting proof before it is published in its final citable form. Please note that during the production process errors may be discovered which could affect the content, and all legal disclaimers that apply to the journal pertain.
References
- 1.Fontecave M, Nordlund P, Eklund H, Reichard P. Adv Enzymol Relat Areas Mol Biol. 1992;65:147–183. doi: 10.1002/9780470123119.ch4. [DOI] [PubMed] [Google Scholar]
- 2.Stubbe J. Adv Enzymol Relat Areas Mol Biol. 1990;63:349–419. doi: 10.1002/9780470123096.ch6. [DOI] [PubMed] [Google Scholar]
- 3.Stubbe J, van der Donk WA. Chem Rev. 1998;98:705–762. doi: 10.1021/cr9400875. [DOI] [PubMed] [Google Scholar]
- 4.Frey PA, Hegeman AD, Reed GH. Chem Rev. 2006;106:3302–3316. doi: 10.1021/cr050292s. [DOI] [PubMed] [Google Scholar]
- 5.Barry BA, Babcock GT. Proc Natl Acad Sci. 1987;84:7099–7103. doi: 10.1073/pnas.84.20.7099. [DOI] [PMC free article] [PubMed] [Google Scholar]
- 6.Debus RJ. Biochim Biophys Acta. 1992;1102:269–352. doi: 10.1016/0005-2728(92)90133-m. [DOI] [PubMed] [Google Scholar]
- 7.Chen YR, Gunther MR, Mason RP. J Biol Chem. 1999;274:3308–3314. doi: 10.1074/jbc.274.6.3308. [DOI] [PubMed] [Google Scholar]
- 8.MacMillan F, Kannt A, Behr J, Prisner T, Michel H. Biochemistry. 1999;38:9179–9184. doi: 10.1021/bi9911987. [DOI] [PubMed] [Google Scholar]
- 9.Whittaker MM, Kersten PJ, Nakamura N, SandersLoehr J, Schweizer ES, Whittaker JW. J Biol Chem. 1996;271:681–687. doi: 10.1074/jbc.271.2.681. [DOI] [PubMed] [Google Scholar]
- 10.Whittaker JW. Metal Ions in Biological Systems. 1994;30(30):315–360. [PubMed] [Google Scholar]
- 11.Whittaker JW. Chem Rev. 2003;103:2347–2363. doi: 10.1021/cr020425z. [DOI] [PubMed] [Google Scholar]
- 12.Rogers MS, Dooley DM. Curr Opin Chem Biol. 2003;7:189–196. doi: 10.1016/s1367-5931(03)00024-3. [DOI] [PubMed] [Google Scholar]
- 13.Firbank SJ, Rogers MS, Wilmot CM, Dooley DM, Halcrow MA, Knowles PF, McPherson MJ, Phillips SEV. Proc Natl Acad Sci. 2001;98:12932–12937. doi: 10.1073/pnas.231463798. [DOI] [PMC free article] [PubMed] [Google Scholar]
- 14.Ito N, Phillips SEV, Yadav KDS, Knowles PF. J Mol Biol. 1994;238:794–814. doi: 10.1006/jmbi.1994.1335. [DOI] [PubMed] [Google Scholar]
- 15.Hockertz J, Steenken S, Wieghardt K, Hildebrandt P. J Am Chem Soc. 1993;115:11222–11230. [Google Scholar]
- 16.Jazdzewski BA, Tolman WB. Coord Chem Rev. 2000;200:633–685. [Google Scholar]
- 17.Thomas F. Eur J Inorg Chem. 2007:2379–2404. [Google Scholar]
- 18.Shimazaki Y, Yamauchi O. Indian Journal of Chemistry Section a-Inorganic Bio-Inorganic Physical Theoretical & Analytical Chemistry. 2011;50:383–394. [Google Scholar]
- 19.Verma P, Pratt RC, Storr T, Wasinger EC, Stack TDP. Proc Natl Acad Sci. 2011;108:18600–18605. doi: 10.1073/pnas.1109931108. [DOI] [PMC free article] [PubMed] [Google Scholar]
- 20.Pratt RC, Lyons CT, Wasinger EC, Stack TDP. J Am Chem Soc. 2012;134:7367–7377. doi: 10.1021/ja211247f. [DOI] [PMC free article] [PubMed] [Google Scholar]
- 21.Al-Noaimi M, Yap GPA, Crutchley RJ. Inorg Chem. 2004;43:1770–1778. doi: 10.1021/ic0349454. [DOI] [PubMed] [Google Scholar]
- 22.D'Alessandro DM, Keene FR. Chem Soc Rev. 2006;35:424–440. doi: 10.1039/b514590m. [DOI] [PubMed] [Google Scholar]
- 23.Robin MB, Day P. Adv Inorg Chem Rad. 1967;10:247. [Google Scholar]
- 24.Brunschwig BS, Creutz C, Sutin N. Chem Soc Rev. 2002;31:168–184. doi: 10.1039/b008034i. [DOI] [PubMed] [Google Scholar]
- 25.Pfeiffer P, Breith E, Lubbe E, Tsumaki T. Justus Liebigs Annalen Der Chemie. 1933;503:84–130. [Google Scholar]
- 26.Cozzi PG. Chem Soc Rev. 2004;33:410–421. doi: 10.1039/b307853c. [DOI] [PubMed] [Google Scholar]
- 27.Baleizao C, Garcia H. Chem Rev. 2006;106:3987–4043. doi: 10.1021/cr050973n. [DOI] [PubMed] [Google Scholar]
- 28.Saint-Aman E, Ménage S, Pierre JL, Defrancq E, Gellon G. New J Chem. 1998;22:393–394. [Google Scholar]
- 29.Pratt RC, Stack TDP. J Am Chem Soc. 2003;125:8716–8717. doi: 10.1021/ja035837j. [DOI] [PubMed] [Google Scholar]
- 30.Thomas F, Jarjayes O, Duboc C, Philouze C, Saint-Aman E, Pierre JL. Dalton Trans. 2004:2662–2669. doi: 10.1039/b406009a. [DOI] [PubMed] [Google Scholar]
- 31.Yao HH, Lo JM, Chen BH, Lu TH. Acta Crystallographica Section C-Crystal Structure Communications. 1997;53:1012–1013. [Google Scholar]
- 32.Wang YD, DuBois JL, Hedman B, Hodgson KO, Stack TDP. Science. 1998;279:537–540. doi: 10.1126/science.279.5350.537. [DOI] [PubMed] [Google Scholar]
- 33.Campbell EJ, Nguyen ST. Tetrahedron Lett. 2001;42:1221–1225. [Google Scholar]
- 34.Wang Y, Stack TDP. J Am Chem Soc. 1996;118:13097–13098. [Google Scholar]
- 35.Storr T, Verma P, Shimazaki Y, Wasinger EC, Stack TDP. Chem Eur J. 2010;16:8980–8983. doi: 10.1002/chem.201001401. [DOI] [PMC free article] [PubMed] [Google Scholar]
- 36.Connelly NG, Geiger WE. Chem Rev. 1996;96:877–910. doi: 10.1021/cr940053x. [DOI] [PubMed] [Google Scholar]
- 37.Rotthaus O, Thomas F, Jarjayes O, Philouze C, Saint-Aman E, Pierre JL. Chem Eur J. 2006;12:6953–6962. doi: 10.1002/chem.200600258. [DOI] [PubMed] [Google Scholar]
- 38.Kurahashi T, Fujii H. J Am Chem Soc. 2011;133:8307–8316. doi: 10.1021/ja2016813. [DOI] [PubMed] [Google Scholar]
- 39.Shimazaki Y, Tani F, Fukui K, Naruta Y, Yamauchi O. J Am Chem Soc. 2003;125:10512–10513. doi: 10.1021/ja035806o. [DOI] [PubMed] [Google Scholar]
- 40.Storr T, Wasinger EC, Pratt RC, Stack TDP. Angew Chem Int Ed. 2007;46:5198–5201. doi: 10.1002/anie.200701194. [DOI] [PubMed] [Google Scholar]
- 41.Allard MM, Sonk JA, Heeg MJ, McGarvey BR, Schlegel HB, Verani CN. Angew Chem Int Ed. 2012;51:3178–3182. doi: 10.1002/anie.201103233. [DOI] [PubMed] [Google Scholar]
- 42.Sokolowski A, Bothe E, Bill E, Weyhermüller T, Wieghardt K. Chem Commun. 1996:1671–1672. [Google Scholar]
- 43.Shimazaki Y, Stack TDP, Storr T. Inorg Chem. 2009;48:8383–8392. doi: 10.1021/ic901003q. [DOI] [PMC free article] [PubMed] [Google Scholar]
- 44.Shimazaki Y, Arai N, Dunn TJ, Yajima T, Tani F, Ramogida CF, Storr T. Dalton Trans. 2011;40:2469–2479. doi: 10.1039/c0dt01574a. [DOI] [PubMed] [Google Scholar]
- 45.Orio M, Jarjayes O, Kanso H, Philouze C, Neese F, Thomas F. Angew Chem Int Ed. 2010;49:4989–4992. doi: 10.1002/anie.201001040. [DOI] [PubMed] [Google Scholar]
- 46.Storr T, Verma P, Pratt RC, Wasinger EC, Shimazaki Y, Stack TDP. J Am Chem Soc. 2008;130:15448–15459. doi: 10.1021/ja804339m. [DOI] [PMC free article] [PubMed] [Google Scholar]
- 47.Kochem A, Jarjayes O, Baptiste B, Philouze C, Vezin H, Tsukidate K, Tani F, Orio M, Shimazaki Y, Thomas F. Chem Eur J. 2012;18:1068–1072. doi: 10.1002/chem.201102882. [DOI] [PubMed] [Google Scholar]
- 48.Shimazaki Y, Yajima T, Tani F, Karasawa S, Fukui K, Naruta Y, Yamauchi O. J Am Chem Soc. 2007;129:2559–2568. doi: 10.1021/ja067022r. [DOI] [PubMed] [Google Scholar]
- 49.Martin-Diaconescu V, Kennepohl P. J Am Chem Soc. 2007;129:3034. doi: 10.1021/ja0676760. [DOI] [PubMed] [Google Scholar]
- 50.Rokhsana D, Howells AE, Dooley DM, Szilagyi RK. Inorg Chem. 2012;51:3513–3524. doi: 10.1021/ic2022769. [DOI] [PubMed] [Google Scholar]
- 51.Lee YK, Whittaker MM, Whittaker JW. Biochemistry. 2008;47:6637–6649. doi: 10.1021/bi800305d. [DOI] [PMC free article] [PubMed] [Google Scholar]
- 52.Kurahashi T, Kobayashi Y, Nagatomo S, Tosha T, Kitagawa T, Fujii H. Inorg Chem. 2005;44:8156–8166. doi: 10.1021/ic051377e. [DOI] [PubMed] [Google Scholar]
- 53.Rajca A. Chem Rev. 1994;94:871–893. [Google Scholar]
- 54.Kochem A, Orio M, Jarjayes O, Neese F, Thomas F. Chem Commun. 2010;46:6765–6767. doi: 10.1039/c0cc01775b. [DOI] [PubMed] [Google Scholar]
- 55.McGlashen ML, Eads DD, Spiro TG, Whittaker JW. J Phys Chem. 1995;99:4918–4922. [Google Scholar]


