Abstract
♦ Background: Standard peritoneal dialysis (PD) solutions contain high levels of glucose and glucose degradation products (GDPs), both contributing to the formation of advanced glycation end products (AGEs). We studied the contribution to plasma GDP and AGE levels of 2 PD regimens that differ in glucose and GDP loads: high load [standard PD (sPD) using 4 glucose–lactate exchanges] and low load [1 amino acid exchange, 1 icodextrin exchange, and 2 glucose–bicarbonate/lactate exchanges (“NEPP”)].
♦ Methods: In a prospective crossover study (2 periods of 24 weeks), new continuous ambulatory PD patients were randomized to NEPP–sPD (n = 23) or to sPD–NEPP (n = 27).
♦ Results: After the start of PD, absolute increases were observed in plasma levels of 3-deoxyglucosone (3-DG, 220.4 nmol/L, p < 0.0001) and in Nε-(carboxymethyl) lysine (CML) in plasma proteins (0.02 μmol/L CML per 1 mol/L lysine, p < 0.0001). During the first 6 weeks, 3-DG tended to increase more with sPD treatment (p = 0.08), and CML, with NEPP treatment (p = 0.002). In both groups, Nε-(carboxyethyl)lysine (CEL) in plasma proteins declined significantly with the start of PD. Treatment with NEPP resulted in higher levels of methylglyoxal (MGO) and lower levels of 3-DG and CEL. Pentosidine in the albumin fraction tended to increase less during NEPP treatment.
♦ Conclusions: A low glucose and GDP PD regimen (NEPP) resulted in plasma levels of 3-DG and CEL that were lower than those with a glucose-based sPD regimen. Starting PD with NEPP was associated with a steeper increase in CML, and continuing treatment with NEPP resulted in higher MGO levels.
Keywords: Advanced glycation end products, amino acids, glucose degradation products, icodextrin
Eight years after the start of peritoneal dialysis (PD), up to 85% of patients have stopped PD therapy because of technique failure or death (1,2). In about 50% of deaths, mortality is the result of a cardiovascular event (3). This high cardiovascular risk cannot be fully explained by traditional risk factors such as diabetes, dyslipidemia, and hypertension (4). Interest is therefore increasing in several putative risk factors for accelerated atherosclerosis in PD patients such as formation of advanced glycation end products (AGEs) (5), oxidative stress, endothelial dysfunction, and inflammation.
Advanced glycation end products can be formed through a series of nonenzymatic reactions between a free amino acid group on a protein or lipid and glucose or glucose degradation products (GDPs). Accumulation of AGE is associated with advancing age in the general population, but it also occurs earlier in life at an accelerated rate in the presence of diabetes or chronic renal failure (6). In patients on PD, several factors facilitate or induce AGE formation. First, chronic exposure to standard glucose–lactate PD solutions leads to an increase in precursor molecules for AGE formation because those fluids contain high levels of glucose and GDPs (7), the latter generated by spontaneous breakdown of glucose during heat sterilization. Second, the uremic milieu, inevitably present in PD patients, is associated with high levels of carbonyl stress (8), necessary for an increased rate of AGE formation. Finally, loss of residual renal function results in reduced clearance of AGEs (9).
It has been demonstrated that intraperitoneal exposure to glucose and GDPs, a consequence of applying PD, is not only associated with AGE formation in the peritoneum (10) but also with increases in plasma GDP levels (11) and plasma AGE fluorescence (12–14). The rapid disappearance of GDPs from a dwell suggests that absorbed GDPs cause higher systemic GDP levels, which, for their part, increase systemic AGE formation.
To reduce the unfavorable effects of standard glucose–lactate PD fluids, new PD fluids have been developed. Fluids containing icodextrin or amino acids as the osmotic agent instead of glucose have a very low GDP content (15). Unfortunately, these fluids can be administered once daily at most. Lower GDP levels can also be attained in PD fluids using a two-compartment bag that stores glucose at a very low pH during the sterilization process, reducing GDP formation.
A large reduction in the 24-hour glucose and GDP load can be achieved by designing new, more biocompatible PD regimens exclusively consisting of the 3 alternative PD solutions: icodextrin, amino acids, and glucose in two-compartment bags. We studied the effects on systemic levels of AGEs and GDPs of such a regimen (“NEPP”) compared with a standard regimen of glucose–lactate fluid (“sPD”). The clinical effects of these regimens have already been reported (16,17). In the present report, we focus on GDPs and systemic AGE levels in plasma proteins.
METHODS
STUDY DESIGN
A detailed description of the design was previously reported (16). In summary, we conducted an open multicenter randomized crossover study in 74 new continuous ambulatory PD (CAPD) patients. Patients were randomized to 1 of 2 treatment groups: a NEPP–sPD group that started on NEPP and switched to sPD at the mid-point of the study period, and a sPD–NEPP group that started on sPD and switched to NEPP.
The first 6 weeks were used to stabilize the patients on their initial regimen and to teach them how to perform CAPD. The patients were subsequently treated with both PD regimens during 2 study periods of 24 weeks each. The NEPP regimen consisted of 2 exchanges of bicarbonate/lactate–buffered glucose-based PD solution (Physioneal: Baxter Healthcare BV, Utrecht, Netherlands), 1 exchange of amino-acid solution (Nutrineal: Baxter Healthcare BV), and 1 exchange of icodextrin solution (Extraneal: Baxter Healthcare BV) for the overnight dwell. The sPD regimen consisted of 4 exchanges of a lactate-buffered glucose-based PD solution (Dianeal: Baxter Healthcare BV).
Patients attended clinical visits every 6 weeks. Blood samples were taken before the initiation of CAPD (0 weeks) and at 6, 30, and 54 weeks thereafter; 24-hour dialysate was collected at 6, 30, and 54 weeks. The relevant medical ethics committees approved the study, and written informed consent was obtained from all patients.
GLUCOSE AND GDP LOAD
At each visit, the patient’s treatment schedule was registered. Glucose load was calculated by multiplying the amount of fluid administered by the glucose concentration stated by the manufacturer of the particular PD fluid. The GDP load was similarly calculated by multiplying the amount of intraperitoneally administered PD fluid by the GDP concentrations in that fluid type as previously reported (15). Because the present study showed that Dianeal and Physioneal contain different amounts of GDPs in the presence of equal glucose concentrations, estimated GDP and glucose loads could be analyzed as independent characteristics of the PD regimen applied.
BLOOD SAMPLES AND 24-HOUR DIALYSATE COLLECTIONS
Following the study protocol, blood samples were drawn by venous puncture in the morning at the end of the overnight dwell before the first daytime exchange. Disodium ethylenediaminetetraacetic acid was used as the anticoagulant. For the determination of systemic levels of the GDPs 3-deoxyglucosone (3-DG), methylglyoxal (MGO), and glyoxal (GO), blood samples (0.5 mL) were immediately added to vials containing 0.5 mL perchloric acid (1.2 mol/L); the samples were then homogenized and stored at –80°C until analysis.
Patients were asked to collect all dialysate bags from the preceding 24 hours. Total protein levels were measured in this 24-hour collection.
MATERIALS
Fresh preparations of MGO and 3-DG were compounded as previously described (7). The GO was obtained from Sigma Chemical (St. Louis, MO, USA). Gradient-grade ethanol (LiChrosolv) was obtained from Merck (Darmstadt, Germany); high-performance liquid chromatography (HPLC)–grade acetonitrile (Hipersolv), from BDH (Poole, UK); and 1,2-diamino-4,5-dimethoxybenzene, from Molecular Probes (Eugene, OR, USA).
Determination of 3-DG, GO, and MGO by Reverse-Phase HPLC After Derivatization to Their Dimethoxyquinoxaline Adducts: The acidified samples were centrifuged (10 minutes, g3000), and an aliquot of supernatant was adjusted to pH 7.0 by adding 0.5 volumes of K3PO4 (1.2 mol/L). After centrifugation (10 minutes, g3000), 50 μL of each sample was mixed with an equal amount of potassium phosphate buffer (0.2 mol/L, pH 7.0), 75 μL ethanol, and 20 μL freshly prepared derivatization reagent (20 mmol/L 1,2-diamino-4,5-dimethoxybenzene dissolved in 10 mmol/L HCl). The mixtures were incubated at ambient temperature for at least 4 hours, and then were analyzed by HPLC. The HPLC equipment consisted of an Alliance model 2690 Separations Module and a model 474 fluorescence detector (Waters, Milford, MA, USA). Millennium 3.05 software was used for data acquisition and processing.
The 3-DG was analyzed on two C-18 Waters Symmetry columns (5 μm, 3.9×150 mm) protected by a guard column containing the same stationary phase with gradient elution. Mobile phase A was a mixture of 10 mmol/L potassium phosphate buffer (pH 3.5) and acetonitrile (90/10 volume:volume) and mobile phase B consisted of a mixture of acetonitrile and water (50/50 volume:volume). Samples (10 μL) were injected, and separation was performed with a linear gradient from 0% to 15% mobile phase B over 25 minutes. After a wash step for 5 minutes with 100% B, the gradient was returned to initial conditions, and the column was equilibrated for 5 minutes before injection of the next sample. The flow rate was 0.9 mL/min, and fluorescence detection was performed with excitation and emission wavelengths of 352 nm and 385 nm respectively.
The GO and MGO were analyzed using isocratic elution with 20% mobile phase B on a single Waters Symmetry column (5 μm, 3.9×150 mm). Quantitation was based on peak area measurement using external standardization. Calibration curves of peak area versus concentration were linear up to 10 μmol/L (correlation coefficients > 0.9999) for all components. The lower limit of determination at a signal-to-noise ratio of 10 was approximately 0.05 μmol/L. For all components, the within-day and between-day precisions, expressed as coefficients of variation, were better than 4% and 9% respectively.
Determination of Pentosidine: Reverse-phase HPLC, as originally described by Odetti et al. (18) and modified by Miyata et al. (19), was chosen for determination of plasma pentosidine. Briefly, 50 μL plasma was lyophilized and then hydrolyzed by 50 μL 6 N HCl at 110°C under nitrogen atmosphere for 16 hours. After neutralization with 100 μL 5 N NaOH and 200 μL 0.5 mol/L phosphate buffer (pH 7.4), samples were filtered through a 0.45-μm filter (Millipore, Billerica, MA, USA) and diluted 1:20 with phosphate-buffered saline. Filtered samples (50 μL) were ejected into a C18 reverse-phase analytical column (Vydac 218TP104: The Separations Group, Hesperia, CA, USA) equipped with an online fluorescence detector at excitation and emission wavelengths of 335 nm and 385 nm respectively. A linear solvent gradient was used as described by Wilker et al. (20) in which solvent A was 0.01 mol/L hepatofluorobutyric acid in water and solvent B was 60% acetonitrile plus 40% H2O and 0.01 mol/L hepatofluorobutyric acid. This elution profile was used: 0 – 30 minutes, 0% B; 3 – 20 minutes, 0% – 30% B; 20 – 25 minutes, 30% B; 25 – 35 minutes, 30% – 100% B; 36 – 45 minutes, 0% B linear gradient. The flow rate was maintained at 1 mL through the chromatographic run. Synthetic pentosidine (kindly provided by Drs. David R. Sell and Vincent M. Monnier, Case Western Reserve University, Cleveland, OH, USA, and by Dr. Toshio Miyata, School of Medicine, Tokai University, Japan) was used for the calculation. Because plasma total pentosidine is mainly protein-bound and albumin is the major protein linking pentosidine (9), and because free pentosidine represents 3% – 4% of total circulating pentosidine (21), the plasma total pentosidine concentrations in picomoles per liter were therefore corrected for albumin and expressed as plasma pentosidine content in picomoles per milligram of albumin (22).
Determination of CEL and CML Residues in Plasma Proteins: Plasma levels of Nε-(carboxymethyl)lysine (CML) and Nε-(carboxyethyl)lysine (CEL) were measured by stable-isotope dilution tandem mass spectrometry (23). To 25 μL plasma, 500 μL 100 mmol/L sodium borohydride dissolved in borate buffer (200 mmol/L, pH 9.2) was added. After 4 hours at room temperature, proteins were precipitated with trichloroacetic acid and pelleted by centrifugation. After addition of 2H4-CML and 2H8-CEL as internal standards (kindly provided by Drs. J. Baynes and S. Thorpe, University of South Carolina, Columbia, SC, USA), proteins were hydrolyzed overnight with 6 mol/L HCl at 110°C. The HCl was evaporated under a stream of nitrogen at 80°C, and the residue was dissolved in 5 mmol/L nonafluoropentanoic acid and analyzed by reverse-phase HPLC on a Symmetry C18 column [3.9×150 mm, 5 μm particle size (Waters)] using nonafluoropentanoic acid as an ion-pair reagent. Mobile phase A consisted of 5 mmol/L nonafluoropentanoic acid, and mobile phase B was acetonitrile. Compounds were eluted with a linear gradient from 10% to 25% B in 10 minutes. Thereafter, strongly retained compounds were removed from the column by a strong solvent wash. Between 10 and 12 minutes, B was increased to 80%, and it was kept at that level until 14 minutes. Between 14 and 16 minutes, B was reduced to 10% and kept at that level to equilibrate the column before the next injection at 21 minutes. Flow rate was 1 mL/min, and 20% of the column effluent was introduced into the turbo ion spray source of the tandem mass spectrometer (API 3000: AB Sciex, Nieuwerkerk, Netherlands). Analyses were performed in the positive-ion mode. Multiple reaction monitoring was performed for the 205.1/84.1 transition for CML and the 219.1/84.1 transition for CEL, and the 209.1/88.1 and 227.1/92.1 transitions for the internal standards 2H4-CML and 2H8-CEL respectively. The CML, CEL, and internal standards eluted as symmetrical peaks and were clearly resolved from interfering compounds. Mean recoveries of exogenous CML added to plasma in concentrations of 0.25 μmol/L and 0.50 μmol/L were 100% and 95% respectively. Mean recoveries for CEL at these concentrations were 92% and 94% respectively. Within-day and between-day coefficients of variation were <4.4% and <3.2% for CML and <6.8% and <7.3% for CEL. Mean plasma levels of CML and CEL (± standard deviation) in 10 healthy volunteers were 2.8 ± 0.4 μmol/L and 0.8 ± 0.2 μmol/L respectively. In the present study, CML and CEL residues in plasma proteins were normalized for lysine concentration by expressing the residues as micromoles per liter per moles per liter lysine.
STATISTICS
The data analysis used the longitudinal generalized estimating equations (GEE) technique in Stata 7 and 10.1 (StataCorp LP, College Station, TX, USA) for Windows. The GEE technique is a sophisticated method suitable for longitudinal analysis between a continuous variable and several time-dependent and -independent covariates (24).
The first 6 weeks were considered to reflect mainly the start of PD and were analyzed separately. In the analyses of the treatment periods (6 – 30 weeks and 30 – 54 weeks), the determinations at t = 6 weeks were considered to be the baseline values. In the GEE model, the variable studied (for example, 3-DG, pentosidine) was analyzed as the dependent variable according to the actual PD regimen (NEPP = 1, sPD = 0). Additional analyses were performed using the available determinants of NEPP, such as the intraperitoneal GDP and glucose loads. Adjustments were made for time, for sequence of regimens, and if possible, for previous observations, using additional independent variables. If the data were skewed, the analyses were performed after log transformation.
Data are presented in graphs showing mean ± standard error (for normally distributed data) or median with 25th and 75th percentiles (for skewed data). A p value less than 0.05 was considered statistically significant.
RESULTS
PATIENTS
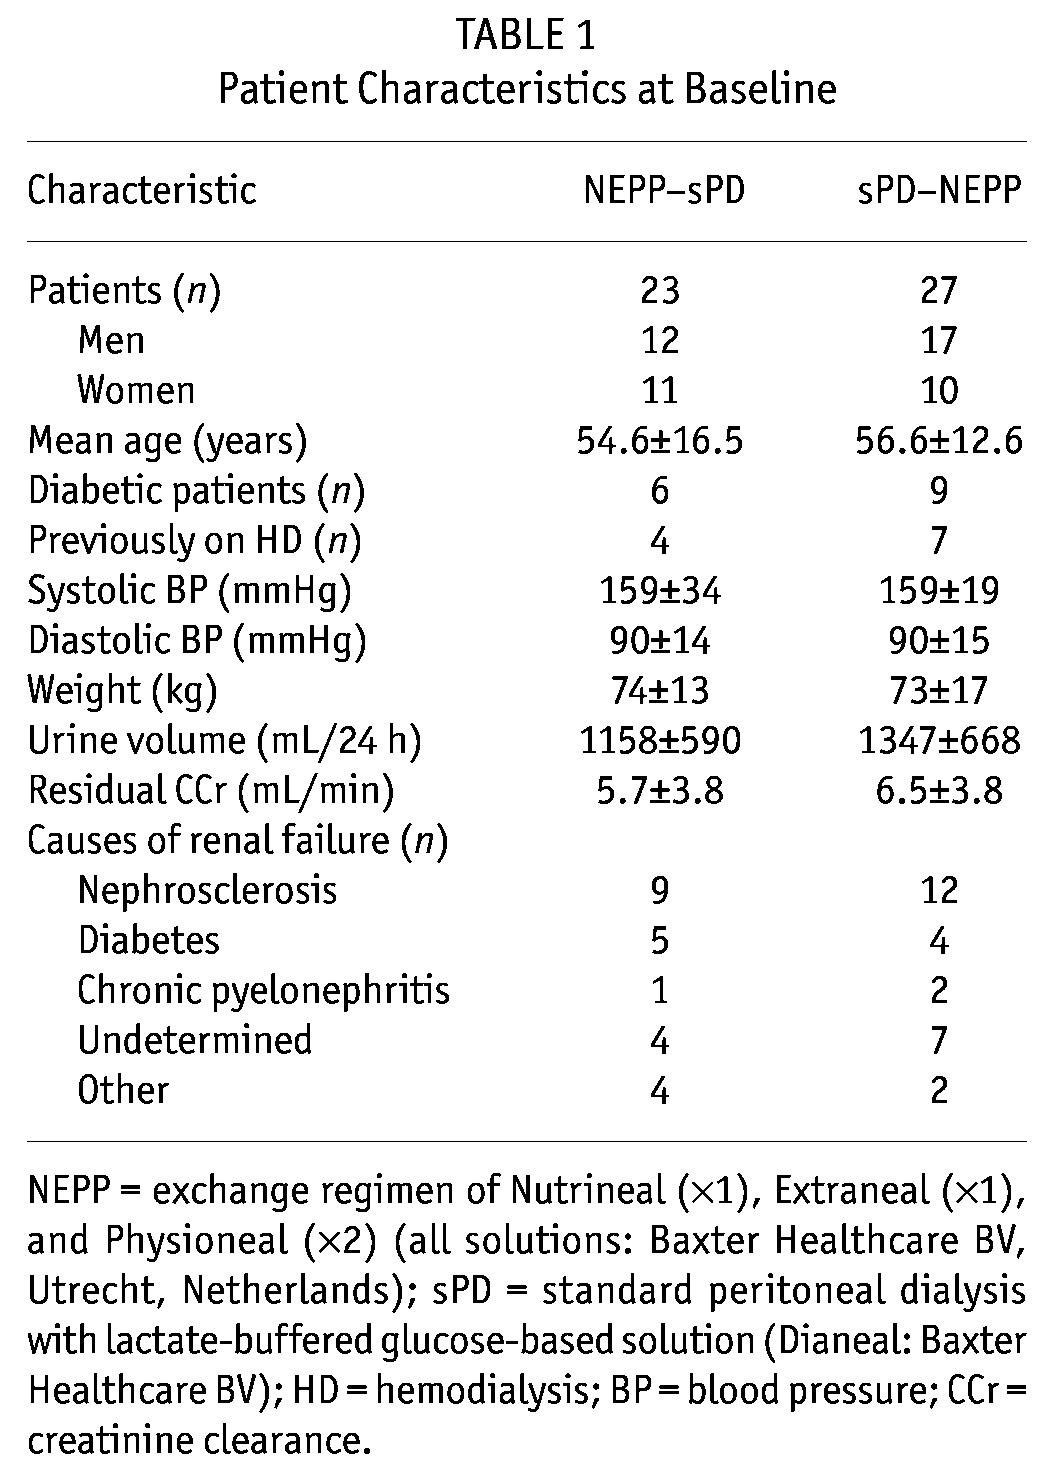
The study enrolled 74 patients (39 NEPP–sPD, 35 sPD–NEPP), and 50 patients (23 NEPP–sPD, 27 sPD–NEPP) completed the entire 54-week study period. Patient characteristics did not differ between the groups at baseline (Table 1).
TABLE 1.
Patient Characteristics at Baseline
Reasons for withdrawal during the first study period were (for NEPP–sPD and sPD–NEPP respectively) renal transplant (n = 1, 1), patient wish (n = 2, 2), death (n = 1, 2), peritonitis (n = 1, 2), low Kt/V (n = 1, 0), inability to perform CAPD (n = 3, 0), and somatic concerns (n = 2, 0). During the second study period, the reasons for withdrawal were protocol violation (n = 1, 0), renal transplant (n = 2, 1), ultrafiltration failure (n = 1, 0), and dyslipidemia (n = 1, 0). In 5 NEPP–sPD and 3 sPD–NEPP patients, icodextrin had to be discontinued because of allergic skin reaction (n = 1, 0), sterile peritonitis (n = 3, 3), and nausea (n = 1, 0). Unfortunately, in retrospect, the study appeared to have been conducted during a period during which some icodextrin batches contained elevated levels of peptidoglycans (25,26). We found that 9 patients in our study population (5 NEPP–sPD, 4 sPD–NEPP) had used peptidoglycan-contaminated batches of icodextrin during part of their NEPP treatment period [mean: 92 days (range: 35 – 191 days)]. Contamination with peptidoglycans was therefore added as dichotomous variable (yes/no) in the multivariate analyses. Amino-acid solution was stopped in 2 NEPP–sPD patients because of skin eruptions (n = 1) and low net ultrafiltration (n = 1).
GDPS
As intended, treatment with the NEPP regimen resulted in lower intraperitoneal loads of glucose (94.6 ± 57.4 g/24 h vs. 159.8 ± 49.1 g/24 h), 3-DG (829 ± 334 μmol/24 h vs. 2467 ± 906 μmol/24 h), MGO (6.3 ± 1.6 μmol/24 h vs. 40.2 ± 15.9 μmol/24 h), and GO (15.9 ± 8.8 μmol/L vs. 43.1 ± 17.4 μmol/L). Nevertheless, plasma 3-DG showed a statistically significant increase after the start of PD treatment (0 – 6 weeks) in both the group starting on NEPP and the group starting on sPD (Figure 1); however, the sPD group tended to have a larger increase (p = 0.08 between the regimens). In the first 6 weeks, no statistically significant changes in plasma MGO and GO were observed (Figures 2 and 3).
Figure 1.
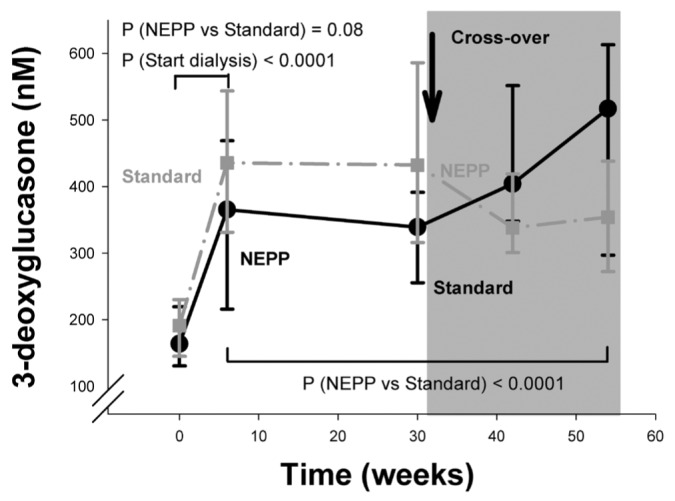
— Time course of plasma 3-deoxyglucosone (nmol/L) in the NEPP–sPD and sPD–NEPP groups. Data are expressed as medians with 25% and 75% percentiles. NEPP = exchange regimen of Nutrineal (×1), Extraneal (×1), and Physioneal (×2) (all solutions: Baxter Healthcare BV, Utrecht, Netherlands); sPD = standard peritoneal dialysis with lactate-buffered glucose-based solution (Dianeal: Baxter Healthcare BV).
Figure 2.
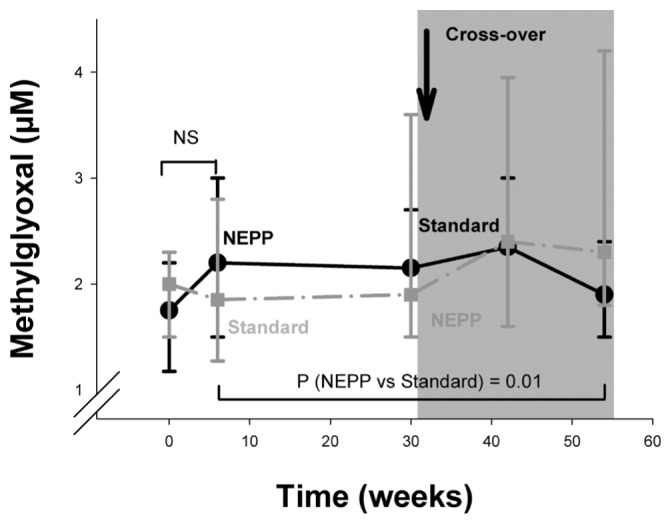
— Time course of plasma methylglyoxal (μmol/L) in the NEPP–sPD and sPD–NEPP groups. Data are expressed as medians with 25% and 75% percentiles. NEPP = exchange regimen of Nutrineal (×1), Extraneal (×1), and Physioneal (×2) (all solutions: Baxter Healthcare BV, Utrecht, Netherlands); sPD = standard peritoneal dialysis with lactate-buffered glucose-based solution (Dianeal: Baxter Healthcare BV); NS = nonsignificant.
Figure 3.
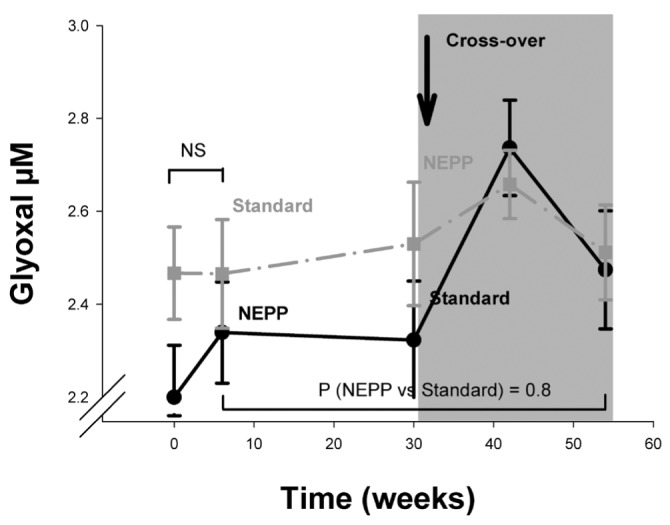
— Time course of plasma glyoxal (μmol/L) in the NEPP–sPD and sPD–NEPP groups. Data are expressed as mean ± standard error. NEPP = exchange regimen of Nutrineal (×1), Extraneal (×1), and Physioneal (×2) (all solutions: Baxter Healthcare BV, Utrecht, Netherlands); sPD = standard peritoneal dialysis with lactate-buffered glucose-based solution (Dianeal: Baxter Healthcare BV); NS = nonsignificant.
During the study period (6 – 54 weeks), systemic 3-DG levels were, after adjustments for the effects of time and sequence of regimens, lower during NEPP treatment (p < 0.0001, Figure 1) and higher in diabetic patients (mean: 430.4 ± 195.5 nmol/L, p = 0.02). By contrast, systemic MGO levels were higher during NEPP treatment (p = 0.01, Figure 2). Systemic GO levels, after the same adjustments, did not differ between the treatment groups (Figure 3). Levels of MGO and GO were not related to the presence of diabetes (p > 0.25).
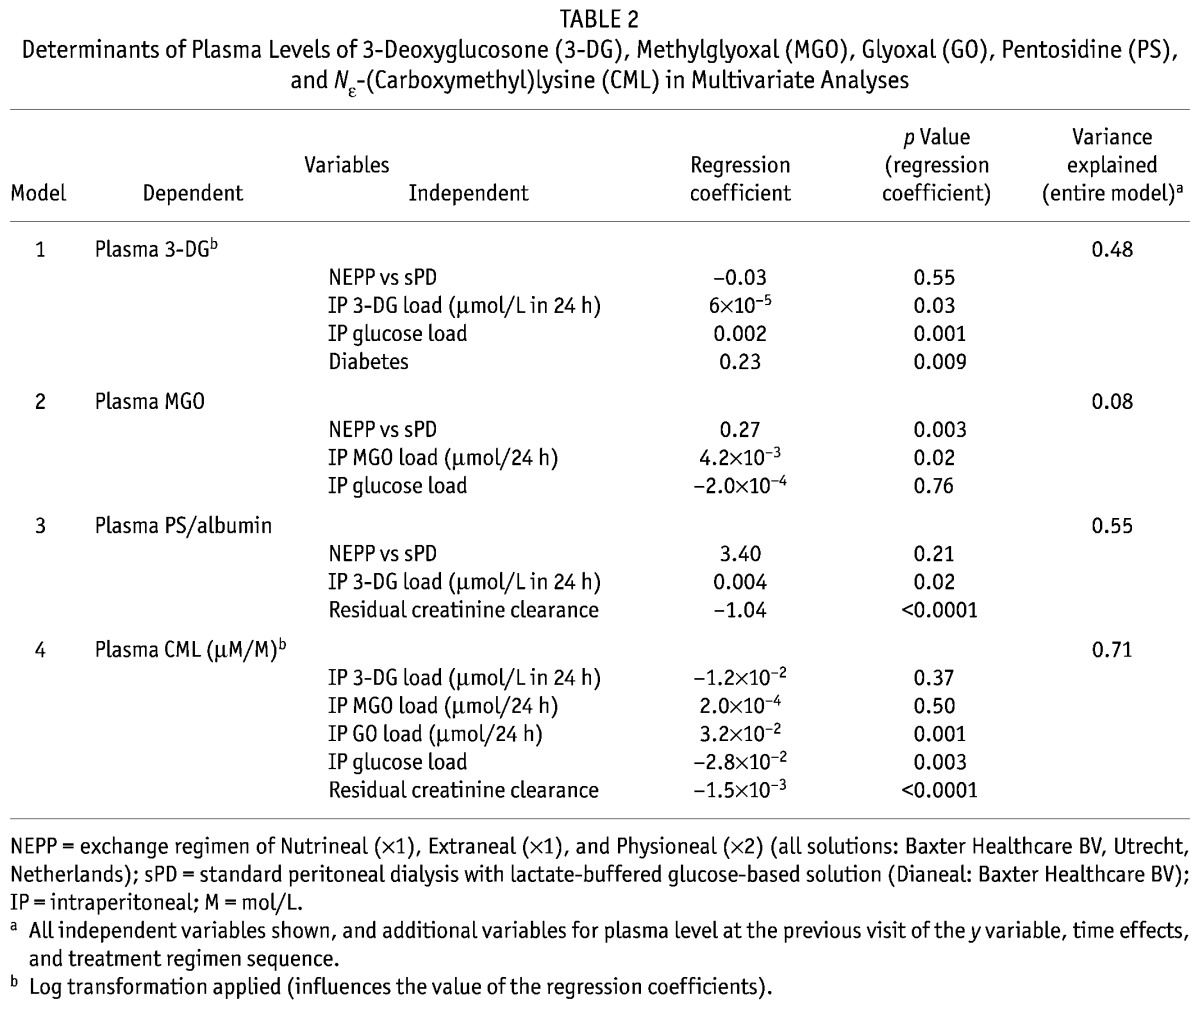
In an analysis of the lower plasma 3-DG levels during NEPP treatment over the entire study period (6 – 54 weeks) using determinants of NEPP, glucose load and 3-DG load were both statistically significantly associated with systemic 3-DG levels (p = 0.001 and p = 0.03 respectively), even after adjustments for time, initial levels, and diabetes (Table 2). In this multivariate analysis, in which both the glucose and the 3-DG load were independent variables, presence of NEPP no longer emerged as a determinant of systemic 3-DG levels, suggesting that lower systemic 3-DG levels were a consequence of both the lower actual intraperitoneal 3-DG load and the lower actual glucose load, and not of other characteristics of NEPP such as the use of amino acids or icodextrin, or the alternation of the various PD fluids. The systemic MGO level appeared to depend on the actual intraperitoneal MGO load, but not on the actual intraperitoneal glucose load (p = 0.02 and p = 0.76 respectively, Table 2). After addition of a dichotomous variable representing the possible presence of contaminated icodextrin, the relationship between NEPP and plasma levels of GDP persisted, indicating that that relationship was not a consequence of the contamination.
TABLE 2.
Determinants of Plasma Levels of 3-Deoxyglucosone (3-DG), Methylglyoxal (MGO), Glyoxal (GO), Pentosidine (PS), and Nε-(Carboxymethyl)lysine (CML) in Multivariate Analyses
AGES
After the start of PD treatment (0 – 6 weeks), plasma levels of pentosidine (adjusted for albumin) remained stable (p = 0.11), but CEL in plasma proteins declined (p = 0.04), and CML in plasma proteins increased (p = 0.0001, Figures 4, 5, 6). At the start of PD (p = 0.002) and after the regimen switch (30 – 42 weeks, p = 0.001), CML in plasma proteins increased statistically significantly more during NEPP treatment than during sPD treatment (Figure 5).
Figure 4.
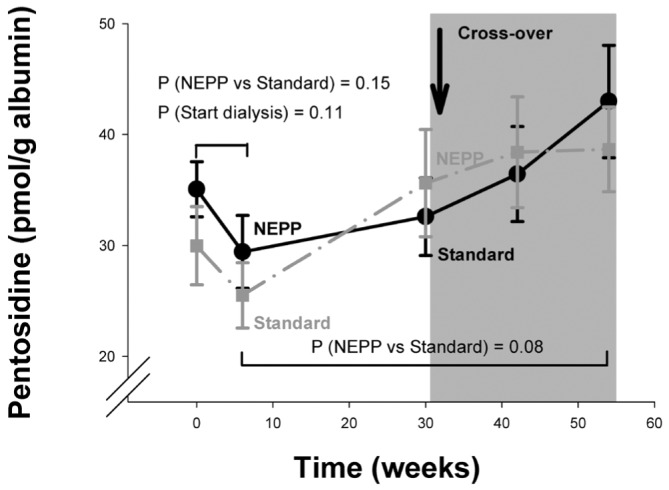
— Time course of plasma pentosidine (pmol/g albumin) in the NEPP–sPD and sPD–NEPP groups. Data are expressed as means with standard error. NEPP = exchange regimen of Nutrineal (×1), Extraneal (×1), and Physioneal (×2) (all solutions: Baxter Healthcare BV, Utrecht, Netherlands); sPD = standard peritoneal dialysis with lactate-buffered glucose-based solution (Dianeal: Baxter Healthcare BV).
Figure 5.
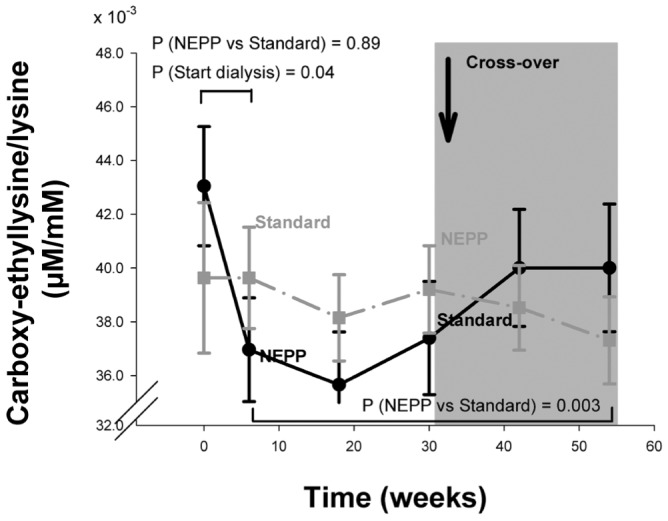
— Time course of the ratio of plasma Nε-(carboxyethyl) lysine to lysine (μM/M) in the NEPP–sPD and sPD–NEPP groups. Data are expressed as means with standard error. M = mol/L; NEPP = exchange regimen of Nutrineal (×1), Extraneal (×1), and Physioneal (×2) (all solutions: Baxter Healthcare BV, Utrecht, Netherlands); sPD = standard peritoneal dialysis with lactate-buffered glucose-based solution (Dianeal: Baxter Healthcare BV).
Figure 6.
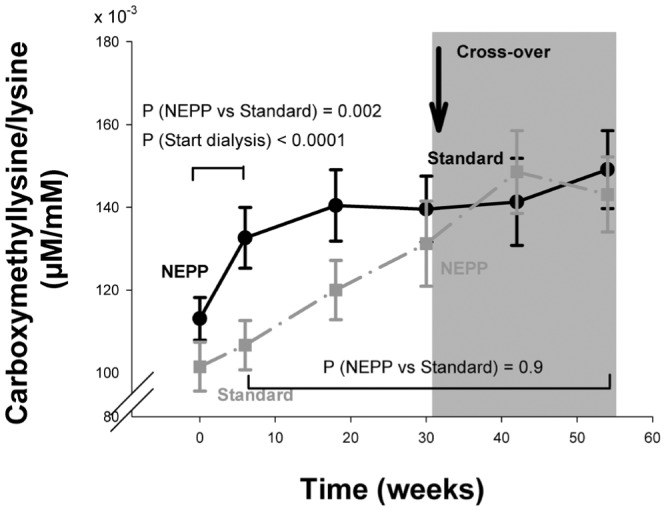
— Time course of the ratio of plasma Nε-(carboxymethyl) lysine to lysine (μM/M) in the NEPP–sPD and sPD–NEPP groups. Data are expressed as means with standard error. M = mol/L; NEPP = exchange regimen of Nutrineal (×1), Extraneal (×1), and Physioneal (×2) (all solutions: Baxter Healthcare BV, Utrecht, Netherlands); sPD = standard peritoneal dialysis with lactate-buffered glucose-based solution (Dianeal: Baxter Healthcare BV).
Analyzing the entire study period (6 – 54 weeks), pentosidine increased (p < 0.0001) in both groups, trending lower during NEPP (p = 0.08, Figure 4). An additional multivariate analysis showed that this effect was associated with a lower 3-DG load during the NEPP treatment (Table 2, p = 0.02).
The fluctuation of plasma pentosidine, which is mostly albumin-bound, may be influenced by the peritoneal clearance of albumin (9). Peritoneal protein loss was significantly higher during the NEPP regimen (mean: 7.15 ± 3.01 g/24 h) than during the sPD regimen (mean: 6.57 ± 2.96 g/24 h, p = 0.02). Higher intraperitoneal protein loss was associated with lower plasma pentosidine levels (p = 0.04).
In plasma proteins, CEL was higher during sPD treatment (p = 0.003, Figure 5), but CML increased similarly in both regimens (p = 0.9 NEPP vs. sPD, Figure 6). Plasma levels of CML were inversely related to residual creatinine clearance: CML levels were higher when residual clearance was lower (p < 0.0001). Levels of CEL were not determined by glucose, 3-DG, GO, or MGO load. After adjustments for residual creatinine clearance, CML in plasma proteins was associated with the intraperitoneal GO and glucose loads (p = 0.001 and p = 0.003 respectively), but not with the 3DG and MGO loads (Table 2).
The influence of NEPP treatment on plasma AGE levels could not be attributed to the presence of contaminated icodextrin.
DISCUSSION
The main findings of the present study are, first, that PD start resulted in an increase of 3-DG plasma levels and of CML in plasma proteins, and a decrease of CEL in plasma proteins, regardless of the PD regimen; and second, that after initiation of PD, continued treatment with the NEPP regimen resulted in lower 3-DG plasma levels and less CEL in plasma proteins, but higher levels of MGO and a steeper increase of CML in plasma proteins at the start of PD, than occurred with the sPD regimen. Although a few patients in both study groups were treated for a limited period with icodextrin solution contaminated with peptidoglycans, our analyses show (after addition of a variable for contamination) that the findings of the present study could not be attributed to the contamination and thus must be explained by other differences in the dialysis regimens studied.
PD REGIMEN AND SYSTEMIC GDPS
Previous studies showed that GDPs disappear rapidly from PD fluid after instillation for a dwell (13), and it has been suggested that systemic absorption is responsible (13). The present study confirmed an increase in plasma levels of 3-DG after the start of PD. That increase and the statistically significant association between intraperitoneal 3-DG load and plasma levels of 3-DG both strongly confirm the absorption hypothesis. However, in the multivariate analysis of the present study, intraperitoneally administered glucose also contributed to plasma 3-DG levels, suggesting that, apart from absorption, glucose-driven production of GDPs also plays a role in the plasma level of 3-DG. Nevertheless, with regard to plasma levels of 3-DG, the NEPP regimen appears to be beneficial in two ways: the lower 3-DG load and the lower glucose load result in lower plasma 3-DG levels.
In contrast with those findings, plasma levels of MGO were slightly higher during NEPP treatment and were not determined by intraperitoneal glucose or MGO load. Plasma levels of GO did not differ between the regimens. A possible explanation for that observation may be the reactivity of the GO and MGO compounds—that is, they have a short half-life, and may therefore not accumulate in plasma in their free form (27). In the case of MGO, the analyses suggest that higher levels during NEPP treatment are not a result of intraperitoneal glucose or GDP load, but of characteristics of the NEPP regimen such as icodextrin, amino acids, or alternation of fluids.
PD REGIMEN AND SYSTEMIC AGE LEVELS
At the start of PD treatment, we observed a decrease of CEL in plasma proteins, suggesting that peritoneal clearance of these substances is an important determinant of levels in plasma. During the entire study period, a higher intraperitoneal 3-DG load was associated with a higher plasma pentosidine level, suggesting that lowering the substrate molecules for pentosidine directly contributes to diminished production.
By contrast, CML in plasma proteins was found to increase after PD start with use of either NEPP or sPD. However, the rise in plasma CML was significantly greater in the NEPP-treated patients. In addition, after the switch from standard treatment to the NEPP regimen at 30 weeks, a comparable statistically significant rise in plasma CML was seen in the sPD–NEPP group. We hypothesize that this rapid rise is a result of icodextrin use, because a similar increase was observed by Konings et al. after addition of icodextrin to a glucose–lactate regimen (28). Because CML is formed through both the glycoxidation and the lipid peroxidation pathways (29), but pentosidine and CEL are derived mainly through glycoxidation pathways (30), it could be hypothesized that CML formation is augmented by additional lipid peroxidation attributable to icodextrin. Furthermore, the increase of plasma amino acids associated with the use of amino-acid-based PD solutions might also contribute to increased levels of CML. No data are available concerning changes in plasma markers of glycation during treatment with amino-acid-based PD solutions, but lower generation of pentosidine and CML in effluents has been observed than was seen with standard 1.36% solutions (31).
In the present study, we noted several statistical relationships between GDPs and AGEs. The presence of a relationship with GDP load depends both on the tendency of the given GDP molecule to react with other substances and on the half-life of the AGEs formed. For instance, a reactive GDP that forms an AGE with a long half-life is more likely to show a statistical relationship with GDP load, and in the present study, the 3-DG and GO loads were proportionally associated with plasma levels of pentosidine and CML. Those findings are important, because they show that the choice of PD regimen directly influences systemic AGE levels. Because of its lower GDP content, the NEPP regimen has a beneficial influence on that relationship; and even when the beneficial impact of NEPP is limited, our finding is important because it demonstrates that further improvements in PD fluids may contribute substantially to lowering plasma GDPs and some AGEs during PD.
CLINICAL RELEVANCE
In diabetic patients, systemic GDP and AGE levels have both been associated with cardiovascular disease (32–34). The main hypothesis concerning this association is that the deposition of AGEs in the basement membrane of the vessel wall results in permanent changes (35) and induces altered cellular responses, promoting expansion of the extracellular matrix by upregulated fibroblasts (36). As a consequence, lower GDP and AGE levels have been a target of treatment in those patients and may be beneficial in other groups of patients, such as those with end-stage renal disease, as well. However, this suggested association between markers of glycation and cardiovascular mortality is not yet established fully in patients with end-stage renal disease. Skin deposition of AGEs, as assessed by skin autofluorescence, possibly reflecting AGE deposition and thus cardiovascular damage, is associated with previous intraperitoneal glucose exposure in PD patients (37). By contrast, Schwedler et al. (38) found an inverse relation between plasma CML levels and mortality even in hemodialysis patients.
The clinical significance of of the present study remain to be elucidated. First, treatment with NEPP is not associated with improvement of all intermediate endpoints. Whether the balance of the regimen’s diverse effects will benefit or harm general outcome remains to be established. Second, although we observed a decrease in plasma levels of 3-DG, a lesser increase of pentosidine, and lower CEL levels during NEPP treatment, plasma concentrations are still high and do not come close to the concentrations found in healthy subjects. At these high levels, it is not known whether small reductions in plasma markers of glycation will have a favorable effect on the risk of cardiovascular disease. Finally, the possibly harmful effects of increased plasma levels of MGO and CML during NEPP treatment should be balanced against the beneficial clinical effects.
CONCLUSIONS
Our study demonstrates that the NEPP regimen, characterized by lower glucose and GDP loads, results in an attenuated increase of systemic 3-DG and a more pronounced decline of plasma CEL than are seen with a standard glucose–lactate treatment regimen. However, NEPP is accompanied by an increase in systemic CML levels, probably attributable to icodextrin. The clinical relevance of these findings, such as a decrease or increase in cardiovascular risk, needs to be established by further prospective studies.
DISCLOSURES
BL is employed by Baxter Healthcare Corporation.
Acknowledgments
This work was supported by an unrestricted grant of Baxter International Inc. and the Dutch Kidney Foundation.
REFERENCES
- 1. Gokal R, Mallick NP. Peritoneal dialysis. Lancet 1999; 353:823–8 [DOI] [PubMed] [Google Scholar]
- 2. Gokal R, Oreopoulos DG. Is long-term technique survival on continuous ambulatory peritoneal dialysis possible? Perit Dial Int 1996; 16:553–5 [PubMed] [Google Scholar]
- 3. Foley RN, Parfrey PS, Sarnak MJ. Clinical epidemiology of cardiovascular disease in chronic renal disease. Am J Kidney Dis 1998; 32(Suppl 3):S112–19 [DOI] [PubMed] [Google Scholar]
- 4. Longenecker JC, Coresh J, Powe NR, Levey AS, Fink NE, Martin A, et al. Traditional cardiovascular disease risk factors in dialysis patients compared with the general population: the CHOICE Study. J Am Soc Nephrol 2002; 13:1918–27 [DOI] [PubMed] [Google Scholar]
- 5. Suliman ME, Heimbürger O, Bárány P, Anderstam B, Pecoits–Filho R, Rodríguez Ayala E, et al. Plasma pentosidine is associated with inflammation and malnutrition in end-stage renal disease patients starting on dialysis therapy. J Am Soc Nephrol 2003; 14:1614–22 [DOI] [PubMed] [Google Scholar]
- 6. Brownlee M. Advanced protein glycosylation in diabetes and aging. Annu Rev Med 1995; 46:223–34 [DOI] [PubMed] [Google Scholar]
- 7. Schalkwijk CG, Posthuma N, ten Brink HJ, ter Wee PM, Teerlink T. Induction of 1,2-dicarbonyl compounds, intermediates in the formation of advanced glycation end-products, during heat-sterilization of glucose-based peritoneal dialysis fluids. Perit Dial Int 1999; 19:325–33 [PubMed] [Google Scholar]
- 8. Miyata T, Devuyst O, Kurokawa K, van Ypersele de Strihou C. Toward better dialysis compatibility: advances in the biochemistry and pathophysiology of the peritoneal membranes. Kidney Int 2002; 61:375–86 [DOI] [PubMed] [Google Scholar]
- 9. Miyata T, Ueda Y, Shinzato T, Iida Y, Tanaka S, Kurokawa K, et al. Accumulation of albumin-linked and free-form pentosidine in the circulation of uremic patients with end-stage renal failure: renal implications in the pathophysiology of pentosidine. J Am Soc Nephrol 1996; 7:1198–206 [DOI] [PubMed] [Google Scholar]
- 10. Nakayama M, Kawaguchi Y, Yamada K, Hasegawa T, Takazoe K, Katoh N, et al. Immunohistochemical detection of advanced glycosylation end-products in the peritoneum and its possible pathophysiological role in CAPD. Kidney Int 1997; 51:182–6 [DOI] [PubMed] [Google Scholar]
- 11. Erixon M, Wieslander A, Lindén T, Carlsson O, Jönsson JA, Simonsen O, et al. 3,4-Dideoxyglucosone-3-ene in peritoneal dialysis fluids infused into the peritoneal cavity cannot be found in plasma. Perit Dial Int 2009; 29(Suppl 2):S28–31 [PubMed] [Google Scholar]
- 12. Erixon M, Wieslander A, Lindén T, Carlsson O, Jönsson JA, Simonsen O, et al. 3,4-DGE in peritoneal dialysis fluids cannot be found in plasma after infusion into the peritoneal cavity. Perit Dial Int 2008; 28:277–82 [PubMed] [Google Scholar]
- 13. Zeier M, Schwenger V, Deppisch R, Haug U, Weigel K, Bahner U, et al. Glucose degradation products in PD fluids: do they disappear from the peritoneal cavity and enter the systemic circulation? Kidney Int 2003; 63:298–305 [DOI] [PubMed] [Google Scholar]
- 14. Miyata T, Kurokawa K, van Ypersele de Strihou C. Advanced glycation and lipoxidation end products: role of reactive carbonyl compounds generated during carbohydrate and lipid metabolism. J Am Soc Nephrol 2000; 11:1744–52 [DOI] [PubMed] [Google Scholar]
- 15. Schalkwijk CG, ter Wee PM, Teerlink T. Reduced 1,2-dicarbonyl compounds in bicarbonate/lactate-buffered peritoneal dialysis (PD) fluids and PD fluids based on glucose polymers or amino acids. Perit Dial Int 2000; 20:796–8 [PubMed] [Google Scholar]
- 16. le Poole CY, van Ittersum FJ, Weijmer MC, Valentijn RM, ter Wee PM. Clinical effects of a peritoneal dialysis regimen low in glucose in new peritoneal dialysis patients: a randomized crossover study. Adv Perit Dial 2004; 20:170–6 [PubMed] [Google Scholar]
- 17. le Poole CY, van Ittersum FJ, Weijmer MC, Valentijn RM, ter Wee PM. Clinical effects of a PD regimen low in glucose in new PD patients: a randomized cross-over study. Perit Dial Int 2005; 25(Suppl 3):S64–7 [PubMed] [Google Scholar]
- 18. Odetti P, Fogarty J, Sell DR, Monnier VM. Chromatographic quantitation of plasma and erythrocyte pentosidine in diabetic and uremic subjects. Diabetes 1992; 41:153–9 [DOI] [PubMed] [Google Scholar]
- 19. Miyata T, van Ypersele de Strihou C, Kurokawa K, Baynes JW. Alterations in nonenzymatic biochemistry in uremia: origin and significance of “carbonyl stress” in long-term uremic complications. Kidney Int 1999; 55:389–99 [DOI] [PubMed] [Google Scholar]
- 20. Wilker SC, Chellan P, Arnold BM, Nagaraj RH. Chromatographic quantification of argpyrimidine, a methylglyoxal-derived product in tissue proteins: comparison with pentosidine. Anal Biochem 2001; 290:353–8 [DOI] [PubMed] [Google Scholar]
- 21. Friedlander MA, Wu YC, Elgawish A, Monnier VM. Early and advanced glycosylation end products. Kinetics of formation and clearance in peritoneal dialysis. J Clin Invest 1996; 97:728–35 [DOI] [PMC free article] [PubMed] [Google Scholar]
- 22. Inagi R, Miyata T. Oxidative protein damage with carbohydrates and lipids in uremia: “carbonyl stress.” Blood Purif 1999; 17:95–8 [DOI] [PubMed] [Google Scholar]
- 23. Teerlink T, Barto R, Ten Brink HJ, Schalkwijk CG. Measurement of Nε-(carboxymethyl)lysine and Nε-(carboxyethyl) lysine in human plasma protein by stable-isotope-dilution tandem mass spectrometry. Clin Chem 2004; 50:1222–8 [DOI] [PubMed] [Google Scholar]
- 24. Twisk JW. Longitudinal data analysis. A comparison between generalized estimating equations and random coefficient analysis. Eur J Epidemiol 2004; 19:769–76 [DOI] [PubMed] [Google Scholar]
- 25. Martis L, Patel M, Giertych J, Mongoven J, Taminne M, Perrier MA, et al. Aseptic peritonitis due to peptidoglycan contamination of pharmacopoeia standard dialysis solution. Lancet 2005; 365:588–94 [DOI] [PubMed] [Google Scholar]
- 26. Boer WH, Vos PF, Fieren MW. Culture-negative peritonitis associated with the use of icodextrin-containing dialysate in twelve patients treated with peritoneal dialysis. Perit Dial Int 2003; 23:33–8 [PubMed] [Google Scholar]
- 27. Thornalley PJ, Yurek–George A, Argirov OK. Kinetics and mechanism of the reaction of aminoguanidine with the alpha-oxoaldehydes glyoxal, methylglyoxal, and 3-deoxyglucosone under physiological conditions. Biochem Pharmacol 2000; 60:55–65 [DOI] [PubMed] [Google Scholar]
- 28. Konings CJ, Schalkwijk CG, van der Sande FM, Leunissen KM, Kooman JP. Influence of icodextrin on plasma and dialysate levels of Nε-(carboxymethyl)lysine and Nε-(carboxyethyl)lysine. Perit Dial Int 2005; 25:591–5 [PubMed] [Google Scholar]
- 29. Ahmed MU, Brinkmann Frye E, Degenhardt TP, Thorpe SR, Baynes JW. Nε-(Carboxyethyl)lysine, a product of the chemical modification of proteins by methylglyoxal, increases with age in human lens proteins. Biochem J 1997; 324:565–70 [DOI] [PMC free article] [PubMed] [Google Scholar]
- 30. van de Kerkhof J, Schalkwijk CG, Konings CJ, Cheriex EC, van der Sande FM, Scheffer PG, et al. Nε-(Carboxymethyl) lysine, Nε-(carboxyethyl)lysine and vascular cell adhesion molecule-1 (VCAM-1) in relation to peritoneal glucose prescription and residual renal function; a study in peritoneal dialysis patients. Nephrol Dial Transplant 2004; 19:910–16 [DOI] [PubMed] [Google Scholar]
- 31. Ueda Y, Miyata T, Goffin E, Yoshino A, Inagi R, Ishibashi Y, et al. Effect of dwell time on carbonyl stress using icodextrin and amino acid peritoneal dialysis fluids. Kidney Int 2000; 58:2518–24 [DOI] [PubMed] [Google Scholar]
- 32. Kusunoki H, Miyata S, Ohara T, Liu BF, Uriuhara A, Kojima H, et al. Relation between serum 3-deoxyglucosone and development of diabetic microangiopathy. Diabetes Care 2003; 26:1889–94 [DOI] [PubMed] [Google Scholar]
- 33. Monnier VM, Vishwanath V, Frank KE, Elmets CA, Dauchot P, Kohn RR. Relation between complications of type I diabetes mellitus and collagen-linked fluorescence. N Engl J Med 1986; 314:403–8 [DOI] [PubMed] [Google Scholar]
- 34. Brownlee M, Cerami A, Vlassara H. Advanced glycosylation end products in tissue and the biochemical basis of diabetic complications. N Engl J Med 1988; 318:1315–21 [DOI] [PubMed] [Google Scholar]
- 35. Aronson D. Cross-linking of glycated collagen in the pathogenesis of arterial and myocardial stiffening of aging and diabetes. J Hypertens 2003; 21:3–12 [DOI] [PubMed] [Google Scholar]
- 36. Yan SF, Ramasamy R, Naka Y, Schmidt AM. Glycation, inflammation, and RAGE: a scaffold for the macrovascular complications of diabetes and beyond. Circ Res 2003; 93:1159–69 [DOI] [PubMed] [Google Scholar]
- 37. McIntyre NJ, Chesterton LJ, John SG, Jefferies HJ, Burton JO, Taal MW, et al. Tissue-advanced glycation end product concentration in dialysis patients. Clin J Am Soc Nephrol 2010; 5:51–5 [DOI] [PMC free article] [PubMed] [Google Scholar]
- 38. Schwedler SB, Metzger T, Schinzel R, Wanner C. Advanced glycation end products and mortality in hemodialysis patients. Kidney Int 2002; 62:301–10 [DOI] [PubMed] [Google Scholar]


