Abstract
Purpose
Medulloblastomas are heterogeneous and include relatively good-prognosis tumors characterized by Wnt pathway activation, as well as those that cannot be successfully treated with conventional therapy. Developing a practical therapeutic stratification that allows accurate identification of disease risk offers the potential to individualize adjuvant therapy and to minimize long-term adverse effects in a subgroup of survivors.
Methods
Using formalin-fixed paraffin-embedded (FFPE) tissue for immunohistochemistry, fluorescent in situ hybridization, and direct sequencing to identify tumors with a Wnt pathway signature and those harboring copy number abnormalities (CNAs) of potential prognostic significance (MYC/MYCN amplification, CNAs of chromosome 6 and 17), we evaluated clinical, pathologic, and molecular outcome indicators and stratification models in a cohort (n = 207) of patients with medulloblastoma 3 to 16 years of age from the International Society of Pediatric Oncology CNS9102 (PNET3) trial.
Results
Metastatic disease and large-cell/anaplastic (LC/A) phenotype were the clinicopathologic variables associated with poor progression-free survival (PFS). Nuclear immunoreactivity for β-catenin, CTNNB1 mutation, and monosomy 6 all identified a group of good-prognosis patients. MYC amplification was associated with poor outcome, but other CNAs were not. Low-risk medulloblastomas were defined as β-catenin nucleopositive tumors without metastasis at presentation, LC/A phenotype, or MYC amplification. High-risk medulloblastomas were defined as tumors with metastatic disease, LC/A phenotype, or MYC amplification. Low-risk, standard-risk, and high-risk categories of medulloblastoma had significantly (P < .0001) different outcomes.
Conclusion
Integrating assays of molecular biomarkers undertaken on routinely collected diagnostic FFPE tissue into stratification schemes for medulloblastoma alongside clinical and pathologic outcome indicators can refine current definition of disease risk and guide adjuvant therapy.
INTRODUCTION
Clinicopathologic and biologic studies have increasingly supported the hypothesis that medulloblastoma is a heterogeneous disease with diverse phenotypes and contrasting therapeutic outcomes.1–5 Reduction of adjuvant therapy for a subgroup of patients with favorable disease that responds well to therapy has the potential to ameliorate long-term adverse effects, so the identification of this subgroup could become important for therapeutic stratification. Equally, identification of patients with high-risk disease provides an opportunity to intensify therapy with the aim of improving outcome.6,7
Clinical factors, particularly metastatic disease at presentation, currently determine therapeutic stratification for medulloblastoma patients. However, data from clinical trial-based studies indicating distinct biologic behaviors for pathologic variants of medulloblastoma could potentially influence future schemes; large-cell and anaplastic variants are increasingly regarded as high-risk disease, and desmoplastic tumors have a better outcome than other variants in infants.4,8,9 Molecular markers have yet to be advanced for stratification. Despite many claims for their application in this context, few molecular abnormalities have been robustly associated with outcome in separate studies of large cohorts of uniformly treated patients.2,10 In addition, the use of molecular markers will be adopted most readily if stratification schemes can be applied in any clinical laboratory using routine formalin-fixed paraffin-embedded (FFPE) tissue.
We first demonstrated that Wnt pathway activation in a subgroup of medulloblastomas characterized by nuclear immunoreactivity for β-catenin is associated with a good outcome, and this finding has since been replicated on several occasions.11–13 Other abnormalities that characterize this subgroup of tumors, CTNNB1 mutation and monosomy 6, may also be valuable indicators of a good outcome, but this hypothesis has not been robustly tested alongside β-catenin immunohistochemistry, and it remains to be determined which assay or combination of assays most appropriately identifies low-risk tumors alongside clinical and histologic variables.14–16 Further, a series of copy number abnormalities (CNAs), such as MYC or MYCN amplification and alterations on chromosomes 6q and 17, have been proposed as markers of poor outcome, but their relationship to favorable disease characterized by Wnt pathway activation and their clinical utility alongside identification of this favorable subgroup of medulloblastomas have not been adequately addressed in trial cohorts.17–19
In the present study of 207 children 3 to 16 years of age from the International Society for Pediatric Oncology (SIOP) PNET3 trial, we report a comprehensive study of the utility of established Wnt subgroup markers and putative molecular markers of high-risk disease alongside clinicopathologic disease features in risk-stratification models of medulloblastoma. We establish validated clinical, histopathologic, and molecular outcome indicators and demonstrate that these can be combined to delineate three distinct high-risk, standard-risk, and low-risk groups among this cohort.
METHODS
Patient Cohort
Medulloblastoma samples (n = 207) from children registered on the SIOP PNET3 trial protocol (CNS9102) were provided by contributing centers.5 Patients were randomly assigned to 35 Gy of craniospinal radiotherapy and a 20-Gy posterior fossa boost either alone or preceded by chemotherapy (carboplatin, cyclophosphamide, etoposide, and vincristine). Cohort size for the present study was determined by tissue availability. The clinical characteristics of patients in the present study cohort matched those in the original PNET3 trial with respect to both randomly and nonrandomly assigned patients (Table 1). Furthermore, nonrandomly assigned patients were treated with identical chemotherapy and radiotherapy protocols, and outcome data were collected by the study center at the same frequency as randomly assigned patients. Central radiologic and histopathologic reviews were undertaken, the former to determine the presence of metastatic disease and the latter according to both WHO classification (2007) and current Children's Oncology Group guidelines. Large cell and anaplastic variants were combined into one category (large cell/anaplastic [LC/A]).
Table 1.
Patient Cohort (n = 207)
| Characteristic | No. of Patients | % |
|---|---|---|
| Age at presentation, years | ||
| Median | 8.4 | |
| Range | 3.0-16.2 | |
| Sex ratio (male to female) | 1.7:1 | |
| Preradiotherapy chemotherapy | 109 | 52 |
| Radiotherapy alone | 98 | 48 |
| Randomly assigned to protocol | 101 | 49 |
| Treated on protocol | 106 | 51 |
| Metastatic disease at presentation* | 38 | 18 |
| Classic medulloblastoma | 174 | 84 |
| Desmoplastic/nodular variant | 14 | 6.8 |
| Large-cell/anaplastic variants | 19 | 9.2 |
Chang stage M2/3.
This study was conducted with appropriate ethics committee approval (St Jude Children's Research Hospital XPD07-107/IRB and Newcastle/North Tyneside REC 07/Q0905/71).
Assays
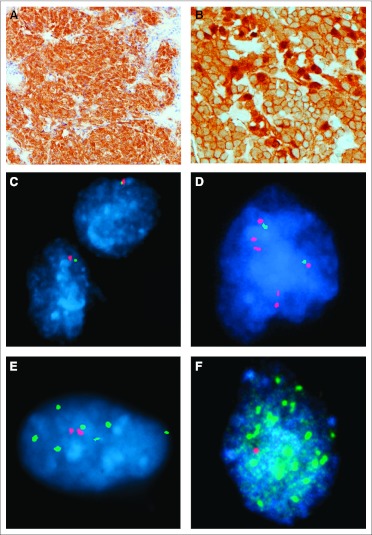
Immunohistochemistry, interphase fluorescent in situ hybridization (iFISH), DNA extraction, and CTNNB1 mutation analysis were undertaken on FFPE tissue as previously described.11,16 Wnt pathway medulloblastomas were identified by strong nuclear β-catenin immunoreactivity in one of two patterns, widespread or focal (Fig 1); either nuclear and cytoplasmic β-catenin staining combined to blanket almost all tumor cells (widespread), or nuclear β-catenin immunoreactivity was seen in cell clusters among others with weak or negligible nuclear immunoreactivity, but clearly amounting to more than 10% of tumor cells (focal). Rare tumors containing a few (< 1%) scattered cells with β-catenin nuclear immunoreactivity among cells with no discernible nuclear staining were not regarded as Wnt pathway tumors.
Fig 1.
(A) Widespread nuclear and cytoplasmic immunoreactivity for β-catenin is seen in this Wnt pathway medulloblastoma. (B) Patchy variable nuclear immunoreactivity for β-catenin characterizes this tumor, which contained a CTNNB1 mutation. (C through F) Interphase fluorescent in situ hybridization demonstrates (C) monosomy 6, (D) a 2 × 17p:6 × 17q profile, (E) gain of MYCN, and (F) amplification of MYC.
The following bacterial artificial chromosomes were used to assess copy number (CN) by iFISH: chromosome 6p22, DCDC2, RP11-72O5; chromosome 6q23, SGK1, RP11-692B5; MYC, CTD-3056O22/2267H22 (8p control, RP11-1077A8/RP11-867P15]; MYCN, RP11-355H10/RP11-348M12 (2q control, RP11-296A19/RP11-384O8); and chromosome 17p13, HIC1, RP11-357O7/RP11-806J5 (17q control, RP11-368A16/RP11-661H23). Double minute patterns or homogeneously staining regions recorded at three frequencies (< 5%, 5% to 50%, > 50% of tumor cells) defined MYC and MYCN amplification, as previously described.17 Tumors showing CN gains of MYC and MYCN (CN: one to 10 signals > control probe ≥ 2) were also recorded. Gain of 17q was defined as CN more than two. Loss of 17p was evaluated in two ways: (1) CN less than two, and (2) CN less than two or CN 17q more than 17p ≥ 2.
Statistical Analysis
Events for progression-free survival (PFS) were defined as time from start of therapy to date of progression or death on study. Events for overall survival (OS) were defined as time from start of therapy to date of death on study. Patients not experiencing an event were censored at the date of last follow-up. Survival distributions were estimated using the Kaplan-Meier method and compared between two or more groups of patients using the log-rank test. Associations between any two clinicopathologic or molecular variables of interest were tested using Fisher's exact test or Exact χ2 test. P values were not adjusted for multiplicity.
The classification and regression tree method was used to identify variables that best separate patients into different risk groups.20 It is based on successively dividing the cohort into groups of similar response patterns using covariates, splitting a node into two subgroups using the covariate that best discriminates survival outcomes on the basis of likelihood ratio test. The process stops when no covariate can split subgroups further or when subgroups have reached a specified minimum size (n = 5). The analysis was carried out using Rpart and Survival packages in R software.21
RESULTS
Of 207 patients, 133 (64%) are currently alive without disease, with median follow-up of 8.8 years. Medical events have been recorded for 77 (37%) of 207 patients, representing progressive disease in 71 of 77 children. Deaths were recorded in 74 (36%) of 207 patients, with 68 of 74 deaths resulting from disease. Death was related to complications of therapy in one patient and to a high-grade glioma presumed secondary to radiotherapy in five patients, all of whom had no evidence of residual medulloblastoma.
Clinical and Histopathologic Risk Factors for Outcome Across the Cohort
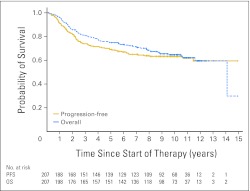
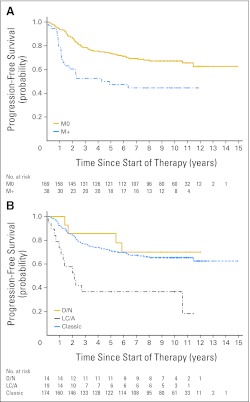
Outcome data for the cohort were as follows: PFS (5 years) = 0.69 mean ± SE 0.032, OS (5 years) = 0.75 mean ± SE 0.030; PFS (10 years) = 0.63 mean ± SE 0.046, OS (10 years) = 0.65 mean ± SE 0.045 (Appendix Fig A1, online only). Univariable survival analysis revealed that M stage, but not sex or type of adjuvant therapy, was significantly associated with PFS and OS (Table 2; Appendix Fig A2A, online only). Age analyzed as a continuous variable was not significantly associated with PFS (P = .36) or OS (P = .37). Outcomes for children with classic and desmoplastic/nodular medulloblastomas were similar, but those with LC/A tumors had a significantly poorer survival, both PFS and OS (Table 2; Appendix Fig A2B). A combination of LC/A medulloblastoma and metastatic disease at presentation displayed a particularly aggressive behavior; four of five patients experienced relapse and died within 3 years.
Table 2.
Hazard Ratios for PFS and OS in a Cox Model
| Variable | PFS |
OS |
||
|---|---|---|---|---|
| HR | P | HR | P | |
| M stage, M+ v M0 | 2.22 | .0018 | 2.25 | .002 |
| Sex, male v female | 1.45 | .13 | 1.49 | .12 |
| Therapy, RT/CT v RT | 1.26 | .32 | 1.33 | .22 |
| Pathology, LC/A v classic | 3.08 | .0002 | 3.40 | < .0001 |
| Pathology, D/N v classic | 0.80 | .67 | 0.88 | .80 |
| β-catenin IHC, nucleonegative v nucleopositive | 3.12 | .014 | 2.89 | .022 |
| CTNNB1 status, wild type v mutant | 3.29 | .044 | 3.10 | .056 |
| Chromosome 6 FISH, others v monosomy | 2.60 | .039 | 3.17 | .026 |
| MYC FISH, amplified v not amplified | 3.61 | .0058 | 3.61 | .0059 |
| MYCN FISH, amplified v not amplified | 1.11 | .84 | 1.20 | .73 |
| Chromosome 17 FISH, 17p loss v others | 1.45 | .14 | 1.49 | .12 |
| Chromosome 17 FISH, 17q gain v others | 1.13 | .62 | 1.16 | .57 |
Abbreviations: PFS, progression-free survival; OS, overall survival; HR, hazard ratio; M, metastasis; RT/CT, combined chemotherapy and radiotherapy; RT, radiotherapy; LC/A, large cell/anaplastic; D/N, desmoplastic/nodular; IHC, immunohistochemistry; FISH, fluorescent in situ hybridization.
Defining Low-Risk Medulloblastomas: Wnt Pathway Tumors
Immunohistochemistry with an anti–β-catenin antibody was undertaken in 206 of 207 patients. Of 33 (16%) of 206 tumors demonstrating nuclear immunoreactivity for β-catenin (Table 3), 21 showed strong and widespread staining (Fig 1), whereas in the remaining 12 tumors, this was patchy and either strong (n = 10) or weak (n = 2). CTNNB1 mutation analysis was feasible in 31 of 33 β-catenin nucleopositive tumors and detected in 20 of 31 (65%). CTNNB1 mutations were not detected in any β-catenin nucleonegative tumors tested (n = 164). Nearly all (31 of 33) Wnt pathway–activated medulloblastomas had a classic morphology. Of 30 of 33 tested, 24 (80%) demonstrated monosomy 6, but few showed CNAs of chromosome 17, MYC, or MYCN.
Table 3.
Clinical, Pathologic, and Cytogenetic Characteristics of β-Catenin Nucleopositive Medulloblastomas
| β-Catenin Nuclear Immunoreactivity | CTNNB1 Status | XO6 FISH | FISH MYCAmplification/Gain | FISH MYCNAmplification/Gain | XO17 FISH | Pathology | M Stage | Status | Low-Risk Group |
|---|---|---|---|---|---|---|---|---|---|
| W&S | mut (32gac>tac) | Monosomy | No | No | Normal | Classic | M0 | DoD | Yes |
| W&S | mut (32gac>gtc) | Monosomy | Amplified 5%-50% | No | Normal | Classic | M0 | DoD | No |
| W&S | mut (33tct>cct) | Monosomy | No | No | Normal | Classic | M0 | Died* | Yes |
| W&S | mut (34gga>aga) | Monosomy | No | No | Polysomy | Classic | M0 | ADF | Yes |
| W&S | mut (34gga>gaa) | Monosomy | No | No | Normal | Classic | M0 | ADF | Yes |
| W&S | mut (33tct>tgt) | Monosomy | No | No | Normal | LC/A | M0 | ADF | No |
| W&S | mut (32gac>tac) | Monosomy | No | No | Normal | Classic | M0 | ADF | Yes |
| W&S | mut (34gga>aga) | Monosomy | No | No | Normal | Classic | M0 | ADF | Yes |
| W&S | mut (33tct>ttt) | Monosomy | Gain | No | ND | Classic | M0 | ADF | Yes |
| W&S | mut (34gga>gta) | Polysomy | No | No | Polysomy | Classic | M2 | ADF | No |
| W&S | mut (32gac>tac) | Trisomy | No | Gain | Polysomy | Classic | M0 | ADF | Yes |
| W&S | mut (32gac>gtc) | ND | No | No | p loss–ploidy | LC/A | M0 | ADF | No |
| W&S | mut (33tct>tat) | ND | No | No | Normal | Classic | M0 | ADF | Yes |
| W&S | mut (32gac>aac) | ND | No | No | ND | Classic | M0 | ADF | Yes |
| W&S | wt | Monosomy | No | No | Monosomy | Classic | M0 | Died† | Yes |
| W&S | wt | Monosomy | No | No | Normal | Classic | M0 | ADF | Yes |
| W&S | wt | Monosomy | No | No | Normal | Classic | M0 | ADF | Yes |
| W&S | wt | Monosomy | No | No | Normal | Classic | M3 | ADF | No |
| W&S | wt | Normal | No | No | Normal | Classic | M0 | ADF | Yes |
| W&S | ND | Monosomy | No | No | Isodicentric 17q | Classic | M0 | ADF | Yes |
| W&S | ND | Monosomy | No | No | Normal | Classic | M0 | ADF | Yes |
| P&S | mut (33tct>ttt) | Monosomy | ND | ND | ND | Classic | M0 | ADF | Yes |
| P&S | mut (37tct>tat) | Monosomy | No | No | Normal | Classic | M0 | ADF | Yes |
| P&S | mut (34gga>aga) | Monosomy | No | No | Normal | Classic | M0 | ADF | Yes |
| P&S | mut (32gac>aac) | Monosomy | No | No | Normal | Classic | M0 | ADF | Yes |
| P&S | mut (33tct>tat) | Monosomy | No | No | Normal | Classic | M0 | ADF | Yes |
| P&S | mut (34gga>gta) | Monosomy | No | No | Normal | Classic | M0 | ADF | Yes |
| P&S | wt | Monosomy | ND | ND | ND | Classic | M3 | ADF | No |
| P&S | wt | Monosomy | No | No | Normal | Classic | M0 | ADF | Yes |
| P&S | wt | Monosomy | No | No | p loss | Classic | M0 | ADF | Yes |
| P&S | wt | Normal | No | No | Normal | Classic | M0 | ADF | Yes |
| P&W | wt | Polysomy | No | No | Polysomy | Classic | M0 | ADF | Yes |
| P&W | wt | Normal | No | No | p loss | Classic | M3 | DoD | No |
Abbreviations: FISH, fluorescent in situ hybridization; M, metastasis; W&S, widespread strong immunoreactivity; mut, mutation; DoD, died of disease; ADF, alive disease-free; LC/A, large cell/anaplastic; ND, not done; p loss–ploidy, p loss on a background of hyperploidy; wt, wild type; P&S, patchy strong immunoreactivity; P&W, patchy weak immunoreactivity.
Died as a result of high-grade glioma 11 years after diagnosis.
Died as a result of side effects of therapy 2 months after diagnosis.
iFISH analysis of two loci (DCDC2, 6p22; SGK1, 6q23) on chromosome 6 revealed a balanced profile in 79 (43%) of 185 tumors, trisomy 6 in 12 (6%) of 185, polysomy 6 (three to five copies per cell) in 64 (35%)of 185, and monosomy 6 in 27 (15%) of 185, but no evidence of specific SGK1 gain. Heterozygous deletion of the 6q locus was detected in two tumors, and focal deletion of the 6p locus was detected in one. Monosomy 6 was strongly associated with a Wnt pathway immunohistochemical profile (Table 3); 24 (89%) of 27 tumors with monosomy 6 were β-catenin nucleopositive (P < .0001). Three children with monosomy 6/β-catenin nucleonegative tumors, which were all classic medulloblastomas without MYC or MYCN amplification, are alive without disease, one despite presenting with M2 disease.
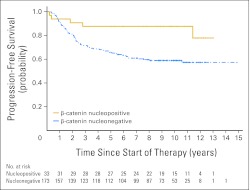
Analyzed as individual prognostic variables, nuclear immunoreactivity for β-catenin, CTNNB1 mutation, and monosomy 6 all conferred a significantly improved prognosis (Table 2). Of 33 patients with β-catenin nucleopositive tumors, only five patients (15%) have died (Appendix Fig A3, online only). However, two of five patients did not die as a result of disease; one died 11 years after diagnosis from a high-grade glioma, and the other died 2 months after diagnosis as a result of complications of therapy. Of the remaining three children, one presented with M3 disease, and one had a tumor with MYC amplification (Table 3). There was no significant difference in outcome between children with a medulloblastoma that showed widespread nuclear immunoreactivity for β-catenin and those with a tumor that showed patchy β-catenin nucleopositivity.
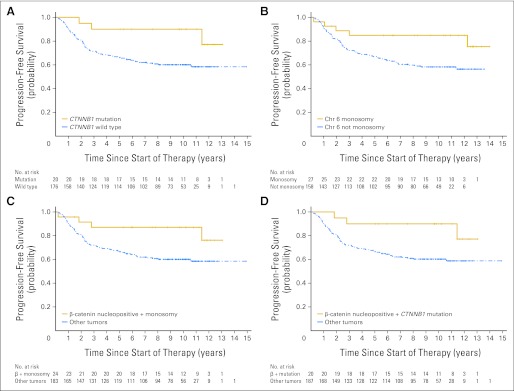
Survival analysis using these variables indicated that stratification by CTNNB1 mutation, monosomy 6, or a combination of these with β-catenin immunohistochemistry did not identify a low-risk group with better outcome than immunohistochemistry for β-catenin alone (Appendix Fig A4, online only). Other chromosome 6 CNAs were not outcome indicators. Multivariable survival analysis incorporating M status, pathologic variant, and β-catenin immunoreactivity in a Cox proportional hazards model showed that all three were independent outcome indicators (Appendix Table A1, online only).
Defining High-Risk Medulloblastomas: MYCN/MYC and Chromosome 17 CNAs
With MYCN and MYC probes, iFISH detected groups of cells with a double-minute or homogeneously staining regions pattern (Fig 1) in 11 (5.8%) of 187 and seven (3.7%) of 189 tumors, respectively (Table 4). MYCN or MYC gain (three to 10 copies per cell) was recorded in nine (4.8%) of 187 and six (3.2%) of 189 medulloblastomas, respectively. MYC amplification or gain was never detected alongside MYCN amplification or gain in any one tumor.
Table 4.
Clinical, Pathologic, and Cytogenetic Characteristics of Medulloblastomas With MYC or MYCN Amplification or Gain
| FISH MYCAmplification/Gain | FISH MYCNAmplification/Gain | β-Catenin Nuclear Immunoreactivity | CTNNB1 Status | XO6 FISH | XO17 FISH | Pathology | M Stage | Status |
|---|---|---|---|---|---|---|---|---|
| Amplified > 50% | Gain | Negative | wt | ND | p loss | LC/A | M0 | DoD |
| Amplified > 50% | Polysomy | Negative | wt | Other | Polysomy | Classic | M0 | ADF |
| Amplified > 50% | ND | Negative | ND | Other | ND | Classic | M0 | DoD |
| Amplified 5%-50% | Negative | Negative | wt | Other | Monosomy | Classic | M0 | DoD |
| Amplified 5%-50% | ND | Negative | wt | ND | Polysomy with imbalance | Classic | M3 | ADF |
| Amplified 5%-50% | Negative | W&S | mut (32gac>gtc) | Monosomy | Normal | Classic | M0 | DoD |
| Amplified < 5% | Negative | Negative | wt | Other | Isodicentric 17q | Classic | M0 | DoD |
| Gain | Negative | Negative | wt | Other | Polysomy | Classic | M0 | DoD |
| Gain | Negative | W&S | mut (33tct>ttt) | Monosomy | ND | Classic | M0 | ADF |
| Gain | Polysomy | Negative | wt | Other | Polysomy with imbalance | Classic | M3 | DoD |
| Gain | Polysomy | Negative | wt | Other | q Gain | Classic | M0 | ADF |
| Gain | Polysomy | Negative | wt | Other | Polysomy with imbalance | Classic | M0 | ADF |
| Gain | Polysomy | Negative | wt | Other | Polysomy with imbalance | Classic | M0 | ADF |
| Polysomy | Amplified > 50% | Negative | wt | Other | Polysomy with imbalance | Classic | M0 | ADF |
| Monosomy | Amplified > 50% | Negative | wt | Other | Polysomy with imbalance | LC/A | M0 | DoD |
| Negative | Amplified > 50% | Negative | wt | Other | Polysomy with imbalance | Classic | M0 | ADF |
| Negative | Amplified > 50% | Negative | wt | Other | Normal | Classic | M0 | DoD |
| ND | Amplified > 50% | Negative | wt | ND | ND | Classic | M0 | ADF |
| Negative | Amplified > 50% | Negative | wt | Other | Polysomy with imbalance | Classic | M3 | ADF |
| Negative | Amplified > 50% | Negative | wt | Other | Polysomy with imbalance | Classic | M3 | ADF |
| ND | Amplified 5%-50% | ND | wt | Other | ND | LC/A | M3 | DoD |
| Polysomy | Amplified 5%-50% | Negative | wt | Other | Polysomy with imbalance | Classic | M0 | ADF |
| Negative | Amplified < 5% | Negative | wt | Other | Normal | Classic | M0 | ADF |
| Negative | Amplified < 5% | Negative | wt | ND | Normal | D/N | M0 | DoD |
| Negative | Gain | Negative | wt | Other | Normal | LC/A | M3 | DoD |
| Negative | Gain | Negative | wt | Other | Polysomy with imbalance | Classic | M2 | ADF |
| Negative | Gain | Negative | wt | Other | Polysomy | Classic | M0 | ADF |
| Polysomy | Gain | W&S | mut (32gac>tac) | Other | Polysomy | Classic | M0 | ADF |
| Polysomy | Gain | Negative | wt | Other | Polysomy with imbalance | Classic | M0 | DoD |
| Polysomy | Gain | Negative | wt | Other | ND | Classic | M0 | ADF |
| Polysomy | Gain | Negative | wt | Other | Polysomy with imbalance | Classic | M0 | ADF |
| Polysomy | Gain | Negative | wt | Other | Polysomy | LC/A | M3 | DoD |
| Polysomy | Gain | Negative | wt | Other | Polysomy | Classic | M0 | DoD |
Abbreviations: FISH, fluorescent in situ hybridization; M, metastasis; wt, wild type; ND, not done; LC/A, large cell/anaplastic; DoD, died of disease; ADF, alive disease-free; W&S, widespread strong nuclear immunoreactivity; mut, mutation.
With chromosome 17 probes, iFISH revealed a balanced profile of chromosome 17 without ploidy change in 61 (35%) of 173 assessable tumors. CNAs observed in 112 (65%) of 173 tumors comprised isodicentric 17q (n = 29), polysomy (three to eight copies per cell; n = 24), polysomy with imbalance (CN: 17q > 17p ≥ 2; n = 47), isolated loss of 17p (n = 5), isolated gain of 17q (n = 5), and monosomy 17 (n = 2).
Across the entire cohort, only MYC amplification of the potential high-risk markers showed a significant association with outcome (Table 2). Although MYCN amplification alone or MYCN amplification/gain was not significantly associated with poor outcome, we did note that of 20 children with tumors characterized by a MYCN CNA, half of those dying as a result of disease (four of eight) had a tumor that combined MYCN amplification or gain with LC/A phenotype and with M3 disease in three of four cases. All four children died within 2 years of diagnosis.
No chromosome 17 CNA was associated with PFS or OS. Although loss of 17p defined as CN less than two showed a trend toward poor outcome, this was not significant (PFS hazard ratio = 1.45, P = .14; OS hazard ratio = 1.49, P = .12).
Models of Therapeutic Stratification
Using a step-wise approach to risk-group identification, we first defined a low-risk group of β-catenin nucleopositive tumors that excluded cases with demonstrated high-risk factors: M+ disease, LC/A phenotype, or MYC amplification (Table 3; n = 26). We then re-evaluated all variables for prognostic significance in a cohort without this low-risk group (n = 181). In univariable and multivariable analyses, M+ status, LC/A phenotype, and MYC amplification retained their association with poor outcome (Appendix Table A1), thus defining the high-risk group.
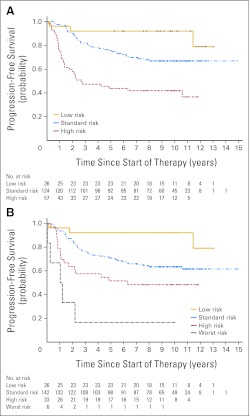
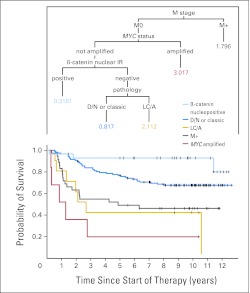
Defining low-risk and high-risk groups in this way produced three patient classes with significantly (P < .0001) different PFS curves across the entire cohort (Fig 2). In a parallel analysis encompassing the entire cohort, we explored the prognostic value of clinical, pathologic, and molecular markers with respect to PFS in a classification analysis and regression tree model, entering β-catenin immunoreactivity, pathologic variant, M status, MYC amplification, MYCN amplification, and chromosome 17 CNAs (loss of 17p or gain of 17q). MYCN amplification and chromosome 17 CNAs were not selected in any partitioning step, this alternative model supporting the selection of outcome indicators we had made according to log-rank analysis (Appendix Fig A5, online only).
Fig 2.
Progression-free survival curves for patients split into (A) three or (B) four risk categories. Low risk = M0 classic tumors without MYC amplification showing β-catenin nucleopositivity; high risk = large-cell/anaplastic (LC/A) tumors or tumors with M+ disease or MYC amplification; worst risk = LC/A tumors plus M+ disease or MYC amplification; standard risk = the remainder. Numbers along x-axis represent patients at risk of event; log-rank tests, both data sets P < .0001.
DISCUSSION
Individualization of therapy for children with medulloblastoma represents a major goal in pediatric neuro-oncology. In recent years, histopathologic and molecular disease features have been identified with the potential to provide a more refined stratification of disease risk than current clinical indices.4,7–9 However, their clinical utility has often been limited by conflicting results and analysis of small single-center or heterogeneously treated cohorts.22 We therefore undertook a comprehensive assessment of putative disease-risk biomarkers, alongside clinical and pathologic indices, in 207 medulloblastomas from children 3 to 16 years of age on the SIOP PNET3 trial. Using this approach, we report, for the first time in the context of an extensive trial cohort, the development of clinical stratification models based on validated biomarkers and on clinicopathologic features for the assignment of patients to low-risk, standard-risk, and high-risk disease groups.
We previously demonstrated that β-catenin nuclear immunoreactivity is an independent marker of favorable outcome in medulloblastoma patients from this trial cohort, a finding since validated in other independent trial cohorts.11–13 β-catenin nucleopositivity characterizes a molecular subgroup of medulloblastomas associated with activation of the Wnt signaling pathway, CTNNB1 mutations, and distinct genomic (monosomy 6) and transcriptomic signatures.11,14–16 However, the relative prognostic significance of these different subgroup markers has not been assessed. β-catenin immunoreactivity, CTNNB1 mutation, and chromosome 6 status were therefore examined in the present study, which extends our investigations of this pathway in the SIOP PNET3 cohort from 109 to 207 patients.11 β-catenin nucleopositivity was an over-arching marker of the Wnt subgroup. Chromosome 6 loss and CTNNB1 mutation each characterized overlapping subsets of β-catenin nucleopositive cases (80% and 65%, respectively) and therefore have utility as corroborative surrogate markers of pathway activation, but they did not identify any group of patients with a more favorable prognosis than β-catenin nucleopositivity alone. Nuclear β-catenin immunoreactivity is usually strong and widespread, but can be patchy, the latter present in at least 10% of cells and usually accompanying weak nuclear immunoreactivity in surrounding cells. Both immunophenotypes were associated with CTNNB1 mutation or monosomy 6 and did not show significant outcome differences. Monosomy 6 was typically present in most tumor cells, even in β-catenin nucleopositive tumors with patchy staining, suggesting monosomy 6 might occur before Wnt pathway activation in some medulloblastomas. Overall, evaluation of β-catenin immunophenotype represents the most practicable approach to defining patients with favorable-risk disease and, importantly, can be readily assessed in FFPE tissue.
Clinical variables associated with high-risk disease in univariate and multivariate analyses were LC/A phenotype and the presence of metastatic disease, validating both the expected clinical behavior of our cohort and data from other trial-based cohorts encompassing this age group.8,9 MYC gene amplification present mainly as double minutes was the only biomarker to show an association with poor outcome. Previous studies, including our own, reporting data from small or nonuniformly treated cohorts have demonstrated an association between poor outcome and combined MYC- and MYCN-amplified cases.17–19 In our series, a particularly poor prognosis was noted for tumors with coincident LC/A phenotype and MYC amplification or MYCN amplification/gain, suggesting that MYCN amplification may have prognostic significance in certain settings; however, the previously reported association between MYC or MYCN amplification and the LC/A variant was not validated in our cohort.18,23
Consistent with our previous report,11 cases with high-risk disease features, M+ disease (n = 3) or LC/A pathology (n = 2), were observed within the favorable-risk group defined by Wnt pathway activation. Their clinical behavior is uncertain. Of three Wnt-positive patients who died as a result of disease, two also displayed high-risk features. However, small numbers precluded statistical analysis of the impact of such interactions on outcome, and assessment of further cases will be required to establish their prognosis. Until such data are available, consideration of these cases as high-risk would appear prudent.
Previously reported prognostic associations in medulloblastoma could not be validated for all biomarkers presently tested in the PNET3 cohort, specifically gain of 6q at the SGK1 locus, loss of 17p, and gain of 17q.19,24,25 Such discrepancies may reflect differences in patient accrual or therapeutic factors and highlight the need for independent validation of findings from individual studies and selection of prognostic indicators that demonstrate consistent associations across multiple clinical trial cohorts.
Patients in this study cohort were treated with conventional dose (35 Gy) craniospinal radiotherapy. Further studies should be undertaken to validate the prognostic role of these pathologic and molecular markers in patient cohorts treated with reduced-dose craniospinal radiotherapy and to determine whether the impact of these prognostic factors is influenced by intensity of therapy.3
Our study has validated independent prognostic biomarkers for medulloblastomas from children 3 to 16 years of age using FFPE tissue submitted for diagnostic histopathology. Stratification models define three disease-risk groups, with significantly different outcomes, all of which can be readily distinguished by established radiologic or tissue-based diagnostic tests: (1) low-risk medulloblastomas (13% of cases), defined as β-catenin nucleopositive tumors without metastatic disease at presentation, LC/A phenotype, or MYC amplification; (2) high-risk medulloblastomas (28% of cases), defined as tumors with metastatic disease, LC/A phenotype, or MYC amplification; and (3) standard-risk medulloblastomas (59% of cases), which lack these discriminating features. Future studies must now focus on the prospective identification of these disease-risk groups in medulloblastoma clinical trials that aim to improve outcomes via the application of risk-tailored adjuvant therapies. Implementation of such trials will present significant challenges to neuro-oncologic practice, including the logistics of quality-controlled sample collection, processing, and analysis across multiple treatment centers within the approximately 30-day postsurgical period before selection and commencement of adjuvant therapy.
Supplementary Material
Appendix
Fig A1.
Progression-free survival and overall survival curves for the entire cohort (N = 207).
Fig A2.
(A) Progression-free survival (PFS) curves split by metastatic status: M0, M+; log-rank P = .0014. (B) PFS curves split by histopathologic variants: classic, desmoplastic/nodular (D/N), and large cell/anaplastic (LC/A); log-rank P = .0004.
Fig A3.
Progression-free survival curves for patients split by β-catenin nuclear immunoreactivity: nucleopositive, nucleonegative; log-rank P = .0095.
Fig A4.
Progression-free survival (PFS) plots for markers of good outcome; CTNNB1 status and chromosome (Chr) 6 copy number abnormalities alone or in combination with β-catenin immunohistochemical status do not identify a group of patients with a better outcome than children with β-catenin nucleopositive medulloblastomas. (A) PFS curves split by CTNNB1 status: mutation, wild type, log-rank P = .0325; (B) PFS curves split by chromosome 6 status, monosomy, not monosomy, log-rank P = .0327; (C) PFS curves split by a combination of β-catenin nuclear immunoreactivity and chromosome 6 status: β-catenin nucleopositive plus monosomy 6, other tumors, log-rank P = .0382; (D) PFS curves split by a combination of β-catenin nuclear immunoreactivity and CTNNB1 status: β-catenin nucleopositive plus CTNNB1 mutation, other tumors, log-rank P = .0340.
Fig A5.
Classification and regression tree analysis of outcome categories. Numbers are hazard ratios; P < .0001. M, metastasis; IR, immunoreactivity; D/N, desmoplastic or nodular; LC/A, large cell or anaplastic.
Table A1.
HR for PFS in a Cox Model
| Variable | PFS, Univariate |
PFS, Multivariate |
||
|---|---|---|---|---|
| HR | P | HR | P | |
| Total cohort, n = 206 | ||||
| Pathology, LC/A v classic or D/N | 3.13 | .0002 | 2.78 | .0013 |
| M stage, M+ v M0 | 2.22 | .0018 | 1.95 | .011 |
| β-catenin IHC, nucleonegative v nucleopositive | 3.12 | .014 | 3.01 | .034 |
| Patient cohorts with “low-risk” β-catenin nucleopositive tumors omitted (univariate, n = 181; multivariate, n = 164) | ||||
| Pathology, LC/A v classic or D/N | 2.78 | .0008 | 2.46 | .0069 |
| M stage, M+ v M0 | 1.96 | .0093 | 1.80 | .032 |
| MYC FISH, amplified v not amplified | 3.20 | .013 | 3.16 | .015 |
Abbreviations: HR, hazard ratio; PFS, progression-free survival; LC/A, large cell/anaplastic; D/N, desmoplastic/nodular; M, metastasis; IHC, immunohistochemistry; FISH, fluorescent in situ hybridization.
Footnotes
Supported by the American Lebanese Syrian Associated Charities, the Samantha Dickson Brain Tumor Trust, and Cancer Research UK. Medulloblastomas investigated in this study were provided by the United Kingdom Children's Cancer and Leukemia Group (CCLG) as part of CCLG-approved biologic study BS-2007-04.
Authors' disclosures of potential conflicts of interest and author contributions are found at the end of this article.
AUTHORS' DISCLOSURES OF POTENTIAL CONFLICTS OF INTEREST
The author(s) indicated no potential conflicts of interest.
AUTHOR CONTRIBUTIONS
Conception and design: David W. Ellison, Steven C. Clifford
Financial support: David W. Ellison, Steven C. Clifford
Administrative support: David W. Ellison, Sarah Leigh Nicholson, Steven C. Clifford
Provision of study materials or patients: David W. Ellison, Sarah Leigh Nicholson, Simon Bailey, Steven C. Clifford
Collection and assembly of data: David W. Ellison, James Dalton, Hisham Megahed, Meryl E. Lusher, Sarra L. Ryan, Sarah Leigh Nicholson, Roger E. Taylor, Simon Bailey, Steven C. Clifford
Data analysis and interpretation: David W. Ellison, Mehmet Kocak, James Dalton, Hisham Megahed, Meryl E. Lusher, Sarra L. Ryan, Wei Zhao, Roger E. Taylor, Steven C. Clifford
Manuscript writing: David W. Ellison, Mehmet Kocak, James Dalton, Hisham Megahed, Meryl E. Lusher, Sarra L. Ryan, Wei Zhao, Sarah Leigh Nicholson, Roger E. Taylor, Simon Bailey,Steven C. Clifford
Final approval of manuscript: David W. Ellison, Mehmet Kocak, James Dalton, Hisham Megahed, Meryl E. Lusher, Sarra L. Ryan, Wei Zhao, Sarah Leigh Nicholson, Roger E. Taylor, Simon Bailey, Steven C. Clifford
REFERENCES
- 1.Ellison D. Classifying the medulloblastoma: Insights from morphology and molecular genetics. Neuropathol Appl Neurobiol. 2002;28:257–282. doi: 10.1046/j.1365-2990.2002.00419.x. [DOI] [PubMed] [Google Scholar]
- 2.Gilbertson RJ, Ellison DW. The origins of medulloblastoma subtypes. Annu Rev Pathol. 2008;3:341–365. doi: 10.1146/annurev.pathmechdis.3.121806.151518. [DOI] [PubMed] [Google Scholar]
- 3.Packer RJ, Gajjar A, Vezina G, et al. Phase III study of craniospinal radiation therapy followed by adjuvant chemotherapy for newly diagnosed average-risk medulloblastoma. J Clin Oncol. 2006;24:4202–4208. doi: 10.1200/JCO.2006.06.4980. [DOI] [PubMed] [Google Scholar]
- 4.Rutkowski S, Gerber NU, von Hoff K, et al. Treatment of early childhood medulloblastoma by postoperative chemotherapy and deferred radiotherapy. Neuro Oncol. 2009;11:201–210. doi: 10.1215/15228517-2008-084. [DOI] [PMC free article] [PubMed] [Google Scholar]
- 5.Taylor RE, Bailey CC, Robinson K, et al. Results of a randomized study of preradiation chemotherapy versus radiotherapy alone for nonmetastatic medulloblastoma: The International Society of Paediatric Oncology/United Kingdom Children's Cancer Study Group PNET-3 Study. J Clin Oncol. 2003;21:1581–1591. doi: 10.1200/JCO.2003.05.116. [DOI] [PubMed] [Google Scholar]
- 6.Ellison DW, Clifford SC, Gajjar A, et al. What's new in neuro-oncology? Recent advances in medulloblastoma. Eur J Paediatr Neurol. 2003;7:53–66. doi: 10.1016/s1090-3798(03)00014-x. [DOI] [PubMed] [Google Scholar]
- 7.Pizer BL, Clifford SC. The potential impact of tumour biology on improved clinical practice for medulloblastoma: Progress towards biologically driven clinical trials. Br J Neurosurg. 2009;23:364–375. doi: 10.1080/02688690903121807. [DOI] [PubMed] [Google Scholar]
- 8.McManamy CS, Lamont JM, Taylor RE, et al. Morphophenotypic variation predicts clinical behavior in childhood non-desmoplastic medulloblastomas. J Neuropathol Exp Neurol. 2003;62:627–632. doi: 10.1093/jnen/62.6.627. [DOI] [PubMed] [Google Scholar]
- 9.Eberhart CG, Kepner JL, Goldthwaite PT, et al. Histopathologic grading of medulloblastomas: A Pediatric Oncology Group study. Cancer. 2002;94:552–560. doi: 10.1002/cncr.10189. [DOI] [PubMed] [Google Scholar]
- 10.Gilbertson RJ, Gajjar A. Molecular biology of medulloblastoma: Will it ever make a difference to clinical management? J Neurooncol. 2005;75:273–278. doi: 10.1007/s11060-005-6750-z. [DOI] [PubMed] [Google Scholar]
- 11.Ellison DW, Onilude OE, Lindsey JC, et al. Beta-Catenin status predicts a favorable outcome in childhood medulloblastoma. J Clin Oncol. 2005;23:7951–7957. doi: 10.1200/JCO.2005.01.5479. [DOI] [PubMed] [Google Scholar]
- 12.Gajjar A, Chintagumpala M, Ashley D, et al. Risk-adapted craniospinal radiotherapy followed by high-dose chemotherapy and stem-cell rescue in children with newly diagnosed medulloblastoma (St Jude Medulloblastoma-96): Long-term results from a prospective, multicentre trial. Lancet Oncol. 2006;7:813–820. doi: 10.1016/S1470-2045(06)70867-1. [DOI] [PubMed] [Google Scholar]
- 13.Fattet S, Haberler C, Legoix P, et al. Beta-catenin status in paediatric medulloblastomas: Correlation of immunohistochemical expression with mutational status, genetic profiles, and clinical characteristics. J Pathol. 2009;218:86–94. doi: 10.1002/path.2514. [DOI] [PubMed] [Google Scholar]
- 14.Thompson MC, Fuller C, Hogg TL, et al. Genomics identifies medulloblastoma subgroups that are enriched for specific genetic alterations. J Clin Oncol. 2006;24:1924–1931. doi: 10.1200/JCO.2005.04.4974. [DOI] [PubMed] [Google Scholar]
- 15.Kool M, Koster J, Bunt J, et al. Integrated genomics identifies five medulloblastoma subtypes with distinct genetic profiles, pathway signatures and clinicopathological features. PLoS One. 2008;3:e3088. doi: 10.1371/journal.pone.0003088. [DOI] [PMC free article] [PubMed] [Google Scholar]
- 16.Clifford SC, Lusher ME, Lindsey JC, et al. Wnt/Wingless pathway activation and chromosome 6 loss characterize a distinct molecular sub-group of medulloblastomas associated with a favorable prognosis. Cell Cycle. 2006;5:2666–2670. doi: 10.4161/cc.5.22.3446. [DOI] [PubMed] [Google Scholar]
- 17.Lamont JM, McManamy CS, Pearson AD, et al. Combined histopathological and molecular cytogenetic stratification of medulloblastoma patients. Clin Cancer Res. 2004;10:5482–5493. doi: 10.1158/1078-0432.CCR-03-0721. [DOI] [PubMed] [Google Scholar]
- 18.Eberhart CG, Kratz J, Wang Y, et al. Histopathological and molecular prognostic markers in medulloblastoma: C-myc, N-myc, TrkC, and anaplasia. J Neuropathol Exp Neurol. 2004;63:441–449. doi: 10.1093/jnen/63.5.441. [DOI] [PubMed] [Google Scholar]
- 19.Pfister S, Remke M, Benner A, et al. Outcome prediction in pediatric medulloblastoma based on DNA copy-number aberrations of chromosomes 6q and 17q and the MYC and MYCN loci. J Clin Oncol. 2009;27:1627–1636. doi: 10.1200/JCO.2008.17.9432. [DOI] [PubMed] [Google Scholar]
- 20.Schmoor C, Ulm K, Schumacher M. Comparison of the Cox model and the regression tree procedure in analysing a randomized clinical trial. Stat Med. 1993;12:2351–2366. doi: 10.1002/sim.4780122411. [DOI] [PubMed] [Google Scholar]
- 21.Therneau T, Atkinson EJ. Rochester, MN: Mayo Foundation; 1997. An Introduction to Recursive Partitioning Using the RPart Routines. http://www.mayo.edu/hsr/techrpt/61.pdf. [Google Scholar]
- 22.Pizer B, Clifford S. Medulloblastoma: New insights into biology and treatment. Arch Dis Child Educ Pract Ed. 2008;93:137–144. doi: 10.1136/adc.2007.136655. [DOI] [PubMed] [Google Scholar]
- 23.Stearns D, Chaudhry A, Abel TW, et al. C-myc overexpression causes anaplasia in medulloblastoma. Cancer Res. 2006;66:673–681. doi: 10.1158/0008-5472.CAN-05-1580. [DOI] [PubMed] [Google Scholar]
- 24.Pan E, Pellarin M, Holmes E, et al. Isochromosome 17q is a negative prognostic factor in poor-risk childhood medulloblastoma patients. Clin Cancer Res. 2005;11:4733–4740. doi: 10.1158/1078-0432.CCR-04-0465. [DOI] [PubMed] [Google Scholar]
- 25.Gilbertson R, Wickramasinghe C, Hernan R, et al. Clinical and molecular stratification of disease risk in medulloblastoma. Br J Cancer. 2001;85:705–712. doi: 10.1054/bjoc.2001.1987. [DOI] [PMC free article] [PubMed] [Google Scholar]
Associated Data
This section collects any data citations, data availability statements, or supplementary materials included in this article.


