

Abstract
Extracellular mechanical forces result in changes in gene expression, but it is unclear how cells are able to permanently adapt to new mechanical environments because chemical signaling pathways are short-lived. We visualize force-induced changes in nuclear rheology to examine short- and long-time genome organization and movements. Punctate labels in the nuclear interior of HeLa, human umbilical vein endothelial, and osteosarcoma (Saos-2) cells allow tracking of nuclear movements in cells under varying levels of shear and compressive force. Under adequate shear stress two distinct regimes develop in cells under mechanical stimulation: an initial event of increased intranuclear movement followed by a regime of intranuclear movements that reflect the dose of applied force. At early times there is a nondirectionally oriented response with a small increase in nuclear translocations. After 30 min, there is a significant increase in nuclear movements, which scales with the amount of shear or compressive stress. The similarities in the nuclear response to shear and compressive stress suggest that the nucleus is a mechanosensitive element within the cell. Thus, applied extracellular forces stimulate intranuclear movements, resulting in repositioning of nuclear bodies and the associated chromatin within the nucleus.
Introduction
Control of gene regulation is essential for proper cell function including DNA expression in response to the mechanical environment and external forces (1–3). Cells under mechanical stimulus show altered cell signaling and cytoskeletal organization ultimately leading to changes in cellular phenotype (4–8). The cellular response to force can occur on many timescales: intracellular chemical signals produced by stress-induced changes in the membrane, cytoskeleton, or via cell-cell connections occur on the order of seconds (9). However, microarray studies have shown that changes in gene expression occur at longer times, on the order of minutes to hours (10). Cells can also permanently adapt to altered forces, which is not possible via transient chemical signals, suggesting structural changes (7,11). The mechanisms for this long-time change in gene expression are not completely understood but changes in nuclear organization may contribute to the final gene expression profile.
Cell shear stress response not only affects the nucleus and its position in the cell, but also affects the subnuclear structures (12,13). There have been many studies on nuclear positioning within cells but few that address the subnuclear structures (14–19). The positioning and organization of the nucleus impacts genome regulation, and there is evidence that gene translocation within the nucleus leads to differential expression (20,21). The correlation of gene expression with gene position and movement within the nucleus under force suggests that there may be aspects of biorheological coupling, of strain resulting from stress, impacting gene expression. Both chromatin and intranuclear proteins diffuse throughout the nucleus but it is not clear how these diffusive states ultimately result in gene regulation (20).
Nuclei are the largest and stiffest structures inside the cell (22), particularly on longer timescales wherein cytoskeletal structures are transiently de- and repolymerized. Nuclei are force-responsive elements and stiffen by >50% in response to shear stress (23) with increasing levels of structural proteins in the nucleoskeleton (11,25). Additionally, nuclei reorient in the direction of shear stress, decrease their apical height (7), which are large-scale changes that demonstrate the link between the nucleus and the cytoskeleton and most likely affect the underlying chromatin structures in the nucleus (26,27).
In this work, we show that force on cells—from fluid shear and compressive stress—causes dose-dependent and time-dependent changes in subnuclear movement. We observe two distinct domains of nuclear movement associated with extracellular stress: an initial event of increased intranuclear movement, which is mostly independent of applied force, followed by a temporal shift at 30 min after applied force (above a threshold) and a regime of intranuclear movements, which reflect the level of applied force. From these results, we suggest that a mechanically adaptive response of the nucleus may enhance opportunity for changes in gene expression associated with mechanotransduction. This time-dependent shift in subnuclear movement may explain altered gene expression profiles and long-term changes in cell phenotype exposed to shear.
Materials and Methods
Cell culture and transfection
Human cervical cancer cells (HeLa, ATCC, Manassas, VA) and human osteosarcoma (Saos-2, ATCC, Manassas, VA) were cultured using Dulbecco's modified Eagle's medium (DMEM, Thermo Scientific, Rockford, IL) with 10% fetal bovine serum (Life Technologies, Grand Island, NY) and 1% penicillin-streptomycin (Life Technologies). Human umbilical vein endothelial cells (HUVECs, ATCC) were cultured using endothelial base media with growth supplements (Lonza, Hopkinton, MA). Cells were transfected with rDNA of fluorescent-tagged upstream binding factor one (UBF1-GFP (28)), fibrillarin (Fib-GFP). HeLa cells were transfected with Polyfect (Qiagen, Valencia, CA) per manufacturer's recommendations, media was changed after 24 h, and cells were incubated an additional 24 h before imaging. Saos-2 cells and HUVECs were transfected with Lipofectin (Life Technologies) and media was changed after 5–8 h of transfection. All cells experienced 48 h of incubation before imaging.
Shear stress and compression
Transfected cells were passaged into a micro-slide VI flow chamber (Ibidi, Verona, WI) 24 h before a shear exposure (Fig. S2 in the Supporting Material). Experiments were performed on confluent, stable monolayers. The shear stress was applied from a peristaltic pump (Instech, Plymouth Meeting, MA) through two media reservoirs to buffer the flow and through the Ibidi micro-slide. Media was preequilibrated to 37°C and 5% CO2 for a minimum of 30 min, and the entire flow apparatus was housed inside a PeCon incubator (PeCon, Erbach, Germany) on the microscope. Nuclei were labeled with 1 μg/ml Hoechst 33342 (Life Technologies) and incubated for a minimum of 30 min. Images of cells were captured at multiple sites per experiment using an automated stage every 3 min for 2 h. Due to microscope drift quality data were not consistently acquired for 2 h therefore the first-hour data were used, but the second hour of data allowed confirmation that the cells continued to be alive and healthy. Shear stress varied from 5 to 40 dyn/cm2 by altering flow rates per Ibidi manufacturer's instructions.
During compression experiments, transfected cells were seeded into 35 mm Mattek dishes and allowed to grow to confluency before the experiment (Fig. S2). The compressive pressure was applied by a 20, 50, or 100 g weight set on top of a glass coverslip above the cells. The distribution of the 100g weight led to a compressive force of 0.1 MPa. Lower compressive pressure was initially tried but did not result in measurable changes over the time period studied. Nuclei were labeled with 1 μg/ml Hoescht 33342 (Life Technologies) and with 0.3 μg/ml propidium iodide (Life Technologies) to indicate cell death and incubated for a minimum of 30 min before starting the experiments. Images were acquired every 2 min for 2 h, again only first-hour data were used but was collected to ensure healthy cells were imaged.
Three different cell lines were carefully chosen for these studies due to their preconditioned natures. HUVECs were chosen due to their ability to withstand higher levels of shear stress and Saos-2 cells were chosen as they were preconditioned to compressive stress. HeLa cells were used in both studies because they both withstood and responded to shear and compressive stress.
Microscopy
Cells were imaged on an inverted microscope (DMI6000, Leica, Buffalo Grove, IL) using a 63× (1.4 NA) oil immersion objective. During imaging the entire microscope was heated to 37°C (PeCon). Cells were viable for beyond 2 h, the duration of the experiment. To account for phototoxicity and photobleaching over the course of the experiments a time step of 3 min was used with the shear stress experiments and 2 min was used with the compressive force experiments.
Data analysis
Particle tracking image analysis was done with a custom Laptrack71 suite of programs designed in MATLAB (The MathWorks, Natick, MA) (29). Images were initially aligned to remove noise caused by cellular drift, translocation, and rotation. Translational and rotational drift were removed from sequential images using a previously published MATLAB program. First images were blurred to remove detailed information allowing for alignment to be done without flow or bright pixels dominating the alignment. Image alignment was based on a series of pairwise comparisons between sequential images as they were rotated through a series of angles and the cross-correlation value with the previous image was calculated and the x-y translation was also calculated. With the rotated images, the cross-correlation values were plotted against the angle rotated and fit with a quadratic curve. The maximum of the curve represented the angle and corresponding x-y translational coordinates used to align the image. For the system considered, this technique allowed for removal of translational and rotational drift of the nuclei preserving the subnuclear movements (30,31).
The images were then statistically segmented to select for bright spots and the spot information was restructured into particle tracks. Mean-squared displacement (MSD, Δr2) was calculated for the first hour of data taken (Eq. 1) where t is time, τ is the time lag, and x and y are the points at the given times. Between 3 and 8 different HeLa nuclei from 2–3 independent experiments were analyzed for each data set when calculating MSD. Due to the decreased number of nuclear puncta in HUVEC nuclei, a minimum of 10 and up to 20 cells were used to capture enough data for an ensemble average:
| (1) |
| (2) |
The actual MSD values often overlap one another, but the rheological trend (the slope α) is of primary importance because it describes the character of the movement within the cell. An anchored rolling regression analysis and t-test for slope was used to determine where a crossover between diffusive and enhanced diffusive response could be found (p < 0.05). If a potential crossover was identified, the data were fit with Eq. 2 to obtain values for α1 for time lags <30 min and α2 for time lags longer than 30 min. A 95% confidence interval (CI) was obtained with each fitting parameter, α1 and α2. Values of α suggest that a longer time under mechanical stimulation shows increased nuclear response. F-tests showed improvement in fit and Akaike's criteria was used to check for overfitting the data, explained further below.
Tracking organic fluorophores in biological samples results in a large number of very short trajectories. Under these conditions, fitting MSD parameters to a single trajectory results in a variety of outcomes, and we proceeded with an ensemble average of the population trajectories (32). With the distribution of data from biological samples it is also critical that no subpopulation of the data (such as minority data with high magnitudes) is biasing the results. Similar to other biological data collected in the nucleus (33,34) there were a few tracked points that provided large MSD values at 1 h (>2 standard deviations from the mean). To ensure that these were not biasing the results of the data analysis, those values were removed and the data were reanalyzed (Table 1). However, there was no change in interpretation of the results compared with the interpretation of the full data set. Additionally, to ensure that overfitting was not occurring, Akaike's information criterion (AIC) for small samples, which balances accuracy and complexity to discourage overfitting, was employed (Eq. 3). For each fit the residual sum of the squares (RSS) was calculated and the number of data points (n) and the number of parameters (K) were used to calculate AIC. The AIC values were then compared such that the preferred model is the model with the minimum AIC values:
| (3) |
Particle image velocimetry analysis was done in PIVlab (35) built on the MATLAB platform. Composite images of the Hoechst and Fib-GFP singles were made and introduced into the software. A mask was overlayed to restrict PIV analysis to the nucleus. The final PIV interrogation area was 8 pixels with a 4 pixel step. The interrogation size was chosen so that the cell was not obscured but the PIV analysis still displayed a nice covering of the nucleus.
Table 1.
Measured properties of intranuclear dynamics: values of α with a 95% CI calculated by fitting MSD curve to Eq. 2
| HeLa Shear Stress | α ± CI | αearly± CI | αlate± CI | HeLa compression | α ± CI | αearly± CI | αlate± CI |
|---|---|---|---|---|---|---|---|
| 5 dyn/cm2b | 1.01 ± 0.05 | 1.00 ± 0.05 | 0.99 ± 0.15 | Controla | 1.69 ± 0.18 | 1.02 ± 0.10 | 2.01 ± 0.21 |
| 10 dyn/cm2a | 1.28 ± 0.06 | 1.06 ± 0.04 | 1.42 ± 0.06 | 0.1 MPaa | 1.21 ± 0.09 | 0.78 ± 0.03 | 1.47 ± 0.05 |
| HUVEC Shear Stress | Saos-2 compression | ||||||
| Controla | 1.02 ± 0.14 | 0.65 ± 0.05 | 1.43 ± 0.17 | Controla | 0.78 ± 0.05 | 0.59 ± 0.02 | 0.97 ± 0.07 |
| 5 dyn/cm2b | 0.90 ± 0.04 | 0.93 ± 0.09 | 0.82 ± 0.10 | 0.1 MPaa | 1.36 ± 0.08 | 0.99 ± 0.07 | 1.54 ± 0.10 |
| 10 dyn/cm2b | 0.69 ± 0.04 | 0.67 ± 0.07 | 0.60 ± 0.11 | ||||
| 20 dyn/cm2a | 0.80 ± 0.04 | 0.69 ± 0.07 | 0.77 ± 0.06 | ||||
| 40 dyn/cm2a | 1.00 ± 0.07 | 0.73 ± 0.06 | 1.01 ± 0.14 |
Improved fitting was tested for using an F-test (a indicates improved fit, p < 0.01) and AIC was used to test for overfitting when using two equations to fit the data instead of a single equation (b indicates overfitting).
Results
Particle tracking in the nuclear interior
Cells were transfected with UBF1-GFP, which binds rDNA upstream of the polymerase I complex and produces a punctate appearance in the nucleus or Fib-GFP (Fig. S1) (36). We measured the movements of these fiducial points in the nucleus of living cells for an hour (Fig. 1). We tracked individual fiducial points using a custom-developed particle tracking algorithm (30), which computationally accounts for artifacts associated with cell movements including rigid body rotation and translocation (Fig. 1). The algorithm also statistically segments individual tracks, monitors their movements, and removes errors from errant tracks from out of plane. Motions of UBF1-GFP or Fib-GFP were imaged every 3 min for 1 h under shear stress and every 2 min for 1 h under compressive stress on the order of 0.1 MPa, similar to the compressive force often found on bones and cartilage (37,38). These motions were then processed to determine the MSD or of intranuclear movements (Fig. 1). The majority of the processed particle tracks show subdiffusive movement over the course of the 1 h experiment, particularly compared with cytoplasmic movements (39).
Figure 1.
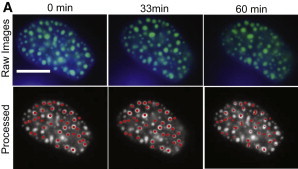
Intranuclear markers reorganize over time. (A) Top row shows raw data taken from a UBF1-GFP cell under 10 dyn/cm2 shear stress for 1 h. The bottom row shows corresponding images of the cell after the drift was removed and the cell was statistically segmented for particle track construction. The final panel shows the tracks of the particles from the initial image. Hoechst (blue) was used to stain the chromatin. UBF1-GFP is shown in green. Scale bars are 10 μm.
To determine if data obtained by UBF1 labeling were appropriate for global intranuclear movements, we also examined rheological profiles using Fib-GFP as a fiducial microrheological marker (Fig. S1). Functionally, UBF1 is involved with chromatin decondensation before transcriptional processes (36), whereas fibrillarin is involved in the processing of preribosomal RNA in the nucleolus (40). Nucleolar markers were chosen because the DNA packs tightly around the nucleolus such that measurements are of small microenvironments (Fig. S6 and Table S1). Changes in nucleolar movement could also be associated with a decondensation of this DNA potentially before changes in gene expression (27). UBF1 in cells that are stressed or cancerous can display a more dispersed phenotype, allowing for more intranuclear fiducial points (41). Fib-GFP showed statistically similar results as UBF1-GFP (Fig. 2). However, Fib-GFP provided only 3–8 trackable markers per HUVEC and HeLa cell, whereas UBF1-GFP provided on average 20 trackable points per HeLa and Saos-2 cell. Thus, although statistically similar to the result for HeLa and HUVECs (Fig. 2 B), UBF1-GFP allows for better statistical comparison and analysis of spatial heterogeneity.
Figure 2.
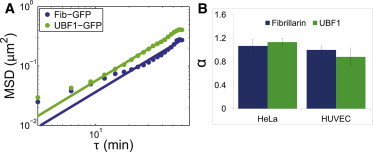
Comparison of intranuclear markers under shear stress. (A) HeLa cells transfected with UBF1-GFP or Fib-GFP and exposed to 20 dyn/cm2 shear stress for 1 h show similar slopes. (B) Anomalous fits of MSD versus time (α) show no statistical difference, suggesting the movements of both markers reflect global movement rather than label-specific movements. Error bars are 95% CIs.
Quantitative comparison of intranuclear movements
To quantify the magnitude of subnuclear movements, we calculated MSD under varying conditions and with HeLa, Saos-2, and HUVEC cells. We then fit the MSD versus time curves to the anomalous diffusion equation and calculated the time-dependent exponent α. Anomalous analysis was chosen because it more accurately describes the data than a linear fit and is more appropriate for long time steps (32). Values of α < 1 indicate a subdiffusive regime, α = 1 indicates a Brownian diffusive regime, and values α > 1 indicate an enhanced diffusion regime caused by molecular motors or extracellular force (see Methods and the Supporting Material). Fig. 3 shows MSD versus time for HeLa and HUVEC cells in response to shear or compressive stress. The general trend of α showed increased extracellular mechanical force caused increased α, suggesting a relationship between extracellular force and intranuclear movement. HeLa cells show an increased α with either shear stress or compressive stress (Fig. 3 B, Table 1). HUVEC cells show a similar trend of increasing MSD with increased shear stress, with the exception of 5 dyn/cm2 shear stress, which show no changes in nuclear movements suggestive of a low shear stress response.
Figure 3.
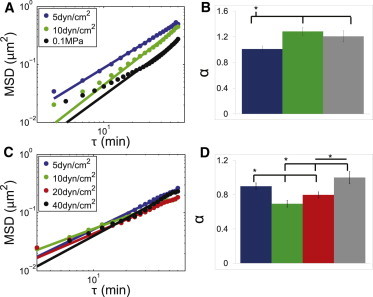
MSD profiles of HeLa and HUVEC cells with extracellular force. (A) MSD plots of HeLa cells under varying shear stress and compressive force (blue 5 dyn/cm2, green 10 dyn/cm2, black/gray 0.1 MPa compressive stress). Values are of similar magnitude at different lag times regardless of the amount of applied shear. Compressive stress shows a decrease in intranuclear movement compared with response to shear stress. (B) The corresponding values for α for HeLa cells under shear stress and compression. (C) HUVEC under varying shear stress (blue 5 dyn/cm2, red 10 dyn/cm2, green 20 dyn/cm2, black/gray 40 dyn/cm2). Similar to the HeLa cell results the HUVECs show very little change in magnitude at different lag times with changes in shear stress. (D) The corresponding values for α for HUVEC cells under shear stress. Stars indicate significance based on computed 95% CI. Error bars on B and D are 95% CIs.
Orientation and heterogeneity of subnuclear movements
PIV analysis provides discrete information of these subnuclear particle tracks including directional information and spatial distribution of the movements (Fig. 4). After initial application of 40 dyn/cm2 shear stress to HUVECs (early, 15 min), there is an increase in movement of the nuclear interior (long arrows in Fig. 4, early) but without a clear directionality. After 30 min of shear stress the intranuclear response begins to show a strongly oriented response with or against the direction of the shear stress (mostly blue in Fig. 4, late). The changes in PIV from early to late times suggested transitions of intranuclear movements, and prompted further study of the quantitative change in MSD under shear stress.
Figure 4.
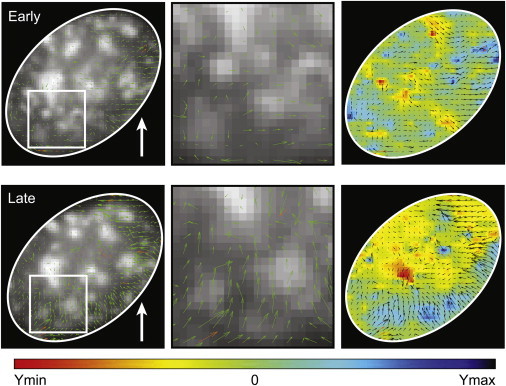
Analysis of subnuclear movements shows temporal and spatial changes in movement. Fib-GFP signals in HUVEC sheared at 40 dyn/cm2 for 1 h were processed by PIV. Magnitude and direction of movement (green arrows) were overlaid for early shear stress (15 min postshear) and late shear stress (33 min) for the whole nucleus and for a zoom into a peripheral section. Color maps of binned regions within the nucleus shows movements in the direction of flow (blue, Ymax) versus against the direction of flow (red, Ymin). In the early regime there are movements in and against the direction of flow (equal red and blue). At long times, the nuclear movements, particularly at the edge, show an increased movement in the direction of flow (Ymax). Three cells were analyzed and representative images from a single cell are shown here.
Force response of the genome
A single slope of MSD versus time did not fit all of the data, and we observed increased deviation with increased applied stress, evident in Figs. 2 and 3. We used an anchored rolling regression analysis to determine fitting of the MSD versus time data to two distinct slopes versus one (see Methods). From this statistical analysis (in Table 1; see Methods), we observed a quantitative change in slope α after 30 min of applied shear (Table 1, a indicates improved fit, p < 0.01; b indicates overfitting). The data were then refit with two anomalous diffusion equations, α1 for early time and α2 for late time (Fig. 5). Generally, α1 (timescales shorter than 30 min) was <α2 (timescales longer than 30 min), suggesting increases in intranuclear movements around this regime change. Comparison of fits by their 95% CIs (Table 1) highlights that this temporal shift in shear stress response only occurs in excess of a threshold shear stress or compressive force. At low levels of shear stress—under 10 dyn/cm2 for HeLa and under 20 dyn/cm2 for HUVEC—the cells showed a constant α. For cells above this threshold shear stress, the statistical crossover regime between the diffusive behavior and enhanced diffusive behavior occurred consistently at 30 ± 6 min of time lag. Additionally, residuals were plotted and showed that with the improved fitting of the data with two anomalous diffusion equations order among the residual was eliminated, suggesting proper fitting of the data (Fig. S4).
Figure 5.
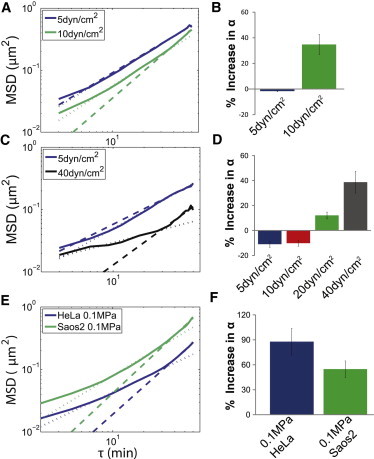
MSD shows temporal nuclear response to shear stress and compression. (A) HeLa cells with 5 dyn/cm2 shear stress (blue) do not show a regime change, whereas HeLa cells 10 dyn/cm2 shear stress (green) do show a regime change. For figures A, C, and E the solid line corresponds to MSD data, the dotted lines are fitted values for time lag <30 min, and the dashed lines are fitted values for time lag >30 min. (B) The percent difference in the α values for the HeLa cells using a crossover time of 30 min. The 5 dyn/cm2 shows very little change consistent with there being no obvious crossover time, however the 10 dyn/cm2 data show an ∼40% increase. The HeLa cell 5 dyn/cm2 data were well fit by a single MSD curve, however at higher levels of shear stress 10 dyn/cm2 the cells showed the biphasic response suggestive of an adaptation to shear stress. (C) HUVECs under 5 dyn/cm2 shear stress (blue) do not show a regime change, whereas HUVECs with 40 dyn/cm2 shear stress (green) do show a regime change. (D) The percent difference in the α values using a crossover time of 30 min. The 5 and 10 dyn/cm2 data show very little change consistent with there being no obvious crossover time; however, the 20 and 40 dyn/cm2 data show a 15–35% increase. The HUVEC data are more tightly clustered than the HeLa cell data so the crossover time is still significant, although the percent difference is lower (Table 1). The HUVEC data were well fit by a single MSD curve at 5 and 10 dyn/cm2 and an improved fit was found at 20 and 40 dyn/cm2 using the biphasic fit. The HUVEC data showed decreased MSD magnitude in response to shear stress compared to the HeLa cell data possibly due to HUVECs being preconditioned to manage shear stress. (E) HeLa cell and Saos-2 data with regime change and 0.1 MPa compressive stress. HeLa cells with 0.1 MPa (blue) and Saos-2 cells with 0.1 MPa (green). (F) The percent difference in the α values using a crossover time of 30 min. The Saos-2 cells show ∼50% increase in α, whereas the HeLa cells show a nearly 100% increase in α under 0.1 MPa of compressive stress from a 100 g weight. The attenuated response by the Saos2 cells could be from that cell line being conditioned to receive compressive force.
Compressive stress of 0.1 MPa was also considered using both HeLa and Saos-2 cells (Fig. 5, E and F); this compressive stress was chosen for its ability to elicit a measurable subcellular response over the time frame of interest. Approximately 0.1 MPa was chosen for its biological relevance to osteoblasts (38), chondrocytes (37), and mesenchymal stem cells during mechanically induced differentiation (42). Over 0.1 MPa compressive stress, both HeLa and Saos-2 cells show a biphasic response similar to the shear stress response with a transition in particle movement at 30 min (Fig. 6, Table 1). The similarities in response between compression and shear stress suggest a universal nuclear response to extracellular force.
Figure 6.
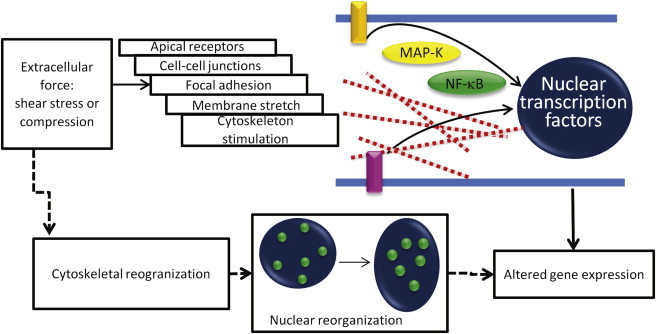
Mechanical stimuli in cells and underlying nuclear changes. Stimulation of subnuclear changes and potentially gene expression in cells in response to extracellular force has been studied via intracellular chemical pathway. Previously, extracellular force has been shown to affect apical receptors, cell-cell junctions, membrane stretch receptors, focal adhesions, and cytoskeleton components (55). Furthermore, extracellular stimulation has been shown to cause upregulation of MAP kinases and localization of NFκB to the nucleus (56). Here, we show a direct link between extracellular shear stress and intranuclear movements. This study suggests that on the timescale that the cytoskeleton begins to remodel, and the nucleus becomes intracellularly chemically stimulated, there is an accompanying intranuclear softening allowing for increased intranuclear movement. This increased movement could provide an environment that is conducive to altering gene expression allowing different chromatin regions access to transcription factories within the nucleus.
Discussion
Here, we have demonstrated that there are active subnuclear movements in response to shear and compressive stress. Rather than capture high-frequency behavior, we imaged intranuclear movements on a timescale relevant for nuclear reorganization (43) and changes in gene expression, as suggested by prior microarray analysis (10). We adopted a time step of 2–3 min for data acquired over 1–2 h to avoid phototoxicity of the cells and photobleaching of the GFP probes (Fig. 1). Additionally, the three different cell lines were carefully chosen for these studies due to their preconditioned natures, HUVECs to shear stress, Saos2 to compressive stress, and HeLa cells as a well-studied cell line for both stresses. The nucleus is part of a larger system and is connected to the cytoskeleton. Although individual nuclei show movement relative to the whole cell system over the time course described, it is the subnuclear movement that is of interest in understanding nuclear dynamic response to mechanical stimulation and changes in gene expression (44). Toward this understanding we focused our efforts on the relative subnuclear movement and not the movement of the nucleus within the cell system. For that reason we do see nuclear movement in the cells on the order of min, but how the subnuclear response is included is unclear. Furthermore, individual nucleoli may show large shifts with respect to movement of the whole cell but we were primarily interested in how they responded to their individual microenvironment.
Previous studies of nuclear movements show a variety of behaviors including subdiffusion, enhanced diffusion, and corralled motion (45). Both UBF1-GFP and Fib-GFP in the nuclei showed a range of motions: diffusion, subdiffusion, and enhanced diffusion (Fig. S3 HUVECs expressing Fib-GFP with 20 dyn/cm2 shear stress). This range of α values from the fit of MSD versus time, from near zero indicating little to no motion to 2.8 indicating enhanced diffusion suggestive of molecular motors or aid of other cellular processes, were also seen in all cases studied.
With sufficient force nuclear response appears to occur in two distinct temporal regimes (Fig. 5). After initiation of stress, the response is independent of the level of applied stress and has little directional correlation. At ∼30 min of sustained stress there is a statistical shift in intranuclear responses correlated with a directionalized response. After ∼30 min of sustained stress over a threshold level, intranuclear movements are responsive to the amount of force.
At low shear stress cell process alter intranuclear movement
Low shear stress in the vasculature system (<10 dyn/cm2) modulates endothelial genome response, altering cellular processes (46). Previously, net forward shear stress of 5 dyn/cm2 showed increased cell migration relative to 15 dyn/cm2 shear stress (47,48). Consistent with these results the increased intranuclear movement seen at 5 dyn/cm2 in HUVECs is likely correlated with overall cell movement and is also consistent with the increased intranuclear movement in the static controls. Generally, higher levels of shear (>10 dyn/cm2) and compressive stress are required to decrease cell migration and stimulate increased intranuclear movement in HUVEC and HeLa cells. This is particularly true for compressive stress as there is an additional apical substrate for the cell to interact with causing additional migratory processes (Fig. S5). Furthermore, chemical signaling from NFκb is not seen until a threshold level of shear stress of 10 dyn/cm2 is used (49). The different cellular functions that varying levels of shear stress can elicit make it difficult to compare between the low shear stress and high shear stress populations. The remainder of the discussion will focus on high shear stress results and the biphasic regime they elicit.
At high shear stress intranuclear movements reflect passive and active genome movement
We suggest that the initial phase of nuclear movements (<30 min) reflects a stress response of the cell in response to a combination of chemical cellular signals. After ∼30 min the nucleus undergoes an increase in intranuclear movement, as seen from the MSD (Fig. 5) and PIV (Fig. 4) data, which both show changes in magnitude and direction of the movement. In the late time regime (>30 min), we observed an increase in the intranuclear movement with increasing shear stress in HUVECs. The increased intranuclear movement may suggest decondensation of the tightly packed DNA near the nucleoli or changes in actin structures that are directly connected to the nucleus such as the TAN lines (16,17). Additionally, rotation of the nucleus has been shown to occur persistently for tens of minutes but be random over longer times (17). The whole nuclear response and translocation could also contribute the larger movements at the nuclear periphery on the order of minutes. At longer times, on the order of hours, changes in heterochromatin structures and concentration and localization of lamins (23,11) are observed and begin on the order of minutes and may have an increased impact on intranuclear response.
Mechanotransduction and the nuclear response to force
Mechanotransduction is the process by which external stimuli cause cellular responses, typically related to chemical signals in the cytoplasm affecting transcription. However, factors such as NF-κB show transient translocations to the nucleus within 30 min of beginning shear stress (49). Long-term changes in gene expression, beyond stimulation by chemical signaling, are needed to regulate cell behavior in a new mechanical environment.
Nuclei are connected to the cytoskeleton through the LINC complex: DNA and chromatin connects with the nucleoskeleton at the inner nuclear membrane, SUN proteins cross the nuclear membrane to nesprin proteins on the cytoplasmic face of the nuclear membrane, and nesprins connect with cytoskeletal elements including actin, microtubules, and intermediate filaments (50,51). Thus, mechanical connections from the cell may transduce global forces into the genome (3,52). Timescales for cytoskeletal reorganization in response to extracellular force, in addition to other cellular chemical signals, are consistent with the crossover time identified for intranuclear reorganization in response to mechanical stimulus (53).
We suggest that force-induced changes in nuclear architecture could be related to the changes in gene expression measured by microarray analysis in cells under shear stress for long times (Figs. 5 and 6) (54). This study suggests that on the timescale that the cytoskeleton begins to remodel, and the nucleus becomes intracellularly chemically stimulated, there is an accompanying intranuclear softening allowing for increased intranuclear movement. This increased movement could provide an environment that is conducive to altering gene expression allowing different chromatin regions access to transcription factories within the nucleus. In this work we showed a threshold and temporal response to extracellular mechanical force that correlates with changes in chemical cell signaling and with changes in cytoskeletal processes and these changes could stimulate changes in chromatin organization resulting in adaptive gene expression.
Acknowledgments
This work was made possible in part by the National Science Foundation: CBET 0954421 CAREER to K.N.D. and MCB-1052660 to G.Y. Additional thanks to Stephen Spagnol, Alexandre Riberio, and Agnieszka Kalinowski for their helpful discussions.
Supporting Material
References
- 1.Baker E.L., Bonnecaze R.T., Zaman M.H. Extracellular matrix stiffness and architecture govern intracellular rheology in cancer. Biophys. J. 2009;97:1013–1021. doi: 10.1016/j.bpj.2009.05.054. [DOI] [PMC free article] [PubMed] [Google Scholar]
- 2.Discher D.E., Janmey P., Wang Y.L. Tissue cells feel and respond to the stiffness of their substrate. Science. 2005;310:1139–1143. doi: 10.1126/science.1116995. [DOI] [PubMed] [Google Scholar]
- 3.Wang N., Tytell J.D., Ingber D.E. Mechanotransduction at a distance: mechanically coupling the extracellular matrix with the nucleus. Nat. Rev. Mol. Cell Biol. 2009;10:75–82. doi: 10.1038/nrm2594. [DOI] [PubMed] [Google Scholar]
- 4.Galbraith C.G., Skalak R., Chien S. Shear stress induces spatial reorganization of the endothelial cell cytoskeleton. Cell Motil. Cytoskeleton. 1998;40:317–330. doi: 10.1002/(SICI)1097-0169(1998)40:4<317::AID-CM1>3.0.CO;2-8. [DOI] [PubMed] [Google Scholar]
- 5.Traub O., Berk B.C. Laminar shear stress: mechanisms by which endothelial cells transduce an atheroprotective force. Arterioscler. Thromb. Vasc. Biol. 1998;18:677–685. doi: 10.1161/01.atv.18.5.677. [DOI] [PubMed] [Google Scholar]
- 6.Minamino T., Komuro I. Vascular cell senescence: contribution to atherosclerosis. Circ. Res. 2007;100:15–26. doi: 10.1161/01.RES.0000256837.40544.4a. [DOI] [PubMed] [Google Scholar]
- 7.Hazel A.L., Pedley T.J. Vascular endothelial cells minimize the total force on their nuclei. Biophys. J. 2000;78:47–54. doi: 10.1016/S0006-3495(00)76571-4. [DOI] [PMC free article] [PubMed] [Google Scholar]
- 8.Lee J.S., Panorchan P., Wirtz D. Ballistic intracellular nanorheology reveals ROCK-hard cytoplasmic stiffening response to fluid flow. J. Cell Sci. 2006;119:1760–1768. doi: 10.1242/jcs.02899. [DOI] [PubMed] [Google Scholar]
- 9.Davies P.F., Barbee K.A., Barakat A.I. Spatial relationships in early signaling events of flow-mediated endothelial mechanotransduction. Annu. Rev. Physiol. 1997;59:527–549. doi: 10.1146/annurev.physiol.59.1.527. [DOI] [PubMed] [Google Scholar]
- 10.Brooks A.R., Lelkes P.I., Rubanyi G.M. Gene expression profiling of human aortic endothelial cells exposed to disturbed flow and steady laminar flow. Physiol. Genomics. 2002;9:27–41. doi: 10.1152/physiolgenomics.00075.2001. [DOI] [PubMed] [Google Scholar]
- 11.Philip J.T., Dahl K.N. Nuclear mechanotransduction: response of the lamina to extracellular stress with implications in aging. J. Biomech. 2008;41:3164–3170. doi: 10.1016/j.jbiomech.2008.08.024. [DOI] [PubMed] [Google Scholar]
- 12.Hale C.M., Chen W.C., Wirtz D. SMRT analysis of MTOC and nuclear positioning reveals the role of EB1 and LIC1 in single-cell polarization. J. Cell Sci. 2011;124:4267–4285. doi: 10.1242/jcs.091231. [DOI] [PMC free article] [PubMed] [Google Scholar]
- 13.Lee J.S., Chang M.I., Wirtz D. Cdc42 mediates nucleus movement and MTOC polarization in Swiss 3T3 fibroblasts under mechanical shear stress. Mol. Biol. Cell. 2005;16:871–880. doi: 10.1091/mbc.E03-12-0910. [DOI] [PMC free article] [PubMed] [Google Scholar]
- 14.Wu J., Lee K.C., Lele T.P. How dynein and microtubules rotate the nucleus. J. Cell. Physiol. 2011;226:2666–2674. doi: 10.1002/jcp.22616. [DOI] [PubMed] [Google Scholar]
- 15.Wu J., Misra G., Dickinson R.B. Effects of dynein on microtubule mechanics and centrosome positioning. Mol. Biol. Cell. 2011;22:4834–4841. doi: 10.1091/mbc.E11-07-0611. [DOI] [PMC free article] [PubMed] [Google Scholar]
- 16.Luxton G.W., Gomes E.R., Gundersen G.G. TAN lines: a novel nuclear envelope structure involved in nuclear positioning. Nucleus. 2011;2:173–181. doi: 10.4161/nucl.2.3.16243. [DOI] [PMC free article] [PubMed] [Google Scholar]
- 17.Folker E.S., Ostlund C., Gundersen G.G. Lamin A variants that cause striated muscle disease are defective in anchoring transmembrane actin-associated nuclear lines for nuclear movement. Proc. Natl. Acad. Sci. USA. 2011;108:131–136. doi: 10.1073/pnas.1000824108. [DOI] [PMC free article] [PubMed] [Google Scholar]
- 18.Ji J.Y., Lee R.T., Lammerding J. Cell nuclei spin in the absence of lamin b1. J. Biol. Chem. 2007;282:20015–20026. doi: 10.1074/jbc.M611094200. [DOI] [PubMed] [Google Scholar]
- 19.Lombardi M.L., Lammerding J. Keeping the LINC: the importance of nucleocytoskeletal coupling in intracellular force transmission and cellular function. Biochem. Soc. Trans. 2011;39:1729–1734. doi: 10.1042/BST20110686. [DOI] [PMC free article] [PubMed] [Google Scholar]
- 20.Misteli T. Beyond the sequence: cellular organization of genome function. Cell. 2007;128:787–800. doi: 10.1016/j.cell.2007.01.028. [DOI] [PubMed] [Google Scholar]
- 21.Gasser S.M. Positions of potential: nuclear organization and gene expression. Cell. 2001;104:639–642. doi: 10.1016/s0092-8674(01)00259-8. [DOI] [PubMed] [Google Scholar]
- 22.Dahl K.N., Kahn S.M., Discher D.E. The nuclear envelope lamina network has elasticity and a compressibility limit suggestive of a molecular shock absorber. J. Cell Sci. 2004;117:4779–4786. doi: 10.1242/jcs.01357. [DOI] [PubMed] [Google Scholar]
- 23.Deguchi S., Maeda K., Sato M. Flow-induced hardening of endothelial nucleus as an intracellular stress-bearing organelle. J. Biomech. 2005;38:1751–1759. doi: 10.1016/j.jbiomech.2005.06.003. [DOI] [PubMed] [Google Scholar]
- 24.Reference deleted in proof.
- 25.Lee J.S., Hale C.M., Wirtz D. Nuclear lamin A/C deficiency induces defects in cell mechanics, polarization, and migration. Biophys. J. 2007;93:2542–2552. doi: 10.1529/biophysj.106.102426. [DOI] [PMC free article] [PubMed] [Google Scholar]
- 26.Guelen L., Pagie L., van Steensel B. Domain organization of human chromosomes revealed by mapping of nuclear lamina interactions. Nature. 2008;453:948–951. doi: 10.1038/nature06947. [DOI] [PubMed] [Google Scholar]
- 27.van Koningsbruggen S., Gierlinski M., Lamond A.I. High-resolution whole-genome sequencing reveals that specific chromatin domains from most human chromosomes associate with nucleoli. Mol. Biol. Cell. 2010;21:3735–3748. doi: 10.1091/mbc.E10-06-0508. [DOI] [PMC free article] [PubMed] [Google Scholar]
- 28.Pajerowski J.D., Dahl K.N., Discher D.E. Physical plasticity of the nucleus in stem cell differentiation. Proc. Natl. Acad. Sci. USA. 2007;104:15619–15624. doi: 10.1073/pnas.0702576104. [DOI] [PMC free article] [PubMed] [Google Scholar]
- 29.Yang, G., A. Matov, and G. Danuser. 2005. Reliable tracking of large scale dense antiparallel particle motion for fluorescence live cell imaging. IEEE Computer Society Conference on Computer Vision and Pattern Recognition (CVPR'05). IEEE Computer Society, San Diego, CA. 138.
- 30.Yang G., Cameron L.A., Danuser G. Regional variation of microtubule flux reveals microtubule organization in the metaphase meiotic spindle. J. Cell Biol. 2008;182:631–639. doi: 10.1083/jcb.200801105. [DOI] [PMC free article] [PubMed] [Google Scholar]
- 31.Mitchison T.J., Maddox P., Kapoor T.M. Bipolarization and poleward flux correlate during Xenopus extract spindle assembly. Mol. Biol. Cell. 2004;15:5603–5615. doi: 10.1091/mbc.E04-05-0440. [DOI] [PMC free article] [PubMed] [Google Scholar]
- 32.Michalet X. Mean square displacement analysis of single-particle trajectories with localization error: Brownian motion in an isotropic medium. Phys. Rev. E Stat. Nonlin. Soft Matter Phys. 2010;82:041914. doi: 10.1103/PhysRevE.82.041914. [DOI] [PMC free article] [PubMed] [Google Scholar]
- 33.De Vos W.H., Houben F., Van Oostveldt P. Increased plasticity of the nuclear envelope and hypermobility of telomeres due to the loss of A-type lamins. Biochim. Biophys. Acta. 2010;1800:448–458. doi: 10.1016/j.bbagen.2010.01.002. [DOI] [PubMed] [Google Scholar]
- 34.Shav-Tal Y., Darzacq X., Singer R.H. Dynamics of single mRNPs in nuclei of living cells. Science. 2004;304:1797–1800. doi: 10.1126/science.1099754. [DOI] [PMC free article] [PubMed] [Google Scholar]
- 35.Thielicke, W., and E. J. Stamhuis. 2012. PIVlab - Time-Resolved Digital Particle Image Velocimetry Tool for MATLAB. PIVver. 1.32.
- 36.Chen D., Belmont A.S., Huang S. Upstream binding factor association induces large-scale chromatin decondensation. Proc. Natl. Acad. Sci. USA. 2004;101:15106–15111. doi: 10.1073/pnas.0404767101. [DOI] [PMC free article] [PubMed] [Google Scholar]
- 37.Fermor B., Weinberg J.B., Guilak F. The effects of static and intermittent compression on nitric oxide production in articular cartilage explants. J. Orthop. Res. 2001;19:729–737. doi: 10.1016/S0736-0266(00)00049-8. [DOI] [PubMed] [Google Scholar]
- 38.Sanchez J.A., Wangh L.J. New insights into the mechanisms of nuclear segmentation in human neutrophils. J. Cell. Biochem. 1999;73:1–10. doi: 10.1002/(sici)1097-4644(19990401)73:1<1::aid-jcb1>3.0.co;2-s. [DOI] [PubMed] [Google Scholar]
- 39.Massiera G., Van Citters K.M., Crocker J.C. Mechanics of single cells: rheology, time dependence, and fluctuations. Biophys. J. 2007;93:3703–3713. doi: 10.1529/biophysj.107.111641. [DOI] [PMC free article] [PubMed] [Google Scholar]
- 40.Bártová E., Horáková A.H., Kozubek S. Structure and epigenetics of nucleoli in comparison with non-nucleolar compartments. J. Histochem. Cytochem. 2010;58:391–403. doi: 10.1369/jhc.2009.955435. [DOI] [PMC free article] [PubMed] [Google Scholar]
- 41.Boulon S., Westman B.J., Lamond A.I. The nucleolus under stress. Mol. Cell. 2010;40:216–227. doi: 10.1016/j.molcel.2010.09.024. [DOI] [PMC free article] [PubMed] [Google Scholar]
- 42.Kim S.H., Choi Y.R., Lee J.W. ERK 1/2 activation in enhanced osteogenesis of human mesenchymal stem cells in poly(lactic-glycolic acid) by cyclic hydrostatic pressure. J. Biomed. Mater. Res. A. 2007;80:826–836. doi: 10.1002/jbm.a.30945. [DOI] [PubMed] [Google Scholar]
- 43.Mehta I.S., Eskiw C.H., Bridger J.M. Farnesyltransferase inhibitor treatment restores chromosome territory positions and active chromosome dynamics in Hutchinson-Gilford progeria syndrome cells. Genome Biol. 2011;12:R74. doi: 10.1186/gb-2011-12-8-r74. [DOI] [PMC free article] [PubMed] [Google Scholar]
- 44.Tseng Y., Lee J.S., Wirtz D. Micro-organization and visco-elasticity of the interphase nucleus revealed by particle nanotracking. J. Cell Sci. 2004;117:2159–2167. doi: 10.1242/jcs.01073. [DOI] [PubMed] [Google Scholar]
- 45.Marshall W.F., Straight A., Sedat J.W. Interphase chromosomes undergo constrained diffusional motion in living cells. Curr. Biol. 1997;7:930–939. doi: 10.1016/s0960-9822(06)00412-x. [DOI] [PubMed] [Google Scholar]
- 46.Chatzizisis Y.S., Coskun A.U., Stone P.H. Role of endothelial shear stress in the natural history of coronary atherosclerosis and vascular remodeling: molecular, cellular, and vascular behavior. J. Am. Coll. Cardiol. 2007;49:2379–2393. doi: 10.1016/j.jacc.2007.02.059. [DOI] [PubMed] [Google Scholar]
- 47.Tressel S.L., Huang R.P., Jo H. Laminar shear inhibits tubule formation and migration of endothelial cells by an angiopoietin-2 dependent mechanism. Arterioscler. Thromb. Vasc. Biol. 2007;27:2150–2156. doi: 10.1161/ATVBAHA.107.150920. [DOI] [PMC free article] [PubMed] [Google Scholar]
- 48.Tardy Y., Resnick N., Dewey C.F., Jr. Shear stress gradients remodel endothelial monolayers in vitro via a cell proliferation-migration-loss cycle. Arterioscler. Thromb. Vasc. Biol. 1997;17:3102–3106. doi: 10.1161/01.atv.17.11.3102. [DOI] [PubMed] [Google Scholar]
- 49.Osanai T., Saitoh M., Okumura K. Effect of shear stress on asymmetric dimethylarginine release from vascular endothelial cells. Hypertension. 2003;42:985–990. doi: 10.1161/01.HYP.0000097805.05108.16. [DOI] [PubMed] [Google Scholar]
- 50.Dahl K.N., Kalinowski A. Nucleoskeleton mechanics at a glance. J. Cell Sci. 2011;124:675–678. doi: 10.1242/jcs.069096. [DOI] [PMC free article] [PubMed] [Google Scholar]
- 51.Dahl K.N., Ribeiro A.J., Lammerding J. Nuclear shape, mechanics, and mechanotransduction. Circ. Res. 2008;102:1307–1318. doi: 10.1161/CIRCRESAHA.108.173989. [DOI] [PMC free article] [PubMed] [Google Scholar]
- 52.Poh Y.C., Shevtsov S.P., Wang N. Dynamic force-induced direct dissociation of protein complexes in a nuclear body in living cells. Nat Commun. 2012;3:866. doi: 10.1038/ncomms1873. [DOI] [PMC free article] [PubMed] [Google Scholar]
- 53.Mengistu M., Brotzman H., Lowe-Krentz L. Fluid shear stress-induced JNK activity leads to actin remodeling for cell alignment. J. Cell. Physiol. 2011;226:110–121. doi: 10.1002/jcp.22311. [DOI] [PMC free article] [PubMed] [Google Scholar]
- 54.Chen B.P., Li Y.S., Chien S. DNA microarray analysis of gene expression in endothelial cells in response to 24-h shear stress. Physiol. Genomics. 2001;7:55–63. doi: 10.1152/physiolgenomics.2001.7.1.55. [DOI] [PubMed] [Google Scholar]
- 55.Dahl K.N., Kalinowski A., Pekkan K. Mechanobiology and the microcirculation: cellular, nuclear and fluid mechanics. Microcirculation. 2010;17:179–191. doi: 10.1111/j.1549-8719.2009.00016.x. [DOI] [PMC free article] [PubMed] [Google Scholar]
- 56.Chiquet M., Gelman L., Maier S. From mechanotransduction to extracellular matrix gene expression in fibroblasts. Biochim. Biophys. Acta. 2009;1793:911–920. doi: 10.1016/j.bbamcr.2009.01.012. [DOI] [PubMed] [Google Scholar]
Associated Data
This section collects any data citations, data availability statements, or supplementary materials included in this article.