

Abstract
Time-resolved fluorescence anisotropy (TRFA) has a rich history in evaluating protein dynamics. Yet as often employed, TRFA assumes that the motional properties of a covalently tethered fluorescent probe accurately portray the motional properties of the protein backbone at the probe attachment site. In an extensive survey using TRFA to study the dynamics of the binding loops of a αβ T cell receptor, we observed multiple discrepancies between the TRFA data and previously published results that led us to question this assumption. We thus simulated several of the experimentally probed systems using a protocol that permitted accurate determination of probe and protein time correlation functions. We found excellent agreement in the decays of the experimental and simulated correlation functions. However, the motional properties of the probe were poorly correlated with those of the backbone of both the labeled and unlabeled protein. Our results warrant caution in the interpretation of TRFA data and suggest further studies to ascertain the extent to which probe dynamics reflect those of the protein backbone. Meanwhile, the agreement between experiment and computation validates the use of molecular dynamics simulations as an accurate tool for exploring the molecular motion of T cell receptors and their binding loops.
Introduction
Molecular flexibility is integral to the molecular recognition properties of proteins, influencing specificity, cross-reactivity, and binding mechanisms. Although NMR remains the premier tool for experimental investigations of protein flexibility, not all proteins are amenable for NMR studies due to limitations on size, stability, and solubility. For such systems, other spectroscopic tools are often available. Time-resolved fluorescence anisotropy (TRFA), for example, has a rich history of investigating molecular motions of proteins, having been used to study motion in a myriad of systems, including soluble proteins, membrane proteins, and large, multisubunit complexes (e.g. 1–5). Although intrinsic fluorescent probes such as tryptophan side chains can be used, experiments on complex systems often require extrinsic probes, frequently using a cysteine mutation together with cysteine-specific covalent tethering. In such cases, an assumption often made is that the motional properties of the probe accurately reflect the motional properties of the region of the protein to which it is attached.
Recently, we used TRFA to study the molecular recognition properties of T cell receptors (TCRs) of the cellular immune system (6). TCRs are cross-reactive, clonotypic cell-surface receptors responsible for recognizing different peptide antigens bound and presented by major histocompatibility complex (MHC) proteins. Multiple mechanisms have been described to explain the cross-reactive nature of TCRs (7), but flexibility of the receptor's binding site is believed to be a key component (8). Our studies of the A6 TCR revealed differing levels of flexibility for the two hypervariable complementarity determining region (CDR) loops at the center of the interface. The anisotropy results were consistent with molecular dynamics (MD) simulations, electron density quality of the x-ray structure of the free TCR, structural differences between the free and bound states of the receptor, and a database of 10 structures of the A6 TCR bound to different peptide/MHC complexes. These results helped us draw conclusions about the role hypervariable loop dynamics play in TCR specificity and cross-reactivity.
In this study, we sought to expand on our previous work, using TRFA to explore the flexibility of the remaining CDR loops of the A6 TCR. Curiously, however, the fluorescence anisotropy results stemming from this larger data set were inconsistent with our previous MD simulations and indications of dynamics from the large collection of crystallographic structures. We thus explored the limitations of TRFA computationally, recreating and simulating five of the labeled systems and using an extensive simulation protocol (a total of 1 μs of MD simulation in explicit solvent) that permitted determination of probe and protein time correlation functions. We observed excellent agreement between the experimental and simulated time correlation decays. However, the motion at the site of the covalently attached probe poorly reflected the motion of the protein backbone at the attachment site in both the labeled and the wild-type (WT), unlabeled protein. Our observations warrant caution for the interpretation of TRFA experiments that require the use of a covalently attached fluorescence probe, and suggest further experiments to ascertain the extent to which probe dynamics reflect those of the protein backbone. However, our ability to computationally reproduce experimental TRFA data validates MD simulations as an approach to investigate the nanosecond timescale dynamics of TCRs and their binding loops.
Materials and Methods
Protein expression, purification, and mutagenesis
The A6 TCR was refolded from bacterially expressed inclusion bodies and purified chromatographically as previously described (9). The protein contained an engineered disulfide bridge across the α and β chain constant domains to stabilize the heterodimer (10).
Single cysteine mutants of the α and β chains were made using PCR mutagenesis and confirmed via sequencing. The residues for cysteine substitutions were chosen based on solvent accessibility in the free A6 crystal structure (PDB 3QH3) to promote optimal conditions for refolding and fluorescent probe labeling. The mutation sites selected were Ser-19α (a reference measurement for rigidity, located in a β-sheet of the TCR scaffold) and Asn-120α (a reference measurement for flexibility, residing in an unstructured loop coil between the variable and constant domains); Asp-26α and Arg-27α (CDR1α); Ser-51α (CDR2α); Lys-68α, Ala-69α, and Ser-70α (HV4α); Ser-100α and Trp-101α (CDR3α); Asp-26β, Met-27β, and Asn-28β (CDR1β); Ala-52β and Ile-54β (CDR2β); and Ala-99β, Gly-100β, Gly-101β, and Arg-102β (CDR3β).
Protein labeling and controls for nonspecific labeling
Before labeling, purified single cysteine mutants of the A6 TCR were buffer exchanged into an optimal labeling buffer (20 mM phosphate, 75 mM NaCl, pH 7.0). Stock solutions of fluorophore (fluorescein-5-maleimide (F5M), and BODIPY-FL (BDY); Invitrogen (Grand Island, NY)) were prepared at 10 mM in labeling buffer. In the case of BDY, solubility was enhanced with up to 2% dimethyl sulfoxide. Proteins were then reacted with a 10-fold excess of fluorophore and 10–50 μM TCEP to reduce any disulfide-bonded dimers (these TCEP concentrations were found to leave the native intra- and interchain disulfide bonds intact). A parallel reaction with wild-type (WT) protein (containing no free cysteines) was performed in every case to ascertain levels of nonspecific labeling. After mixing for ∼45 min in the dark at room temperature, excess label was removed by dialysis followed by size exclusion chromatography, exchanging the samples into phosphate buffer at pH 7.4. Labeling efficiencies measured spectrophotometrically varied between 17% and 93% depending on the mutant; the resulting variances in fluorescence intensity did not impact the anisotropy measurements. Spectrophotometry indicated that nonspecific labeling of WT A6 never exceeded 2%. For every mutant, ultraviolet images of reduced and nonreduced SDS-PAGE gels verified that fluorescence emanated only from the chain with the cysteine mutant. Intensity readings from steady-state fluorescence measurements also confirmed that the WT had insignificant amounts of noncovalently associated label.
Steady-state fluorescence measurements
Labeled A6 samples were constantly illuminated with a Beacon 2000 FP System (Invitrogen) by a halogen lamp source, filtered at a wavelength near the absorption maximum of the probes (λmax = 492 and 504 nm for F5M and BDY, respectively). Simultaneous fluorescence intensity and anisotropy measurements were collected at 25°C. Blank measurements were taken with phosphate buffer. Concentrations of samples were adjusted to achieve optimal fluorescence intensity, usually within the range of 100–400 nM. At least 10 data sets were collected per sample, at ∼30 s intervals, to verify that the samples had properly equilibrated in the chamber. Average values of anisotropy measurements are reported in millianisotropy units (mA).
Time-resolved fluorescence measurements
Time-correlated single-photon counting (TCSPC) fluorescence lifetimes and anisotropies of labeled A6 TCR mutants were measured at 25°C using a HORIBA Jobin Yvon (Edison, NJ) IBH 5000U FluoroCube spectrofluorometer. The samples were excited with a 457-nm NanoLED pulsed laser diode at a repetition rate of 1 MHz. Lifetime measurements were taken with the excitation and emission polarizers set to vertical and 54.7° from vertical (referred to as the magic angle, to eliminate anisotropic effects), respectively. The anisotropy measurements were collected as the emission polarizer was toggled between parallel (p) and perpendicular (x) positions relative to the vertically oriented excitation polarizer until a minimum peak difference of 10,000 counts was reached. A G-factor was experimentally determined to adjust for the polarization bias of the detection instrumentation. The resulting sum (IS = Ip + 2G·Ix) and difference (ID = Ip − G·Ix) decays were analyzed using the impulse reconvolution method provided by the instrument's DAS6 software analysis package, producing two correlation times, θfast and θslow, from the following double exponential decay fit:
| (1) |
where r∞ is the residual anisotropy (constrained to zero for all measurements), and rfast and rslow are the partial anisotropies corresponding to the amplitudes of the two separated correlation times (which were then normalized into the ffast and fslow values). The fitted data for the sum decays determined in the TCSPC Anisotropy program (HORIBA Jobin Yvon), which is simply the total emission decays, closely agreed with those values produced using the TCSPC Lifetime program (HORIBA Jobin Yvon).
MD simulations
The atomic coordinates of A6 were taken from the crystal structure of the free A6 TCR (PDB 3QH3), using the first molecule in the asymmetric unit, chosen over the second molecule due to the presence of contiguous electron density for the CDR3β loop (6). Simulations were performed using the AMBER10 package (11) using the ff99sb force field (12). To prepare F5M-labeled TCR, the atomic-centered charges of a geometry-optimized F5M molecule were calculated using HF/6-31G(d) and the restrained electrostatic potential method (13–15). The atomic coordinates of the cysteine mutation and covalently linked probe were inserted at five positions of interest: Ser-100α (CDR3α), Met-27β (CDR1β), Asn-28β (CDR1β), Ala-99β (CDR3β), and Arg-102β (CDR3β). The structures were neutralized using sodium counterions and solvated with SPC/E water (16) within an icosahedral box with walls at least 10 Å from the nearest protein atom. Energy minimization and equilibration was performed as previously described (6). Briefly, molecules were energy minimized and heated to 300 K using a Langevin thermostat (17). After minimization, solute restraints were gradually relaxed from 25 to 0 kcal/mol/Å2 over 100 ps of dynamics while keeping the pressure at 1 atm. The volume was then fixed and temperature constraints removed to convert to a NVE ensemble. Equilibration consisted of 2 ns of dynamics using a 2 fs time step, followed by production. Equilibration and production dynamics used the SHAKE algorithm to constrain bonds involving a hydrogen atom (18). Each labeled mutant was independently simulated with five, independent 40 ns simulations for a total of 200 ns of simulation per mutant.
Trajectory analysis, including calculation of correlated motion, was performed with the ptraj program of AMBER. For calculating time correlation functions, in each simulation a unit vector, û, was defined in the F5M molecule using two carbon atoms within the fluorescein ring system, mimicking the direction of the fluorescein transition state dipole (see Fig. 2 B, inset). For each labeled mutant, time correlation functions of the form
| (2) |
in which P2(x) = 1/2(3x2-1) is the second Legendre polynomial and 〈…〉 represents an equilibrium average (19,20), were calculated for 10 consecutive 20 ns segments. Each mutant's set of 10 correlation functions were averaged and fit to a double exponential decay model as in Eq. 1.
Figure 2.

Experimental and computed correlation functions for the F5M probe attached to select sites on the A6 TCR indicate a wide range of site-specific flexibility. (A) Time-resolved fluorescence anisotropy decays for F5M-labeled S100Cα, M27Cβ, N28Cβ, A99Cβ, and R102Cβ mutants. (B) Computed time correlation functions of a vector in the F5M ring in simulations of F5M-labeled protein. The five simulated sites and the color scheme are the same as those in panel A. The black curve represents the correlation function of the free F5M molecule. The inset shows the F5M molecule with the atoms defining the vector for computing correlation functions circled in green.
Results
Fluorescence anisotropy reveals differential dynamics between the CDR loops of the A6 TCR binding domain
To explore the flexibility of the antigen-binding surface of the A6 TCR, we measured the fluorescence depolarization of F5M covalently linked to a total of 11 single-cysteine mutants engineered throughout the A6 TCR protein. The F5M probe has an average fluorescence lifetime of ∼4 ns, making it sensitive to early nanosecond dynamics of TCR binding loop motion. The sites for labeling were chosen due to location and high side-chain solvent accessibility. Together with the six sites in CDR3α and CDR3β explored in our previous work (6), this amounts to a TRFA dynamics data set of 17 individual sites across all six CDR binding loops and the HV4α binding loop (Fig. 1). Two reference sites outside of the receptor binding site were also chosen for analysis: Ser-19α lies within the β-sheet framework region of the α chain and was chosen as a site expected to provide a reference for a rigid site. Asn-120α is located in the coil that links the variable and constant domains of the α chain and was chosen as a site expected to provide a reference for a flexible site.
Figure 1.

Structure of the αβ TCR A6 indicating the various binding loops and the sites that were analyzed via time-resolved fluorescence anisotropy.
The anisotropy decays for each site were fit to a two-exponential decay model, separating the slower time constant chiefly associated with the global tumbling of the molecule (θslow) from the faster correlation time traditionally attributed to the local flexibility of the labeled protein segment (θfast). The relative amplitudes corresponding to each time constant (fslow and ffast) give the fractional loss of anisotropy from the two decay processes. The ratio of ffast/θfast can thus be used as an overall indicator of loop flexibility (4), with a larger ratio depicting a more dynamic protein region as a result of faster backbone motion (smaller θfast), a greater contribution of backbone motion to the overall anisotropy decay (larger ffast), or both.
The anisotropy decay curves indicated a dramatic variability in the dynamics throughout the binding loops of the A6 TCR (representative curves shown in Fig. 2 A). Notably, the ffast/θfast ratios spanned a greater than fivefold range (Fig. 3; fitted values in Table S1 in the Supporting Material). Positions in the CDR2α and CDR3α loops were depicted as extremely rigid—significantly more so than the rigid reference site of position 19α. In contrast, positions in the CDR2β loop, as well as position 28 in the CDR1β loop, were depicted as highly flexible—at or beyond the level of the flexible reference site of position 120α. Curiously, the ffast/θfast values for the remaining sites on the CDR1β loop appeared to be more moderately flexible, similar to the positions in the CDR1α, HV4α, and CDR3β loops.
Figure 3.
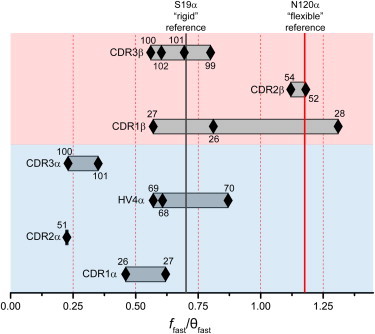
Backbone flexibility in the binding loops of the A6 TCR as indicated by TRFA. The values of the ffast/θfast ratios for 17 sites in the various loops are represented as diamonds, with the number of each position denoted next to each diamond. Low ffast/θfast ratios and thus low flexibility are at the left and high ffast/θfast ratios and high flexibility are at the right. The locations of the position 19α rigid reference and the position 120α flexible reference are indicated by vertical lines. A wide range of flexibility is indicated, both between and within the various loops.
Although the TRFA measurements indicated a significant range of flexibility, several of the observations raised questions about their overall validity. First, the depiction of the CDR3α and CDR3β loops as having low to moderate flexibility compared to the other germline loops was contradictory to the structural data for the A6 TCR: in the structure of the unliganded receptor, poor electron density was observed for CDR3α and CDR3β, but the data for the remaining loops was clear (6). Moreover, although CDR3α and CDR3β alter their conformation upon engaging ligand (with CDR3β adopting a variety of different conformations), in 10 structures of the A6 TCR bound to a different peptide/MHC complex, the remaining binding loops maintain the conformation seen in the unliganded receptor (6,21–26). These crystallographic results are fully consistent with extensive MD simulations of the A6 TCR, which showed that CDR3α and CDR3β had the highest degree of flexibility, whereas the remaining hypervariable loops were more rigid (6).
Additionally, the range of TRFA-reported flexibility observed within individual CDR loops seemed dramatic. In the most extreme case of CDR1β, two adjacent positions (Met27, Asn28) have more than a twofold difference in their ffast/θfast ratios, spanning the range set by the rigid reference of position 19α and the flexible reference of position 120α.
To establish if these discrepancies were unique to our use of fluorescein as a fluorescent probe, we examined the flexibility of 11 sites using BODIPY-FL maleimide (BDY) as a probe. BPY differs from F5M in charge, structure, and fluorescence lifetime. The 11 BDY-labeled positions span five CDR loops. In measurements of steady-state fluorescence anisotropy, the flexibility profiles of BDY- and F5M-labeled proteins were similar (Fig. S1). More significantly, the flexibility determined by steady-state fluorescence anisotropy using either probe has nearly identical correlations with the results of the time-resolved measurements. These results confirm that the variability of the dynamics observed for the binding loops of the TCR are mostly independent of the fluorescent probe used.
MD simulations of F5M-labeled protein reproduce the experimental range of flexibility
To investigate the discrepancies between the TRFA data and our previous MD simulations and crystallographic results, we performed a series of new MD simulations in which the cysteine mutation and attached F5M molecule were incorporated into the structure, mimicking computationally the molecules that were assessed experimentally by TRFA. Five sites were computationally examined in this manner: Ser-100α, Met-27β, Asn-28β, Ala-99β, and Arg-102β. Each modified system was examined with five independent 40 ns simulations, resulting in 200 ns of total simulation for each labeled cysteine mutant. Free, unincorporated F5M was also simulated for 20 ns to examine the protein-independent dynamics of the probe. The simulation protocol was identical to that used previously in our analysis of the dynamics of the unlabeled protein (6).
In analyzing these data, we first computed the time-dependent decorrelation of the F5M probe, and compared these results to the fluorescence anisotropy curves produced by the TRFA measurements. For each simulation, a vector was defined in the F5M molecule consisting of two carbon atoms within the fluorescein ring system, mimicking the direction of the fluorescein transition dipole (Fig. 2 B, inset). As described in the Materials and Methods, a time correlation function was then calculated that was directly comparable to the TRFA data (Fig. 2 B).
As with the experimental TRFA data, a two-exponential decay model best described the behavior of the five resulting correlation functions (Table 1). In the simulations, the faster decay time of the probe vector (θprobe) was attributable to protein-independent probe motions, yielding time constants close to the rotational correlation time calculated from the free F5M molecule. This faster probe decorrelation is not discernible in the TRFA experiments due to the limited time resolution of the experimental setup (minimum fluorescence lifetime of ∼200 ps). Because the contributions from protein rotational tumbling were removed before calculating the decorrelation curves by superimposing protein coordinates across the trajectories, local flexibility at the probe attachment site was presumed to be the dominant contributor to the slower decay time. This assumption is consistent with the traditional assumption of TRFA experiments (e.g., 2–4), and the slower time is consequently referred to as θloop.
Table 1.
Decorrelation parameters for the five simulated labeled positions
| Position | θprobe (ps) | fprobe | θloop (ns) | floop | floop/θloop | C∞ |
|---|---|---|---|---|---|---|
| 100α | 37 | 0.26 | 0.52 | 0.27 | 0.52 | 0.48 |
| 27β | 30 | 0.19 | 0.43 | 0.26 | 0.62 | 0.55 |
| 28β | 34 | 0.42 | 0.22 | 0.31 | 1.4 | 0.27 |
| 99β | 26 | 0.21 | 0.31 | 0.34 | 1.1 | 0.45 |
| 102β | 35 | 0.20 | 0.43 | 0.23 | 0.54 | 0.57 |
| Free F5M | 57 | 1.0 | 0 |
As with the experimental TRFA measurements, each time constant from the simulation has a fractional amplitude, fprobe and floop. We again used the ratio of amplitude/time constant to describe overall loop flexibility. The floop/θloop ratios have a nearly threefold spread (Table 1), demonstrating the sensitivity of the computed correlation functions in resolving dynamical differences of the labeled CDR loops.
The floop/θloop ratios from the five simulations correlated strikingly well with the ffast/θfast ratios from the TRFA experiments, with linear regression of the experimental versus calculated ratios yielding a line with a slope of 0.94 and a correlation coefficient of 0.91 (Fig. 4). Based on these results, the probes within the A6-F5M simulations appear to behave equivalently with those in the fluorescence anisotropy experiments.
Figure 4.

Experimental and simulated f/θ ratios are in excellent agreement, showing that the MD simulations accurately reflect the dynamics of the F5M probe attached to the protein. The solid line is a linear fit to the data, with a correlation coefficient (R) of 0.91 and a slope of 0.94.
MD simulations suggest that motions of the probe and motions of the protein are largely independent of each other
Having established that the dynamics of the covalently attached F5M probe can be well described computationally, we set out to test the fundamental assumption that TRFA measurements of labeled protein accurately reflect the backbone dynamics of the WT, unlabeled protein. In each of the five simulations with labeled protein, dynamic cross-correlation matrices were computed to examine correlated motion between the atoms of the F5M probe and atoms of the polypeptide backbone at and near the labeled cysteine (Fig. 5 A). Notably, correlated motion between the α carbon of the cysteine residue and the probe's three-membered carbon ring structure—the actual source of the fluorescence emission—was fairly weak, with correlation coefficients ranging from only 0.2 (when the label is at position 102 in CDR3β) to 0.5 (when the label is at position 99 in CDR3β) (Fig. 5 A). Residues neighboring the cysteine generally had lower correlations with the probe, demonstrating that in the simulations the probe's motion is not reflecting overall loop dynamics. Moving from the attachment site to the fluorescein ring system, the N, Cα, and C backbone atoms of the labeled cysteine rapidly lose motional correlations with the atoms of the probe until the ring system is reached, with which the correlations are the weakest (Fig. 5 B). From this analysis, it is evident that the backbone dynamics of these five sites do not dictate the motion of the fluorescence source of the attached probe.
Figure 5.

Motion of the protein backbone is poorly correlated with motion of the F5M probe. (A) Average of the correlation coefficients between amino acid α carbons and the 12 carbon atoms of the fluorescein ring system for the five simulated systems. The values are shown for the cysteine at the probe attachment site and neighboring amino acids. Correlations are weak in all cases, indicating that the motion of the probe is poorly correlated with the motion of the protein backbone. The scale, indicated below the panel, ranges from −1 (full negative correlation, colored blue) to 1 (full positive correlation, colored red). (B) Average correlation coefficients of individual F5M atoms with the cysteine's N, Cα, and C atoms mapped to the structure of the F5M probe for each simulated system. The color scheme is the same in panel A. For reference, values are indicated for the α carbon of the cysteine and the distal oxygen atom of the fluorescein's three-membered ring.
To further assess the level of disconnect between probe and protein motion, for each of the five simulations of labeled protein, time-dependent decorrelation functions were computed for the N-H, Cα-Cβ, and C-O backbone vectors for the labeled cysteine. These were compared to the computed probe vector correlations described earlier and shown in Fig. 2 B. The residual amplitude of each curve, referred to as C∞, was used to compare the various decorrelation functions (this comparison was chosen as the C∞ values are analogous to order parameters from NMR spin relaxation experiments). In Fig. 6, the average of the N-H, Cα-Cβ, and C-O C∞ values for each labeled site are shown alongside the C∞ values for the attached probe. In each case, the residual order for the backbone is substantially higher than that for the probe, further demonstrating the disconnect between motion at the fluorescein ring and that at the attached backbone.
Figure 6.

Motional properties of the backbone in the labeled or unlabeled WT protein do not reflect those of the fluorescent probe. The bars show average C∞ values (analogous to NMR order parameters) for the backbone of the cysteine in the labeled protein (dark gray bars), the same position in the unlabeled WT protein (light gray bars), and the ring of the F5M probe in the labeled protein (hatched bars). Error bars for the backbone are the standard deviations of the C∞ values for the N-H, Cα-Cβ, and C-O vectors. Fitting errors of the individual C∞ measurements were <1% of the reported value.
The disparity between the motional properties of the probe and that of the backbone to which it is attached is best exemplified for the probe attached to position 28 of the CDR1β loop. The experimental TRFA results identified this position as the most flexible of all 19 sites examined (Fig. 3). It was also the most flexible site when examining probe decorrelation in the simulations of the F5M-labeled proteins (Fig. 2 B and Fig. 4). However, as shown in Fig. 6, when the vector for computing decorrelation was moved from the probe to the backbone, the perception of the dynamics changes dramatically: the C∞ value shifts from 0.3 to 0.9, indicating the backbone at position 28β is relatively rigid throughout the simulation.
To probe the source of the discrepancy for position 28β, we calculated the number of atomic contacts between the probe and the protein as a function of time in each of the five labeled simulations (Fig. S2). Across the 200 ns of simulation, the probe attached to position 28β was almost completely devoid of contact with any neighboring TCR atoms. Compared to the other positions, the resulting motional freedom translated to an increase in the amplitude of probe motion in the decorrelation analysis (fprobe = 42% for position 28β, compared to a range of 19% to 26% for the other positions; Table 1). Thus, the lack of interactions with neighboring atoms, or conversely, a greater access to solvent, enhanced the motion of the probe at position 28β, even though the backbone to which it was attached was relatively rigid.
TRFA measurements report poorly on the backbone dynamics of the WT, unlabeled protein
To compare with the results from the simulations of the labeled protein, we next calculated C∞ values for the backbone atoms of the WT, unlabeled protein, using our previous MD simulation of the free A6 TCR, which was performed following a protocol identical to that used here (6). This comparison allowed us to examine the influence the cysteine mutation and attached probe have on the backbone dynamics of each labeled residue, and most importantly, evaluate the overall extent to which TRFA reports on the backbone dynamics of the WT, unlabeled protein. As shown in Fig. 6, in four of the five sites, the backbone C∞ values of the labeled protein were identical within error to those of the WT, unlabeled protein, indicating in these cases that even if the probe is not fully reporting on backbone dynamics, mutation to cysteine and attachment of F5M does not greatly perturb local backbone dynamics. The corollary though, is that the probe generally possesses different motional properties than the protein backbone at the site that is labeled: the backbones of Ser-100α, Met-27β, and Asn-28β are all much more rigid than indicated by the probe. The C∞ values for the probe also vary considerably among these three positions, whereas the values for the backbones are relatively constant.
The exceptions to the latter point are Ala-99β and Arg-102β: in these cases, probe motion appears to more accurately depict the motion of the backbone of the unlabeled protein. In Arg-102β, however, this agreement results from the averaging of a wide variation in the C∞ values of the Arg-102β backbone atoms, leading to a large standard deviation of the average C∞. In Ala-99β, the agreement is even more fortuitous: although the probe C∞ value is closer to that of the backbone in the unlabeled protein, it differs substantially from the value for the unlabeled, WT protein. This discrepancy likely result from probe-protein interactions in the position 99β simulation, as there was a spike in the number of probe-protein contacts in the 41-80 ns segment (Fig. S2). Indeed, snapshots of the simulation during this time depicted the F5M probe sandwiched between the adjacent CDR1α and CDR3α loops. We thus conclude that in three of the five cases examined computationally, the results from the TRFA experiments inadequately report on the backbone flexibility of the unlabeled protein, with agreement in the other two resulting from either serendipitous averaging of complex backbone motions or fortuitous site-specific restrictions on probe motion.
Discussion
Here, we used fluorescence anisotropy to experimentally characterize the nanosecond dynamics of the binding loops of the αβ TCR A6, with the initial goal of understanding how TCR flexibility influences receptor recognition properties. The experiments indicated a wide range of flexibility for the 19 sites that were probed. However, multiple discrepancies were noted in how the TRFA data portrayed the flexibilities of the various loops. With the exception of the CDR2α loop, the germline loops were suggested to have similar or even greater flexibility than the hypervariable CDR3 loops. Additionally, conspicuously large site-to-site variances were observed within individual loops. These results were inconsistent with the structure of the free TCR, for which missing or poor quality electron density was only observed for the hypervariable CDR3 loops (6). The TRFA data were also inconsistent with the large amount of structural data on complexes with the A6 TCR: across 10 structures of the receptor bound to different ligands, only the CDR3 loops have conformations different from those seen in the structure of the unbound TCR. Finally, the TRFA data were inconsistent with our previous MD simulation of the free A6 TCR, in which the CDR3 loops were indicated to be substantially more flexible than the germline loops (6). To investigate these discrepancies, we recreated five of the TRFA measurements with MD simulations, incorporating both the cysteine mutation and the covalently attached fluorescein probe.
We observed striking agreement between the experimental and simulated TRFA results, justifying a more in-depth analysis of the simulations. In general, we found that in the TRFA experiments, the covalently attached fluorescent probe poorly describes the dynamics of the backbone to which it is attached. The motion of the probe's three-membered ring—the source of fluorescence—was at best only weakly correlated with the motion of the backbone. The level of disparity is proportional to the degree of physical separation between the ring and the backbone, as correlated motion dropped as a function of the number of rotatable bonds between the backbone and the ring system. With extended separation, there is opportunity for the probe to sample conformational space independently of the backbone. The effects of this are perhaps best exemplified by the results for Asn-28 in CDR1β, which the TRFA experiments falsely identify as highly flexible, when in fact the backbone is the most rigid of the five sites explored computationally. Indeed, three of the five examined sites were substantially more rigid than indicated by TRFA, and the closer agreement between the other two was due to either fortuitous averaging of a wide range of backbone dynamics, or serendipitous probe-protein interactions that limit the motion that would otherwise be available to the probe.
Altogether, the data suggest that TRFA experiments can provide inaccurate assessments of site-specific backbone flexibility, in some cases overestimating flexibility and in some cases underestimating it. These conclusions are fairly consistent with data reported by other investigators. Although Schröder and colleagues (27) similarly observed close agreement between probe motions in simulation and experiment when studying the flexibility of a labeled site of a bacteriorhodopsin fragment, they also showed evidence for a relatively weak correlation between the motions of the probe and the motions of the backbone. In fact, the headgroup of the probe had the highest synchronized motion with a neighboring side chain with which the probe formed frequent contacts. In another study, Shi et al. (28) used TRFA and molecular dynamics to study loop flexibility of acetylcholinesterase. In this case, the rank ordering of computed time correlation curves were compared with experiment, and a distinct anomaly was found with the measured dynamics of two residues (out of four examined). Although both of these reports used smaller data sets and relied on much shorter simulation times and different solvent systems, it is intriguing that the outcomes were consistent with our results.
As noted previously, our data suggest that the ability for a covalently tethered probe to accurately portray backbone dynamics diminished as a function of the number of rotatable bonds between the backbone and the fluorescence source. Unless a dynamic probe lies within the backbone itself (as with NMR), measurements of protein dynamics will still necessitate site-specific labeling. The development of smaller, less flexible probe systems or use of more rigid attachment chemistry (29) could overcome some of the liabilities suggested by our data. Along these lines, it is possible that our results are influenced by structural aspects unique to the TCR system explored here, as the contours of the juxtaposed CDR loops at the TCR-binding surface may be more prone to probe effects than measurements on more regular regions of protein secondary structure. Investigations in other proteins, ideally those more amenable to direct spectroscopic measurements of backbone dynamics, will be required to fully address the issue.
Finally, although we observed a poor agreement between the indicators of backbone motion reported by TRFA and the MD simulations, our ability to reproduce the TRFA data from the simulations validates MD as a tool to probe the nanosecond dynamics of TCRs and their binding loops. For the A6 TCR studied here, as the results of our prior simulation were fully consistent with a very large structural database (6,21–26), as well as more limited observations on other TCRs (8), we conclude that the hypervariable CDR3α and CDR3β loops of the receptor possess significant nanosecond-timescale flexibility, with the degree of flexibility for CDR3β greater than CDR3α. By comparison, the germline-encoded CDR1 and CDR2 loops are rigid. With our validated MD protocols, the extent to which this applies to other TCRs (and potentially antibodies with their similar binding site architecture) can be investigated with confidence.
Acknowledgments
We thank Professor Prashant Kamat for use of the TCSPC instrument and the staff of the Notre Dame Center for Research Computing for assistance.
This work was supported by grants GM067079 and GM075762 from the National Institute of General Medical Services (NIGMS), National Institutes of Health (NIH), and MCB-0448298 and CHE-0845736 from the National Science Foundation (NSF).
Supporting Material
References
- 1.Kirchberg K., Kim T.-Y., Alexiev U. Conformational dynamics of helix 8 in the GPCR rhodopsin controls arrestin activation in the desensitization process. Proc. Natl. Acad. Sci. USA. 2011;108:18690–18695. doi: 10.1073/pnas.1015461108. [DOI] [PMC free article] [PubMed] [Google Scholar]
- 2.Boyd A.E., Dunlop C.S., Johnson D.A. Nanosecond dynamics of acetylcholinesterase near the active center gorge. J. Biol. Chem. 2004;279:26612–26618. doi: 10.1074/jbc.M401482200. [DOI] [PubMed] [Google Scholar]
- 3.Hibbs R.E., Johnson D.A., Taylor P. Structural dynamics of the alpha-neurotoxin-acetylcholine-binding protein complex: hydrodynamic and fluorescence anisotropy decay analyses. Biochemistry. 2005;44:16602–16611. doi: 10.1021/bi051735p. [DOI] [PubMed] [Google Scholar]
- 4.Hibbs R.E., Radic Z., Johnson D.A. Influence of agonists and antagonists on the segmental motion of residues near the agonist binding pocket of the acetylcholine-binding protein. J. Biol. Chem. 2006;281:39708–39718. doi: 10.1074/jbc.M604752200. [DOI] [PubMed] [Google Scholar]
- 5.Kim T.-Y., Schlieter T., Alexiev U. Activation and molecular recognition of the GPCR rhodopsin - insights from time-resolved fluorescence depolarisation and single molecule experiments. Eur. J. Cell Biol. 2012;91:300–310. doi: 10.1016/j.ejcb.2011.03.009. [DOI] [PubMed] [Google Scholar]
- 6.Scott D.R., Borbulevych O.Y., Baker B.M. Disparate degrees of hypervariable loop flexibility control T-cell receptor cross-reactivity, specificity, and binding mechanism. J. Mol. Biol. 2011;414:385–400. doi: 10.1016/j.jmb.2011.10.006. [DOI] [PMC free article] [PubMed] [Google Scholar]
- 7.Yin Y., Mariuzza R.A. The multiple mechanisms of T cell receptor cross-reactivity. Immunity. 2009;31:849–851. doi: 10.1016/j.immuni.2009.12.002. [DOI] [PubMed] [Google Scholar]
- 8.Armstrong K.M., Piepenbrink K.H., Baker B.M. Conformational changes and flexibility in T-cell receptor recognition of peptide-MHC complexes. Biochem. J. 2008;415:183–196. doi: 10.1042/BJ20080850. [DOI] [PMC free article] [PubMed] [Google Scholar]
- 9.Davis-Harrison R.L., Armstrong K.M., Baker B.M. Two different T cell receptors use different thermodynamic strategies to recognize the same peptide/MHC ligand. J. Mol. Biol. 2005;346:533–550. doi: 10.1016/j.jmb.2004.11.063. [DOI] [PubMed] [Google Scholar]
- 10.Boulter J.M., Glick M., Jakobsen B.K. Stable, soluble T-cell receptor molecules for crystallization and therapeutics. Protein Eng. 2003;16:707–711. doi: 10.1093/protein/gzg087. [DOI] [PubMed] [Google Scholar]
- 11.Case D.A., Cheatham T.E., 3rd, Woods R.J. The Amber biomolecular simulation programs. J. Comput. Chem. 2005;26:1668–1688. doi: 10.1002/jcc.20290. [DOI] [PMC free article] [PubMed] [Google Scholar]
- 12.Hornak V., Abel R., Simmerling C. Comparison of multiple Amber force fields and development of improved protein backbone parameters. Proteins. 2006;65:712–725. doi: 10.1002/prot.21123. [DOI] [PMC free article] [PubMed] [Google Scholar]
- 13.Cornell W.D., Cieplak P., Kollman P.A. A second generation force field for the simulation of proteins, nucleic acids, and organic molecules. J. Am. Chem. Soc. 1995;117:2309. 2309. [Google Scholar]
- 14.Bayly C.I., Cieplak P., Kollman P.A. A well-behaved electrostatic potential based method using charge restraints for deriving atomic charges: the RESP model. J. Phys. Chem. 1993;97:10269–10280. [Google Scholar]
- 15.Leland, B., D. Paul, …, R. Walker. 2008. Amber Advanced Tutorials (A1). http://ambermd.org/tutorials/advanced/tutorial1/ Accessed October 23, 2012.
- 16.Berendsen H.J.C., Grigera J.R., Straatsma T.P. The missing term in effective pair potentials. J. Phys. Chem. 1987;91:6269–6271. [Google Scholar]
- 17.Furse K.E., Corcelli S.A. The dynamics of water at DNA interfaces: computational studies of Hoechst 33258 bound to DNA. J. Am. Chem. Soc. 2008;130:13103–13109. doi: 10.1021/ja803728g. [DOI] [PubMed] [Google Scholar]
- 18.Ryckaert J.-P., Ciccotti G., Berendsen H.J.C. Numerical integration of the cartesian equations of motion of a system with constraints: molecular dynamics of n-alkanes. J. Comput. Phys. 1977;23:327–341. [Google Scholar]
- 19.Lipari G., Szabo A. Model-free approach to the interpretation of nuclear magnetic-resonance relaxation in macromolecules. 1. Theory and range of validity. J. Am. Chem. Soc. 1982;104:4546–4559. [Google Scholar]
- 20.Wong V., Case D.A. Evaluating rotational diffusion from protein MD simulations. J. Phys. Chem. B. 2008;112:6013–6024. doi: 10.1021/jp0761564. [DOI] [PubMed] [Google Scholar]
- 21.Ding Y.H., Baker B.M., Wiley D.C. Four A6-TCR/peptide/HLA-A2 structures that generate very different T cell signals are nearly identical. Immunity. 1999;11:45–56. doi: 10.1016/s1074-7613(00)80080-1. [DOI] [PubMed] [Google Scholar]
- 22.Garboczi D.N., Ghosh P., Wiley D.C. Structure of the complex between human T-cell receptor, viral peptide and HLA-A2. Nature. 1996;384:134–141. doi: 10.1038/384134a0. [DOI] [PubMed] [Google Scholar]
- 23.Gagnon S.J., Borbulevych O.Y., Baker B.M. T cell receptor recognition via cooperative conformational plasticity. J. Mol. Biol. 2006;363:228–243. doi: 10.1016/j.jmb.2006.08.045. [DOI] [PubMed] [Google Scholar]
- 24.Piepenbrink K.H., Borbulevych O.Y., Baker B.M. Fluorine substitutions in an antigenic peptide selectively modulate T-cell receptor binding in a minimally perturbing manner. Biochem. J. 2009;423:353–361. doi: 10.1042/BJ20090732. [DOI] [PMC free article] [PubMed] [Google Scholar]
- 25.Borbulevych O.Y., Piepenbrink K.H., Baker B.M. T cell receptor cross-reactivity directed by antigen-dependent tuning of peptide-MHC molecular flexibility. Immunity. 2009;31:885–896. doi: 10.1016/j.immuni.2009.11.003. [DOI] [PMC free article] [PubMed] [Google Scholar]
- 26.Borbulevych O.Y., Piepenbrink K.H., Baker B.M. Conformational melding permits a conserved binding geometry in TCR recognition of foreign and self molecular mimics. J. Immunol. 2011;186:2950–2958. doi: 10.4049/jimmunol.1003150. [DOI] [PMC free article] [PubMed] [Google Scholar]
- 27.Schröder G.F., Alexiev U., Grubmüller H. Simulation of fluorescence anisotropy experiments: probing protein dynamics. Biophys. J. 2005;89:3757–3770. doi: 10.1529/biophysj.105.069500. [DOI] [PMC free article] [PubMed] [Google Scholar]
- 28.Shi J., Tai K., Johnson D.A. Nanosecond dynamics of the mouse acetylcholinesterase cys69-cys96 omega loop. J. Biol. Chem. 2003;278:30905–30911. doi: 10.1074/jbc.M303730200. [DOI] [PubMed] [Google Scholar]
- 29.Zürn A., Klenk C., Hoffmann C. Site-specific, orthogonal labeling of proteins in intact cells with two small biarsenical fluorophores. Bioconjug. Chem. 2010;21:853–859. doi: 10.1021/bc900394j. [DOI] [PubMed] [Google Scholar]
Associated Data
This section collects any data citations, data availability statements, or supplementary materials included in this article.