

Abstract
Ceramide produced from sphingomyelin in the plasma membrane is purported to affect signaling through changes in the membrane’s physical properties. Thermal behavior of N-palmitoyl sphingomyelin (PSM) and N-palmitoyl ceramide (PCer) mixtures in excess water has been monitored by 2H NMR spectroscopy and compared to differential scanning calorimetry (DSC) data. The alternate use of either perdeuterated or proton-based N-acyl chain PSM and PCer in our 2H NMR studies has allowed the separate observation of gel-fluid transitions in each lipid in the presence of the other one, and this in turn has provided direct information on the lipids’ miscibility over a wide temperature range. The results provide further evidence of the stabilization of the PSM gel state by PCer. Moreover, overlapping NMR and DSC data reveal that the DSC-signals parallel the melting of the major component (PSM) except at intermediate (20 and 30 mol %) fractions of PCer. In such cases, the DSC endotherm reports on the presumably highly cooperative melting of PCer. Up to at least 50 mol % PCer, PSM and PCer mix ideally in the liquid crystalline phase; in the gel phase, PCer becomes incorporated into PSM:PCer membranes with no evidence of pure solid PCer.
Introduction
The sphingolipid signaling pathway (1,2) is critical, among other things, in directing healthy and tumoral cells toward either programmed death or survival (3,4). An early stage of this pathway consists of the hydrolysis of cell membrane sphingomyelin (SM) by a sphingomyelinase, giving rise to water-soluble phosphorylcholine and highly nonpolar ceramide (Cer) (5,6). Cer remains in the membrane and is responsible for downstream steps in the pathway, either binding specific enzymes, or perhaps changing the physical properties of the membrane (7,8). Thus, as a result of sphingomyelinase activity, a mixture of SM and Cer occurs, and lateral separation of phospholipid-enriched and Cer-enriched domains is likely within the cell membrane (9,10). Coalescence of initially small Cer-enriched domains may give rise to micron-sized clusters or platforms, containing specific proteins, and exerting specialized functions, i.e., in the cellular response to stress (11,12).
The above discoveries at the model and cellular level, together with previous observations of Cer properties (7,13–15), have led to a number of physical studies specifically directed to explore domain formation in bilayers (16–19). Studies of SM:Cer mixtures are less frequent (20). Formation of Cer-enriched domains upon treatment of SM-containing vesicles with a sphingomyelinase was described probably for the first time by Holopainen et al. (21). Further studies from Maggio’s laboratory have provided interesting data on the subject of Cer domains generated by sphingomyelinase. Epifluorescence studies of SM monolayers being degraded by sphingomyelinase, added to the aqueous subphase, indicate in real-time that formation of Cer alters surface topography at an early stage, inducing phase separation into condensed (Cer-enriched) and expanded (SM-enriched) domains (22–24). Cer-enriched domains in egg SM:Cer bilayers, rather than monolayers, were described by Sot et al. (25) using mainly differential scanning calorimetry (DSC) and fluorescence microscopy. DSC data showed for pure egg SM a rather narrow gel-fluid transition centered at 39°C. Egg Cer, even at low proportions (5 mol %), gave rise to asymmetric endotherms, indicating the formation of high-temperature melting SM:Cer domains. The corresponding phase diagram includes a wide temperature-composition region of coexisting domains. These are also observed in giant unilamellar vesicles of the same composition using fluorescence microscopy (25).
Here we characterize in detail the temperature-composition diagram of chemically defined N-palmitoyl SM:N-palmitoyl Cer (PSM:PCer) mixtures, using 2H NMR and DSC. The use of such pure lipids enables the drawing of more accurate phase boundaries. 2H NMR has the advantage that experiments may be performed by deuterating either the SM or the Cer N-acyl chains, so that melting of each molecule can be separately observed. DSC provides an overall view of the phase transition, and constitutes a link with previous studies (e.g., Sot et al. (25)). 2H NMR allowed the first observation of Cer-rich domains in bilayers composed of fully deuterated DPPC and bovine brain Cer (26). We earlier used 2H NMR to study mixtures of PCer and 1-palmitoyl, 2-oleoyl PC and found that gel and liquid-crystalline (Lα) phases coexisted over a wide range of temperatures and compositions, with domains of different composition and physical state being present at physiological temperature (27).
A rational approach to complexity is to start at a simple level, upon which more complicated conceptual structures can be built. A more detailed understanding of lipid-lipid interactions in the plasma membrane would require, in addition to SM and Cer, the presence of at least cholesterol and unsaturated PC. However this quaternary mixture is hardly amenable to analysis by contemporary techniques; even the ternary mixtures of SM:PC:cholesterol (17,28,29) are difficult to study, and the mixture SM:Cer:cholesterol is known for its unusual behavior (30–32). Thus, we start with SM:Cer, a decision supported by the fact that these two lipids give rise to complexes that are stable even in the presence of PC or cholesterol under certain conditions (31). This investigation of SM:Cer provides insights into the miscibility of these two lipids. The data will help in the analysis of mixtures containing SM:Cer plus cholesterol and/or unsaturated PC.
Materials and Methods
Materials
Synthetic N-palmitoyl-D-erythro-sphingosylphosphorylcholine (PSM) and N-[2H31] palmitoyl-D-erythro-sphingosylphosphorylcholine (PSM-D31) in powder form were obtained from Avanti Polar Lipids (Alabaster, AL). N-palmitoyl-D-erythro-sphingosine (PCer) and N-[2H31] palmitoyl-D-erythro-sphingosine (PCer-D31) in powder form were obtained from Northern Lipids (Vancouver, British Columbia, Canada). Lipid purity was checked with thin layer chromatography using 70:26:4 chloroform/methanol/water (v/v). Deuterium-depleted water was purchased from Sigma-Aldrich (St. Louis, MO).
Multilamellar vesicle preparation
PSM multilamellar vesicles (MLVs) containing nominal PCer concentrations of 0, 10, 20, 30, and 40 mol % were made using standard methods. Briefly, appropriate quantities of PSM and PCer were combined, dissolved in 80:20 benzene:methanol (v/v), lyophilized until dry, hydrated in excess deuterium-depleted water (700 μL), and passed through five freeze-thaw-vortex cycles between −196 and 95°C (pure PCer melts at 90°C (14)). One of the two lipids is perdeuterated in the acyl chain for 2H NMR. The actual MLV compositions were mole ratios of 100:0, 90:10, 80:20, 74:26, and 60:40 PSM-D31:PCer, and 90:10, 80:20, 69:31, and 61:39 PSM:PCer-D31. The uncertainty in concentration was ≤2% for PSM-D31:PCer samples and ≤0.5% for PSM:PCer-D31 samples. Total lipid mass varied between 11 and 161 mg.
2H NMR
2H NMR was performed using a 7.0 T Oxford Magnet (Oxford Magnet Technology, Witney, Oxon, UK) with a locally built spectrometer operating at 46.8 MHz using the quadrupolar echo technique (33), which involved two 90° pulses of 3.95 μs duration, 90° out of phase, 40 μs apart, and repeated every 300 ms. Data were collected with quadrature detection and 8-CYCLOPS phase cycling. At least 10,000 scans were averaged. Experiments were performed immediately after MLV preparation. MLVs were allowed to equilibrate at each temperature for at least 20 min before data collection. Experiments proceeded from low to high temperatures with 1° increments except at high temperatures to minimize water loss. To check for formation of a slowly relaxing PCer crystalline phase at temperatures below the gel-Lα transition (27), quadrupolar echo experiments were also performed using a repetition time of 50 s. No evidence of a solid phase was observed. Typical data acquisition for each sample took 3–4 weeks.
The first moment (M1), or average spectral width, is defined for our symmetric spectrum as
| (1) |
where ω is the frequency, f(ω) is the intensity at ω, and x = 2π⋅40 kHz for fully Lα spectra and 2π⋅75 kHz otherwise.
Each deuteron along a perdeuterated lipid chain in an Lα phase membrane contributes a Pake doublet to the spectrum, with an associated quadrupolar splitting ΔνQ of
| (2) |
where e2qQ/h is the static quadrupolar coupling constant and SCD is a measure of the angular excursions of the C-D bond with respect to the lipid long axis. Gel phase spectra, by contrast, are bell-shaped, due to the lack of rapid axially symmetric motion of the lipids about their long axes.
In a phase coexistence region, 2H NMR spectra are superpositions of the weighted gel and Lα end-point spectra. Given two 2H NMR spectra from such a region (at the same temperature), the end-point spectra can be obtained by subtracting a fraction K (or K′) of one spectrum from the other. Because the gel and Lα phases have different echo decay rates, the K (or K′) values were corrected according to the procedure in Morrow et al. (34). The end-point concentrations for the gel and Lα phases are
| (3) |
| (4) |
where xA and xB are the concentration of labeled lipid in samples with more gel and more Lα content, respectively (35).
Results
2H NMR spectra
In the PSM:PCer system, the individual behavior of the two sphingolipids was observed by perdeuterating the N-palmitoyl chain of either one in turn. Aqueous MLVs of PSM-D31:PCer and PSM:PCer-D31 were prepared with 10, 20, 30, and 40 mol % PCer (or PCer-D31) and 2H NMR data were collected from 25 to 80°C. The spectra of pure PSM-D31 MLVs from 25 to 70°C were also recorded; the pure PSM-D31 membrane exhibits a sharp gel-Lα phase transition at 40°C, in close agreement with the literature (28,36).
Fig. 1 shows the spectra of 90:10 PSM-D31:PCer and PSM:PCer-D31 at select temperatures. Visual inspection of 2H NMR spectra gives direct information about the state of the labeled lipid. Gel spectra are broad and rather featureless, extending to ±63 kHz, as is the case at 25°C for both samples. In contrast, a number of distinct peaks are present in a Lα spectrum, such as those at 75°C. In comparison to pure PSM-D31, these mixed sphingolipids undergo a broad transition. Because experiments progress from low to high temperatures, we define the lowest temperature at which Lα phase signal first appears and the lowest temperature at which gel phase signal is no longer present as the “onset” and the “end” of the transition, respectively. For the deuterated PSM sample, the transition takes place over 17°, from onset at 39°C to the end at 56°C (both temperatures are marked by boxes in Fig. 1). For the deuterated PCer sample, the transition width only spans 10° (47–57°C). The superposition of gel and Lα phase signal in the transition region means that the deuterated lipid is in both phases. The fact that, between 39 and 46°C, the 90:10 PSM-D31:PCer spectra contain some Lα phase while the 90:10 PSM:PCer-D31 spectra do not, is clear evidence that pure PSM-D31 Lα domains exist at these temperatures.
Figure 1.
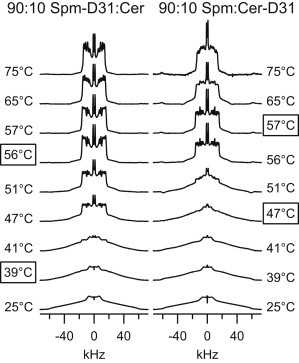
2H NMR spectra for 90:10 PSM-D31:PCer and 90:10 PSM:PCer-D31 at various temperatures. (Boxed temperatures) Boundaries of the phase transition. The minor baseline irregularities at ±60 kHz in the 56–75°C spectra of 90:10 PSM:PCer-D31 are artifacts from acoustic ringing.
Average spectral width
The first moment, M1, is a measure of average spectral width. For a gel phase spectrum, M1 is approximately twice that of an Lα spectrum. Fig. 2 shows the temperature dependence of M1 for all samples in a M1-T graph; gel-Lα phase transitions manifest as segments having a large negative slope. For each sample, the onset temperature, as determined from spectral inspection, is within 6°C of the steep drop and the end-transition temperature from inspection corresponds to the intersection between the steep and the high-temperature shallow M1-T segments. Increasing PCer concentration has two notable effects on PSM:PCer MLVs:
-
1.
The gel phase M1 of PCer (or PCer-D31) containing membranes is noticeably increased compared to that of pure PSM-D31.
-
2.
Increased PCer content also increases the midpoint-temperature of the gel-Lα phase transition-temperature for both sphingolipids.
PCer, like other ceramides (37), enhances the gel phase stability of the membrane. For 80:20 PSM-D31:PCer and 74:26 PSM-D31:PCer, the M1-versus-temperature curves showed plateaus in the vicinity of 53°C, likely due to faster echo decay rates and concomitant changes to spectral shape at these temperatures. Finally, we note that, at 40 mol % PCer, there is a prominent shoulder in M1 near 60°C.
Figure 2.
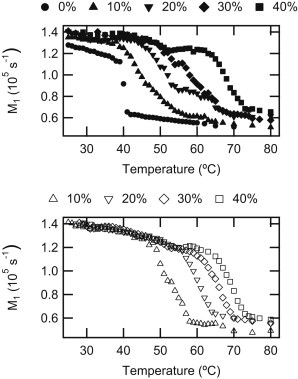
Effect of PCer concentration on the temperature dependence of M1 for 100:0(●), 90:10(▴), 80:20(▾), 70:30(♦), 60:40(■) PSM-D31:PCer (solid symbols), and PSM:PCer-D31 (open symbols).
Liquid crystalline phase properties
In the Lα phase, each deuteron on the palmitoyl chain contributes a Pake doublet to the spectrum. In general, deuterons of the same methylene group are equivalent and have an average orientation perpendicular to the lipid long axis. The deuterons on C2 and C3 of PSM-D31, however, have different orientations due to the structural kink of the amide-linked palmitoyl chain. Consequently, the temperature dependence of their quadrupolar splittings is reduced, allowing for their identification. We observe quadrupolar splittings of 18 and 25 kHz for the C2 deuterons, and 32 and 34 kHz for the C3 deuterons, in agreement with values given by Mehnert et al. (36) for oriented bilayers of selectively C2-labeled (19.4 and 28.9 kHz) and perdeuterated PSM (33 and 35 kHz for the C3 deuterons).
Having identified C2 and C3, order parameter profiles (Fig. 3) for PSM-D31:PCer and PSM:PCer-D31 membranes at 75°C can be calculated from resolved quadrupolar splittings (Eq. 2), allowing detailed examination of the Lα phase sphingolipid membrane structure. The order parameters of the plateau region (C4–C9) are almost identical for the two sphingolipids at all concentrations, but the distal end (C10–C16) of PSM-D31 tends to be slightly more ordered than PCer-D31. The order parameters of both PSM-D31 and PCer-D31 increase with increasing PCer (or PCer-D31) concentration.
Figure 3.
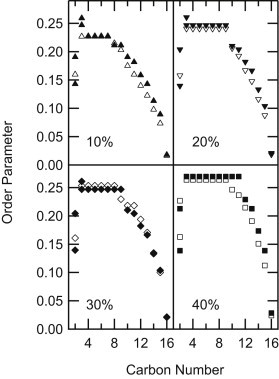
Order parameter profiles for 90:10, 80:20, 70:30, and 60:40 PSM-D31:PCer (solid symbols) and PSM:PCer-D31 (open symbols) at 75°C. All membranes are in the Lα phase. SCD values within the plateau regions are average values because the quadrupolar splittings from deuterons on these carbons are unresolved.
Differential scanning calorimetry
Differential scanning calorimetry (DSC) thermograms of Busto et al. (38) for nondeuterated PSM:PCer up to 50 mol % PCer are analyzed in relation to 2H NMR results: Fig. 4 shows the negative integration curve of the DSC thermograms (dotted line) superimposed with 2H NMR M1-T graphs for PSM-D31:PCer (solid symbols) and PSM:PCer-D31 (open symbols), scaled to reflect relative changes. We analyze the transitions at each concentration separately, starting with 2H NMR. For membranes containing <40 mol % PCer (or PCer-D31), the onset of the PCer-D31 transition is higher than that for PSM-D31, signifying that the gel phase in the coexistence regions is enriched in PCer, relative to the overall sample composition. At 40%, PSM-D31 and PCer-D31 have similar ordering at all temperatures, indicating that the two lipids are well mixed and undergo the transition simultaneously. From the jagged temperature dependence of M1 of 80:20 and 74:26 PSM-D31:PCer (nominally 30 mol % PCer), it can be deduced that PSM undergoes complex phase behavior at these concentrations.
Figure 4.
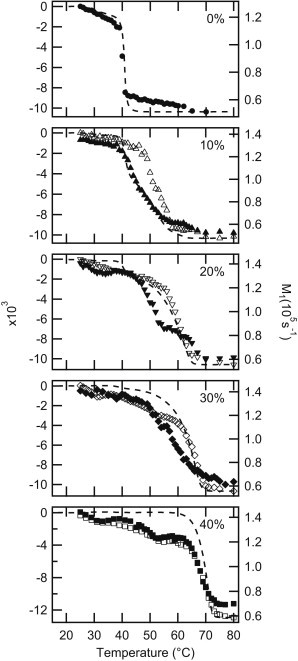
The negative integral of the DSC thermograms of PSM:PCer (dotted lines) are superimposed on 2H NMR M1 temperature-dependence graphs for 100:0, 90:10, 80:20, 70:30, and 60:40 PSM-D31:PCer (solid symbols) and PSM:PCer-D31 (open symbols). The two graphs are scaled such that the maximum and minimum values of the integral and M1 are aligned.
The negative integration curves of Fig. 4 are obtained by integrating the DSC thermograms with respect to temperature using the trapezoid method. The DSC traces (see Fig. S1 in the Supporting Material) show a relatively sharp endotherm at 40.9°C (0–30% PCer) associated with the gel-Lα transition of a pure PSM component; a broad transition around 70°C (40–50%), identified as the gel-Lα transition of a homogeneous PSM:PCer mixture; and a plateau between these two transitions (2.5–10 mol % PCer). The integral of a DSC thermogram is proportional to enthalpy. The negative integral behaves like the 2H NMR M1 in that high values correspond to the gel phase, low values correspond to the Lα phase, and large negative slopes indicate phase transitions. Steeper drops indicate sharper transitions. For pure PSM, both the DSC integral and the 2H NMR M1 have the greatest slope at 40°C. For 10%, the integral traces the drop in the PSM M1. At 20 and 30%, however, the integral more closely resembles the behavior of the PCer M1. At 40%, the integral and the two M1 values drop sharply, evidence that a homogenous mixture of sphingolipids is present at all temperatures studied. Even though the DSC integral is clearly more closely correlated with M1 in PSM-D31:Cer at 10%, and PSM:PCer-D31 at 20 and 30%, DSC is a bulk technique and follows the cooperative thermal transitions of the whole sample. The two techniques are in agreement in that all of the PSM and PCer melting observed by 2H NMR occurs at temperatures within the transition region detected by DSC.
Phase diagram
Fig. 5 is a partial phase diagram that summarizes our DSC and 2H NMR findings. From DSC, the apex temperature of the low-temperature endotherm (∼40°C) for 0–30 mol % PCer, the low-temperature onset of the broad endotherm (∼70°C) for 40–50 mol % PCer, and the high-temperature completion of the highest temperature endotherm for all PCer-containing samples are plotted. For 2H NMR, phase boundaries were defined by spectral inspection. From 58 to 61°C, phase boundaries were also inferred using spectral subtraction of pairs of PSM:PCer-D31 spectra (see Methods and Materials). The phase diagram consists of five regions, as follows.
Region 1. Low-temperature, low [PCer]: Below 40°C, membranes with ≤30 mol % PCer are composed of two coexisting gel phases—one of pure PSM and the other a mixture of PSM and PCer.
Region 2. 40–50°C, low [PCer]: The pure PSM component of membranes with ≤30 mol % PCer melts near 40°C, resulting in a pure PSM Lα phase and a gel phase composed of PSM and PCer above 40°C.
Region 3. Above 50°C, low [PCer]: Between ∼50°C and the liquidus, membranes containing 10–20 mol % PCer are composed of coexisting PSM:PCer Lα and gel phases.
Region 4. Low temperature, high [PCer]: A PSM:PCer gel exists above 30 mol % PCer at low temperatures; there is no pure PSM component present.
Region 5. High-temperature: Above the liquidus, the two sphingolipids are in the Lα phase and well mixed. The liquidus temperature increases with increasing PCer content from 40°C for pure PSM to 73°C for 50 mol % PCer.
Figure 5.
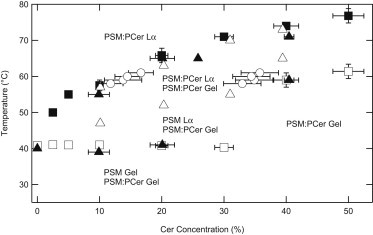
Phase diagram constructed from spectral inspections of PSM-D31:PCer (▴), spectral inspections of PSM:PCer-D31 (▵), spectral subtractions of PSM:PCer-D31 (○), completion of the highest-temperature DSC endotherm (■), and the apex temperature of the low-temperature endotherm (∼40°C) for 0–30% PCer and low-temperature onset of the broad endotherm (∼70°C) for 40 and 50% PCer on DSC thermograms (□).
These lipid behaviors are deduced in the following way. The sharp and invariant DSC endotherm near 40°C, in conjunction with the onset of PSM melting as seen in PSM-D31:PCer spectra and the complete lack of Lα signal in the PSM:PCer-D31 spectra, is compelling evidence for a three-phase line that divides Regions 1 and 2. In Region 3, an Lα component and a gel phase component are evident in 2H NMR spectra for both PSM-D31:PCer and PSM:PCer-D31. In Region 4, there is no evidence of a pure PSM gel phase: the 40°C endotherm is missing from DSC traces, and gel phase characteristics extend to considerably higher temperatures in 2H NMR spectra of both lipids. At 40 mol %, both DSC and 2H NMR indicates that the PSM and PCer are well mixed, forming a single gel phase that undergoes a gel-Lα transition between ∼60 and 72°C. At 50 mol %, the DSC peak sharpens further (Fig. S1). The liquidus that defines Region 5 is clearly defined by both DSC and 2H NMR of membranes with labeled PSM or PCer.
Theoretical ideal mixing of PSM:PCer in the Lα phase
Let us assume that the free energy of interaction between the two sphingolipids is the same in a given phase and that PSM and PCer mix ideally (that is, that the lipids will distribute randomly in each phase). Under such assumptions, the fraction of PCer at the liquidus and the solidus, xl and xg, respectively, at a given temperature, T, can be solved analytically using regular solution theory (39):
| (5) |
| (6) |
As usual, R is the molar gas constant and the free energy of melting is ΔG° = ΔH° − TΔS°. At the transition temperature, ΔG° = 0, and ΔH° can be used to calculate ΔS°. Over a limited temperature range, ΔS° and ΔH° are approximately constant. Fig. 6 shows the phase boundaries calculated from Eqs. 5 and 6 using known values of ΔH°PSM = 4.35 × 10⁴ J/mol, ΔH°PCer = 5.77 × 10⁴ J/mol (14) at the transition temperatures of TPSM = 314.0 K (29) and TPCer = 363.2 K (14). The experimental data from Fig. 5 are included again here for comparison: the calculated liquidus matches the experimentally determined liquidus, supporting the proposition that the two lipids are well mixed in the PSM:PCer Lα phase up to at least 50 mol % PCer. The calculated solidus, however, does not agree with the three-phase line at 40°C, providing further evidence that sphingolipid mixing is complex in the solid phase.
Figure 6.
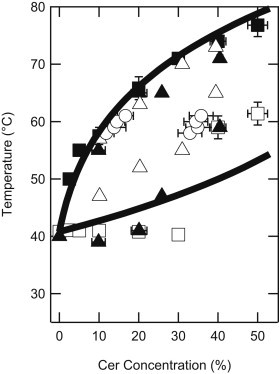
Phase boundaries calculated from regular solution theory based on the assumption of ideal mixing (solid lines) superimposed on the experimental data of Fig. 5.
Discussion
The conversion of SM to Cer is an important but not fully understood process in the early stages of apoptosis. To gain insight into the nature of the physical changes that this transformation produces in the cell membrane, we focused on a controlled model system composed of PSM and PCer. The major findings are
-
1.
the presence of even a small amount of PCer affects the properties of the PSM, and
-
2.
the two lipids mix well in the liquid crystalline state, and for high PCer contents, in the gel state.
Sphingomyelin-ceramide phase behavior
Fig. 7 portrays the essence of the phase diagram (Fig. 5). Two phase boundaries were determined with certainty:
-
1.
an isothermal three-phase line at 41°C up to 30 mol % PCer, and
-
2.
the liquidus that separates the PSM:PCer Lα phase region from the region of phase coexistence below it for PCer concentrations ≥10 mol %.
The three-phase line was indicated by a consistently observed endothermic DSC transition and the appearance of an Lα phase component in the 2H NMR data. The liquidus was defined by the lowest temperatures at which no gel signals were visible in 2H NMR spectra of both sphingolipids, the end-points obtained from 2H NMR spectral subtraction, and the ends of the highest temperature DSC endotherms. Furthermore, all data fell close to the upper phase boundary predicted by theoretical calculations (Fig. 6). The liquidus at low PCer concentrations is determined with less certainty, and indicated by a dotted line.
Figure 7.
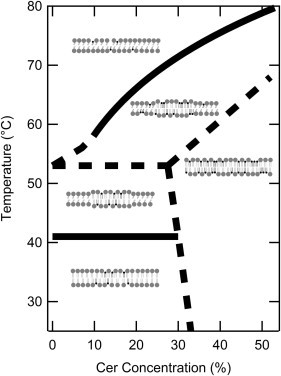
The PSM:PCer partial phase diagram. (Solid lines) Liquidus and the three-phase line at 41°C reflecting the good agreement of DSC and 2H NMR data. Other phase boundaries are expected, and we offer possible locations for these (dashed lines). An interpretation of the phases is also shown and corresponds to labeled regions of the phase diagram in Fig. 5. (Shaded and solid lipids) PSM and PCer, respectively. (Straight tails) Gel phase lipids. (Curvy tails) Lα phase lipids.
Between the three-phase line and the liquidus, the PSM:PCer system exhibits complex phase behavior (e.g., Fig. 4) that is not fully understood. The phase boundaries in this region (Fig. 7, dotted lines) are inferred from the need to separate different parts of the phase diagram but are less clearly indicated by the data. One of the three is an isothermal line shown at 53°C. Gibbs phase rule necessitates the existence of a three-phase line because it separates regions of PSM:PCer Lα+PSM:PCer gel coexistence and PSM Lα +PSM:PCer gel coexistence. Evidence supporting this includes the appearance of Lα PCer, which happens at 51 ± 4°C for ≤30 mol % PCer, and the changes in slope in the M1-T graphs of PSM-D31:PCer near 53°C at 10, 20, and 30% (Fig. 4). The conformational order of PSM’s N-linked chain in the Lα phase increases with increasing PCer concentration. This can be seen clearly in Fig. 2 for PSM at temperatures above the liquidus because M1 is directly proportional to the average value of the CD bond order parameter (40). The incorporation of PCer into PSM is thus consistent with the observed reduction in the rate of change of M1 upon heating.
There are some discrepancies between the phase diagrams in Figs. 5 and 7. First, the deuteration of PSM may lower the melting temperature of PSM slightly (41,42), which would explain why the liquidus determined from spectral inspection of PSM-D31 spectra occurs a degree or two lower than the predicted liquidus. Second, DSC shows a very small endothermic transition at 40°C for 70:30 PSM:PCer (Fig. S1); we interpret this as the melting of a tiny proportion of pure PSM. In contrast, NMR spectra for 74:26 PSM-D31:PCer show no liquid crystalline signal below 47°C. Third, and finally, the phase boundaries separating the single PSM:PCer gel phase region from the neighboring mixed-phase regions are not precisely determined.
Sphingomyelin and ceramide in the gel phase
One striking feature of PSM:PCer membranes is that for all mixtures studied, PCer incorporates into the gel phase membrane with no evidence of solid PCer formation. This is markedly different from, for example, POPC:PCer, where PCer’s solubility limit is only ≈20 mol % (27,43). In contrast, even at 40 mol %, the 2H NMR spectra for our two sphingolipids are nearly identical for each temperature in the gel phase, as reflected in the nearly superimposed M1-T plots (Fig. 4). DSC thermograms of the PSM:PCer membrane, which display multicomponent endotherms from 2.5 to 30 mol % PCer (see Fig. S1 and Busto et al. (38)), become less complex at 40 and 50 mol % PCer with no evidence from DSC of a pure PCer transition close to 90°C, the transition temperature for pure PCer in excess buffer (14). The gel-to-Lα endotherm is significantly narrower in the equimolar system than in 60:40 PSM:PCer; we speculate that the two sphingolipids form an azeotrope at some composition close to equimolar.
Sphingomyelin and ceramide in the liquid crystalline phase
PSM and PCer mix ideally in the liquid crystalline phase, as shown by coincident disappearance of gel phase sphingolipids at the liquidus and by the location of the liquidus on the phase diagram predicted by regular solution theory with ideal mixing assumptions (Fig. 6). PCer concentration dramatically affects PSM:PCer Lα phase formation: at 10% PCer, the liquidus occurs at 56°C as opposed to the 40°C of pure PSM. Thus, a small amount of PCer is sufficient to significantly enhance the ability of the membrane to exhibit some gel phase characteristics at elevated temperatures. Despite mixing ideally in the Lα phase, PSM and PCer do not have identical chain order parameter profiles (Fig. 3): PSM is slightly more ordered, reflecting the influence of the headgroup on the two sphingolipids’ intrinsic chain mobilities.
We know, however, that the N-linked palmitoyl chains of PSM and PCer are kinked similarly because the C2 deuterons of both sphingolipids are inequivalent. Note that the sphingolipid binary membrane is only slightly more ordered than POPC:PCer: 90:10 PSM:PCer has a maximum order parameter of 0.225 at 75°C, whereas 90:10 POPC:PCer has a maximum order parameter of 0.219 at 57°C (27). In contrast, 1:1:1 PCer-D31:Cholesterol:Palmitic acid has a maximum order parameter of 0.43 at 50°C (43), reflecting the enhanced PCer chain order in the presence of cholesterol.
Comparison of DSC and 2H NMR results
Fig. 4 is the first comparison of the integrated calorimetry results with the temperature variation of the 2H NMR M1 done for a membrane composed of two lipids, each being deuterium-labeled (44–46). It is somewhat surprising in that the DSC clearly tracks the changes in M1 exhibited by the minor lipid component at 20 mol % PCer. Because of the dearth of similar published data, it is not known whether this is unusual. Linseisen et al. (46) used one deuterium-labeled lipid (DPPC) in combination with a cationic lipid. DSC and NMR data for the major lipid component (DPPC) appeared to agree well, but when DPPC was only 30% of the membrane, there were differences: the DSC was multicomponent, whereas dM1/dT had only a single peak. We know of no published examples where the minor component in a binary mixture determines the bulk thermal behavior of the membrane. However, we note that for 20 mol % PCer, the integrated DSC does drop slightly at 40°C, as the remaining pure PSM melts. The ensuing DSC integral’s tracking of the PCer-D31 NMR data imply that the PCer absorbs most of the thermal energy, in a cooperative manner, between 45 and 65°C. 2H NMR shows that within this temperature range, the PCer component undergoes a gel to Lα transition.
Recent literature
Recent investigations into the phase behavior of model membranes containing Cer are numerous. We first describe how our work contributes to published data on the binary PSM:PCer sphingolipid system. Busto et al. (38) studied PSM:PCer monolayers and bilayers, and found that between 2.5 and 30 mol % PCer, at least two Cer-containing phases are present, along with a PSM phase. Fig. 7 shows that the composition of the two Cer-containing phases, a PSM:PCer gel phase and a PSM:PCer liquid crystalline phase, varies with temperature. Monolayers of PSM:PCer with 30–40 mol % PCer were identified as stable, composed of only a liquid-condensed phase at 26°C (38). In MLVs, we showed that the pure PSM phase is no longer present at ≥30 mol % PCer. Thus, in this region of the phase diagram there is a single PSM:PCer phase in monolayers and bilayers.
Fig. 8 of Busto et al. (38) shows room temperature giant unilamellar vesicles (GUVs) composed of PSM:PCer in different ratios labeled with the fluorescent probe DiIC18, which is purported to label PSM-enriched domains. We postulate, based on our results, that the PSM-enriched phase in Busto et al. (38) is composed of PSM and probe. The data are generally consistent with coexisting pure PSM and PSM:PCer gel phases. Qualitatively, the 2.5% PCer GUV has dark regions that cover less than one-quarter of the surface. This is consistent with the nearly vertical phase-boundaries at 0 and 32 mol % PCer in our phase diagram (Fig. 7): estimates using the lever rule suggest that this membrane should display 8% dark domains. The 10 mol % PCer GUV’s dark regions cover ∼30% of the visible surface; our phase diagram predicts 31%. The 20 mol % PCer GUV’s dark regions are ∼50% of the visible surface, while our phase diagram’s prediction is 63%. At 30 mol % PCer, dark regions dominate the surface of the GUV, consistent with our phase diagram’s prediction of <10% pure PSM. At 40 mol % PCer GUVs did not form. On the basis of the phase diagram, we expect to have only the PSM:PCer gel phase present at this PCer concentration. Our results are thus consistent with Busto et al.’s conclusion that the PSM-enriched phase is needed for GUV formation.
The GUV results agree remarkably well with the phase diagram especially given that inconsistencies might be expected due to differences among fluorescence microscopy, DSC, and 2H NMR. For example, especially for GUVs having a small proportion of bright phase, the fluorescent probe concentration in this bright phase becomes nonnegligible, e.g., ∼5% probe (instead of the nominal 0.5%) in the 30 mol % PCer GUV. It is likely that the higher probe concentration will increase the amount of PSM-enriched phase present. Despite the overall good agreement, care should be taken as measurements of DiIC18-containing and DiIC18-depleted areas are only semiquantitative. Furthermore, the vesicles shown in Busto et al. (38) represent three-dimensional reconstructions from half-GUVs. The contribution from the other half of the vesicle is unknown, and heterogeneous vesicle populations are the norm in GUV electroformation.
More complex membrane systems
Knowledge of the phase diagram of a simple membrane such as the PSM:PCer system studied here aids the understanding of more complex membrane systems. Such membranes can be broadly categorized into those that have fixed composition, and those that incorporate sphingomyelinase, and hence have variable sphingolipid concentrations.
For those membranes with fixed composition, Cer was found to have a high affinity for ordered domains, whether gel or liquid-ordered phase, in membranes composed of equimolar SM:DOPC or DSPC:DOPC:cholesterol, respectively (47). Using fluorescence anisotropy of trans-parinaric acid, the formation of a PSM:PCer gel phase was observed upon addition of small amounts of PCer to 78:22 PSM:POPC membranes (48). PCer also induces gel phase formation in POPC:PCer in the absence of SM (27). Atomic force microscopy yields additional information into Cer organization within membranes: Cer-enriched gel phases formed in equimolar mixtures of SM:DOPC:cholesterol upon the partial replacement of SM with Cer (31). Megha and London (32) reported that Cer displaces sterol from ordered regions of heterogeneous membranes composed of saturated lipid (DPPC and Cer), low-melting lipid (spin-labeled PC or DOPC), and sterol (Chol and/or dehydroergosterol). In addition, these researchers reported that Cer stabilized ordered domains in the membrane, raising their melting temperature. These findings are all broadly consistent with formation of a stable PSM:PCer gel phase in our binary lipid mixture.
However, Cer-enriched gel phase formation associated with the displacement of cholesterol by Cer appears to depend on lipid composition. Adding cholesterol to 70:30 PSM:PCer causes a homogeneous phase to form at room temperature (30), indicating that Cer, SM, and cholesterol can all interact closely. This result highlights the importance of understanding the interaction energies between pairs of lipids: a possible explanation for cholesterol’s unpredictability is that Cer can only displace cholesterol in an environment that includes a cholesterol sink such as that provided by an unsaturated PC. Busto et al. (30) provided, as an alternative explanation, the stabilization of SM:Cer:Chol ternary phases, with no cholesterol displacement. In principle, it would also be possible that Cer displaces cholesterol to form cholesterol-dense regions, likely leading to crystalline cholesterol monohydrate.
Several studies of the action of sphingomyelinase on SM in multicomponent synthetic membranes, mimicking the early stages of apoptosis, have been published (24,31,49–51). Depending on the precise composition of a membrane, enzyme action generally results in domains that consist of primarily SM and Cer. Necessarily, the local concentration of Cer will vary considerably in these membranes. The knowledge of the structural predispositions of PSM:PCer domains determined here gives insight into the physical state of quasibinary sphingolipid domains in the more complex model membranes. In the absence of cholesterol, small angle x-ray scattering was used to monitor the action of sphingomyelinase on POPC:egg SM compared with equilibrium mixtures of POPC:egg SM:PCer (51). PCer crystal formation occurred at high Cer concentrations (for example, 50:15:35 POPC:egg SM:PCer). Previously we found a solubility limit of 20% PCer in POPC (27), but in this article there is no evidence of PCer solid phase formation. Adding POPC to the binary sphingolipid membrane likely reduces the solubility of PCer as observed (51). When cholesterol is included in the membrane, gel phases can be generated by sphingomyelinase action, such as found in DOPC:stearoylSM:Chol (31). Cer-enriched gel regions were observed in regions of high enzyme activity. Based on our phase diagram, we predict that these gel regions are mainly composed of stearoylSM and stearoylCer.
Conclusion
The conversion of SM to Cer is key to several important cellular processes: the early stages of apoptosis; internalization of membrane lesions needed for cell membrane repair (52); and the formation of the skin barrier, in particular at the stratum granulosum/stratum corneum interface (53). If the conversion is blocked, as in Niemann-Pick disease, abnormalities in membrane function ensue (54). Our study shows conclusively that a Cer-containing gel phase forms with addition of even a small amount of Cer to SM; thus, presumably, the concentration of Cer found in early stage apoptotic plasma membranes is sufficient to cause physical modifications in SM-rich regions.
The lipid composition of the outer leaflet of mammalian plasma membranes is fairly well described by a simple mixture of SM, cholesterol, and a low-melting lipid such as POPC. Sphingomyelinase action on this membrane would result in sphingolipid gel formation, provided that the system’s free energy is minimized when cholesterol associates with the low-melting lipid. We have shown that the gel phase formed by PSM and PCer is more stable than the PSM gel phase, and that there is no PCer crystal formation up to at least 50 mol % PCer. It will be important to further characterize the behavior of cholesterol interacting with SM and Cer to clarify whether, and how, ceramide and cholesterol compete.
Acknowledgments
We thank Joyce Leung for lipid phase illustrations.
J.T. and S.S.W.L. acknowledge the financial support of the Natural Sciences and Engineering Research Council of Canada. F.M.G.’s work was supported by the Spanish Ministry of Economy (grant No. BFU 2007-62062) and by the Basque Government (grant No. GIV 06/42). J.V.B. was supported by the Basque Government.
Supporting Material
References
- 1.Hannun Y.A., Loomis C.R., Bell R.M. Sphingosine inhibition of protein kinase C activity and of phorbol dibutyrate binding in vitro and in human platelets. J. Biol. Chem. 1986;261:12604–12609. [PubMed] [Google Scholar]
- 2.Kolesnick R.N. 1,2-Diacylglycerols but not phorbol esters stimulate sphingomyelin hydrolysis in GH3 pituitary cells. J. Biol. Chem. 1987;262:16759–16762. [PubMed] [Google Scholar]
- 3.Hannun Y.A., Obeid L.M. Many ceramides. J. Biol. Chem. 2011;286:27855–27862. doi: 10.1074/jbc.R111.254359. [DOI] [PMC free article] [PubMed] [Google Scholar]
- 4.Lahiri S., Futerman A.H. The metabolism and function of sphingolipids and glycosphingolipids. Cell. Mol. Life Sci. 2007;64:2270–2284. doi: 10.1007/s00018-007-7076-0. [DOI] [PMC free article] [PubMed] [Google Scholar]
- 5.Goni F.M., Montes L.R., Alonso A. Phospholipases C and sphingomyelinases: lipids as substrates and modulators of enzyme activity. Prog. Lipid Res. 2012;51:238–266. doi: 10.1016/j.plipres.2012.03.002. [DOI] [PubMed] [Google Scholar]
- 6.Stancevic B., Kolesnick R. Ceramide-rich platforms in transmembrane signaling. FEBS Lett. 2010;584:1728–1740. doi: 10.1016/j.febslet.2010.02.026. [DOI] [PMC free article] [PubMed] [Google Scholar]
- 7.Kolesnick R.N., Goñi F.M., Alonso A. Compartmentalization of ceramide signaling: physical foundations and biological effects. J. Cell. Physiol. 2000;184:285–300. doi: 10.1002/1097-4652(200009)184:3<285::AID-JCP2>3.0.CO;2-3. [DOI] [PubMed] [Google Scholar]
- 8.van Blitterswijk W.J., van der Luit A.H., Borst J. Ceramide: second messenger or modulator of membrane structure and dynamics? Biochem. J. 2003;369:199–211. doi: 10.1042/BJ20021528. [DOI] [PMC free article] [PubMed] [Google Scholar]
- 9.Veiga M.P., Arrondo J.L., Alonso A. Ceramides in phospholipid membranes: effects on bilayer stability and transition to nonlamellar phases. Biophys. J. 1999;76:342–350. doi: 10.1016/S0006-3495(99)77201-2. [DOI] [PMC free article] [PubMed] [Google Scholar]
- 10.Carrer D.C., Maggio B. Phase behavior and molecular interactions in mixtures of ceramide with dipalmitoylphosphatidylcholine. J. Lipid Res. 1999;40:1978–1989. [PubMed] [Google Scholar]
- 11.Cremesti A.E., Goni F.M., Kolesnick R. Role of sphingomyelinase and ceramide in modulating rafts: do biophysical properties determine biologic outcome? FEBS Lett. 2002;531:47–53. doi: 10.1016/s0014-5793(02)03489-0. [DOI] [PubMed] [Google Scholar]
- 12.Grassmé H., Riethmüller J., Gulbins E. Biological aspects of ceramide-enriched membrane domains. Prog. Lipid Res. 2007;46:161–170. doi: 10.1016/j.plipres.2007.03.002. [DOI] [PubMed] [Google Scholar]
- 13.Löfgren H., Pascher I. Molecular arrangements of sphingolipids. The monolayer behavior of ceramides. Chem. Phys. Lipids. 1977;20:273–284. doi: 10.1016/0009-3084(77)90068-8. [DOI] [PubMed] [Google Scholar]
- 14.Shah J., Atienza J.M., Shipley G.G. Structural and thermotropic properties of synthetic C16:0 (palmitoyl) ceramide: effect of hydration. J. Lipid Res. 1995;36:1936–1944. [PubMed] [Google Scholar]
- 15.Maggio B. The surface behavior of glycosphingolipids in biomembranes: a new frontier of molecular ecology. Prog. Biophys. Mol. Biol. 1994;62:55–117. doi: 10.1016/0079-6107(94)90006-x. [DOI] [PubMed] [Google Scholar]
- 16.Ramstedt B., Slotte J.P. Sphingolipids and the formation of sterol-enriched ordered membrane domains. Biochim. Biophys. Acta. 2006;1758:1945–1956. doi: 10.1016/j.bbamem.2006.05.020. [DOI] [PubMed] [Google Scholar]
- 17.Goni F.M., Alonso A., Thewalt J.L. Phase diagrams of lipid mixtures relevant to the study of membrane rafts. Biochim. Biophys. Acta. Mol. Cell. Biol. 2008;1781:665–684. doi: 10.1016/j.bbalip.2008.09.002. [DOI] [PMC free article] [PubMed] [Google Scholar]
- 18.Goni F.M., Alonso A. Effects of ceramide and other simple sphingolipids on membrane lateral structure. Biochim. Biophys. Acta Biomembr. 2009;1788:169–177. doi: 10.1016/j.bbamem.2008.09.002. [DOI] [PubMed] [Google Scholar]
- 19.Pinto S.N., Silva L.C., Prieto M. Effect of ceramide structure on membrane biophysical properties: the role of acyl chain length and unsaturation. Biochim. Biophys. Acta. 2011;1808:2753–2760. doi: 10.1016/j.bbamem.2011.07.023. [DOI] [PubMed] [Google Scholar]
- 20.Metcalf R., Pandit S.A. Mixing properties of sphingomyelin ceramide bilayers: a simulation study. J. Phys. Chem. B. 2012;116:4500–4509. doi: 10.1021/jp212325e. [DOI] [PMC free article] [PubMed] [Google Scholar]
- 21.Holopainen J.M., Subramanian M., Kinnunen P.K. Sphingomyelinase induces lipid microdomain formation in a fluid phosphatidylcholine/sphingomyelin membrane. Biochemistry. 1998;37:17562–17570. doi: 10.1021/bi980915e. [DOI] [PubMed] [Google Scholar]
- 22.Fanani M.L., Härtel S., Maggio B. Bidirectional control of sphingomyelinase activity and surface topography in lipid monolayers. Biophys. J. 2002;83:3416–3424. doi: 10.1016/S0006-3495(02)75341-1. [DOI] [PMC free article] [PubMed] [Google Scholar]
- 23.Härtel S., Fanani M.L., Maggio B. Shape transitions and lattice structuring of ceramide-enriched domains generated by sphingomyelinase in lipid monolayers. Biophys. J. 2005;88:287–304. doi: 10.1529/biophysj.104.048959. [DOI] [PMC free article] [PubMed] [Google Scholar]
- 24.Fanani M.L., Hartel S., Oliveira R.G. The action of sphingomyelinase in lipid monolayers as revealed by microscopic image analysis. Biochim. Biophys. Acta. 2010;1798:1309–1323. doi: 10.1016/j.bbamem.2010.01.001. [DOI] [PubMed] [Google Scholar]
- 25.Sot J., Bagatolli L.A., Alonso A. Detergent-resistant, ceramide-enriched domains in sphingomyelin/ceramide bilayers. Biophys. J. 2006;90:903–914. doi: 10.1529/biophysj.105.067710. [DOI] [PMC free article] [PubMed] [Google Scholar]
- 26.Huang H.W., Goldberg E.M., Zidovetzki R. Ceramide induces structural defects into phosphatidylcholine bilayers and activates phospholipase A2. Biochem. Biophys. Res. Commun. 1996;220:834–838. doi: 10.1006/bbrc.1996.0490. [DOI] [PubMed] [Google Scholar]
- 27.Hsueh Y.W., Giles R., Thewalt J. The effect of ceramide on phosphatidylcholine membranes: a deuterium NMR study. Biophys. J. 2002;82:3089–3095. doi: 10.1016/S0006-3495(02)75650-6. [DOI] [PMC free article] [PubMed] [Google Scholar]
- 28.Bunge A., Müller P., Huster D. Characterization of the ternary mixture of sphingomyelin, POPC, and cholesterol: support for an inhomogeneous lipid distribution at high temperatures. Biophys. J. 2008;94:2680–2690. doi: 10.1529/biophysj.107.112904. [DOI] [PMC free article] [PubMed] [Google Scholar]
- 29.Maulik P.R., Shipley G.G. N-palmitoyl sphingomyelin bilayers: structure and interactions with cholesterol and dipalmitoylphosphatidylcholine. Biochemistry. 1996;35:8025–8034. doi: 10.1021/bi9528356. [DOI] [PubMed] [Google Scholar]
- 30.Busto J.V., Sot J., Alonso A. Cholesterol displaces palmitoylceramide from its tight packing with palmitoylsphingomyelin in the absence of a liquid-disordered phase. Biophys. J. 2010;99:1119–1128. doi: 10.1016/j.bpj.2010.05.032. [DOI] [PMC free article] [PubMed] [Google Scholar]
- 31.Chiantia S., Kahya N., Schwille P. Effects of ceramide on liquid-ordered domains investigated by simultaneous AFM and FCS. Biophys. J. 2006;90:4500–4508. doi: 10.1529/biophysj.106.081026. [DOI] [PMC free article] [PubMed] [Google Scholar]
- 32.Megha M., London E. Ceramide selectively displaces cholesterol from ordered lipid domains (rafts): implications for lipid raft structure and function. J. Biol. Chem. 2004;279:9997–10004. doi: 10.1074/jbc.M309992200. [DOI] [PubMed] [Google Scholar]
- 33.Davis J.H., Jeffrey K.R., Higgs T.P. Quadrupolar echo deuteron magnetic resonance spectroscopy in ordered hydrocarbon chains. Chem. Phys. Lett. 1976;42:390–394. [Google Scholar]
- 34.Morrow M.R., Srinivasan R., Grandal N. The phase diagram of dimyristoyl phosphatidylcholine and chain-perdeuterated distearoyl phosphatidylcholine—a deuterium NMR spectral difference study. Chem. Phys. Lipids. 1991;58:63–72. [Google Scholar]
- 35.Vist M.R., Davis J.H. Phase equilibria of cholesterol/dipalmitoylphosphatidylcholine mixtures: 2H nuclear magnetic resonance and differential scanning calorimetry. Biochemistry. 1990;29:451–464. doi: 10.1021/bi00454a021. [DOI] [PubMed] [Google Scholar]
- 36.Mehnert T., Jacob K., Beyer K. Structure and lipid interaction of n-palmitoylsphingomyelin in bilayer membranes as revealed by 2H-NMR spectroscopy. Biophys. J. 2006;90:939–946. doi: 10.1529/biophysj.105.063271. [DOI] [PMC free article] [PubMed] [Google Scholar]
- 37.Catapano E.R., Arriaga L.R., López-Montero I. Solid character of membrane ceramides: a surface rheology study of their mixtures with sphingomyelin. Biophys. J. 2011;101:2721–2730. doi: 10.1016/j.bpj.2011.10.049. [DOI] [PMC free article] [PubMed] [Google Scholar]
- 38.Busto J.V., Fanani M.L., Alonso A. Coexistence of immiscible mixtures of palmitoylsphingomyelin and palmitoylceramide in monolayers and bilayers. Biophys. J. 2009;97:2717–2726. doi: 10.1016/j.bpj.2009.08.040. [DOI] [PMC free article] [PubMed] [Google Scholar]
- 39.Heimburg T. Wiley-VCH Verlag; Weinheim, Germany: 2007. Thermal Biophysics of Membranes. [Google Scholar]
- 40.Davis J.H. The description of membrane lipid conformation, order and dynamics by 2H-NMR. Biochim. Biophys. Acta. 1983;737:117–171. doi: 10.1016/0304-4157(83)90015-1. [DOI] [PubMed] [Google Scholar]
- 41.Morse R., Ma L.D., Dunn F. Ultrasound interaction with large unilamellar vesicles at the phospholipid phase transition: perturbation by phospholipid side chain substitution with deuterium. Chem. Phys. Lipids. 1999;103:1–10. doi: 10.1016/s0009-3084(99)00068-7. [DOI] [PubMed] [Google Scholar]
- 42.Aussenac F., Laguerre M., Dufourc E. Detailed structure and dynamics of bicelle phospholipids using selectively deuterated and perdeuterated labels. 2H NMR and molecular mechanics study. Langmuir. 2003;19:10468–10479. [Google Scholar]
- 43.Brief E., Kwak S., Lafleur M. Phase behavior of an equimolar mixture of n-palmitoyl-d-erythro-sphingosine, cholesterol, and palmitic acid, a mixture with optimized hydrophobic matching. Langmuir. 2009;25:7523–7532. doi: 10.1021/la9003643. [DOI] [PubMed] [Google Scholar]
- 44.Morrow M.R., Huschilt J.C., Davis J.H. Simultaneous modeling of phase and calorimetric behavior in an amphiphilic peptide/phospholipid model membrane. Biochemistry. 1985;24:5396–5406. doi: 10.1021/bi00341a018. [DOI] [PubMed] [Google Scholar]
- 45.Morrow M.R., Davis J.H. Calorimetric and nuclear-magnetic-resonance study of the phase-behavior of dilauroylphosphatidylcholine water. Biochim. Biophys. Acta. 1987;904:61–70. [Google Scholar]
- 46.Linseisen F., Bayerl S., Bayerl T. 2H-NMR and DSC study of DPPC-DODAB mixtures. Chem. Phys. Lipids. 1996;83:9–23. [Google Scholar]
- 47.Wang T.Y., Silvius J.R. Sphingolipid partitioning into ordered domains in cholesterol-free and cholesterol-containing lipid bilayers. Biophys. J. 2003;84:367–378. doi: 10.1016/S0006-3495(03)74857-7. [DOI] [PMC free article] [PubMed] [Google Scholar]
- 48.Castro B.M., de Almeida R.F.M., Prieto M. Formation of ceramide/sphingomyelin gel domains in the presence of an unsaturated phospholipid: a quantitative multiprobe approach. Biophys. J. 2007;93:1639–1650. doi: 10.1529/biophysj.107.107714. [DOI] [PMC free article] [PubMed] [Google Scholar]
- 49.Ira S., Zou S., Johnston L.J. Enzymatic generation of ceramide induces membrane restructuring: correlated AFM and fluorescence imaging of supported bilayers. J. Struct. Biol. 2009;168:78–89. doi: 10.1016/j.jsb.2009.03.014. [DOI] [PubMed] [Google Scholar]
- 50.Silva L.C., Futerman A.H., Prieto M. Lipid raft composition modulates sphingomyelinase activity and ceramide-induced membrane physical alterations. Biophys. J. 2009;96:3210–3222. doi: 10.1016/j.bpj.2008.12.3923. [DOI] [PMC free article] [PubMed] [Google Scholar]
- 51.Boulgaropoulos B., Amenitsch H., Pabst G. Implication of sphingomyelin/ceramide molar ratio on the biological activity of sphingomyelinase. Biophys. J. 2010;99:499–506. doi: 10.1016/j.bpj.2010.04.028. [DOI] [PMC free article] [PubMed] [Google Scholar]
- 52.Tam C., Idone V., Andrews N.W. Exocytosis of acid sphingomyelinase by wounded cells promotes endocytosis and plasma membrane repair. J. Cell Biol. 2010;189:1027–1038. doi: 10.1083/jcb.201003053. [DOI] [PMC free article] [PubMed] [Google Scholar]
- 53.Kitson N., Thewalt J., Bloom M. A model membrane approach to the epidermal permeability barrier. Biochemistry. 1994;33:6707–6715. doi: 10.1021/bi00187a042. [DOI] [PubMed] [Google Scholar]
- 54.Schuchman E.H. Acid sphingomyelinase, cell membranes and human disease: lessons from Niemann-Pick disease. FEBS Lett. 2010;584:1895–1900. doi: 10.1016/j.febslet.2009.11.083. [DOI] [PubMed] [Google Scholar]
Associated Data
This section collects any data citations, data availability statements, or supplementary materials included in this article.