

Abstract
There is now widespread agreement that individual variation in the neural circuits representing the reinforcing properties of foods may be associated with risk for overeating and obesity. What is currently unknown is how and whether brain response to a food is related to immediate subsequent intake of that food. Here we used functional magnetic resonance imaging (fMRI) to test whether response to a palatable milkshake is associated with subsequent ad libitum milkshake consumption. We predicted that enhanced responses in key reward regions (insula, striatum, midbrain, medial orbitofrontal cortex) and decreased responses in regions implicated in self-control (lateral prefrontal and lateral orbitofrontal cortex) would be associated with greater intake. We found a significant positive association between response to milkshake in the periaqueductal gray region of the midbrain and ad libitum milkshake intake. Although strong bilateral insular responses were observed during consumption of the milkshake this response did not correlate with subsequent intake. The associations observed in the midbrain and orbitofrontal cortex were uninfluenced by ratings of hunger, which were near neutral. We conclude that midbrain response to a palatable food is related to eating in the absence of hunger.
Keywords: Neuroimaging, Feeding, Flavor, Obesity, Midbrain, Periacqueductal gray, PAG, Decision making, Dopamine, Insula, Cannabinoid, Opiod, Pain
The hedonic properties of food can drive the motivation to eat beyond homeostatic energy needs (Kenney, 2011; Zheng et al., 2009). In an early neuroimaging study of feeding we showed that response to chocolate consumption in the insula/operculum, midbrain, striatum, and medial orbitofrontal cortex decreased as motivation to consume the chocolate decreased, whereas response in the lateral orbitofrontal cortex and lateral prefrontal cortex increased (Small et al., 2001). We suggested that these two circuits governed meal initiation and meal termination, respectively.
Since this time functional neuroimaging studies have elucidated brain response to food pictures, odors and flavors across differing internal states (Cornier et al., 2007; Frank et al., 2010; Führer et al., 2008; Goldstone et al., 2009; La Bar et al., 2001; Malik et al., 2008; O’Doherty et al., 2000; Siep et al., 2009), body weights (Rothemund et al., 2007; Stice et al., 2008; Stoeckel et al., 2008), eating phenotypes (e.g. restraint, food addiction) (Beaver et al., 2006; Demos et al., 2011; Lowe et al., 2009b) and as a function of prospective weight gain (Stice et al., 2008; Stice et al., 2010) or loss (Cornier et al., 2012). Enhanced responses in regions thought to represent the reinforcing properties of foods, such as the insula/operculum, midbrain, medial orbitofrontal cortex, striatum and insula are associated with higher body mass index (BMI) (Rothemund et al., 2007; Stice et al., 2008; Stice et al., 2010; Stoekel et al., 2008). In contrast, reduced responses in regions critical for inhibitory behavior and self-control, such as the lateral orbitofrontal cortex and lateral prefrontal cortex (Hollmann et al., 2012; Hare et al., 2011) are often associated with higher BMI (Batterink et al., 2010; Volkow et al., 2009). There is also evidence for reduced grey matter density in lateral prefrontal cortex in obesity (Pannacciulli et al., 2006). Consequently, an important theme to emerge is that heightened reward responses, coupled with decreased inhibitory control, increase risk for overeating and weight gain (Del Parigi et al., 2003; Small, 2009; Volkow and Wise, 2005). What is less understood is how brain response to a food relates to subsequent intake of that food. Batterham and colleagues showed that the neural activity recorded during an fMRI scan could predict subjects’ subsequent caloric intake (Batterham et al., 2007). However the scanning paradigm was unrelated to the test meal as no food or food-related cues were presented during scanning. This is an important issue because the relationship between brain response to a food and its subsequent intake is presumably an important mediator of the relationship between brain response to food and body weight.
The aim of the current fMRI study was to address this gap in the literature by identifying regions in which response to a palatable and energy-dense milkshake is associated with the immediate subsequent intake of that milkshake in non-deprived individuals who self-report being neither hungry nor full. We reasoned that there would be automatic engagement of circuits coding the appetitive aspects of the stimulus as well as circuits representing inhibitory control in the face of consuming a palatable food. An overarching prediction was that greater responses in brain regions representing the reinforcing properties of foods would be positively associated with intake while reduced responses in regions representing response inhibition and self-control would be negatively associated with intake.
Methods
Subjects
Twenty-three right-handed nonsmokers, taking no daily medication and having no known history of loss of consciousness, chemosensory impairment, neurological, or psychiatric disorders, gave written informed consent to participate in our study that was approved by Yale University School of Medicine Human Investigation Committee. Two subjects were excluded because of excessive movement during scanning, which was defined as greater than 2mm movement in any direction. An additional subject was excluded because assessment of ad libitum milkshake consumption indicated that this person drank 1028 gams of milkshake, which corresponds to 3.07 standard deviations more than the mean of other subjects. We therefore excluded the data point, but note that including the subject in the group analyses does not influence the results reported below. The results of the study are therefore based on the remaining 20 subjects (10 women, 10 men, mean age 27.0 ± 6.2 years, mean BMI 25.8 ± 4.0 (range = 20.8 to 35.7), with an Edinburgh Handedness Inventory score (1) ranging between 55–100).
Stimuli and delivery
Stimuli included Nestle’s chocolate milkshake and a tasteless baseline solution. The tasteless solution consisted of 12.5 mM KCl and 1.25 mM NaHCO3 in distilled water. Four different concentrations were presented (25%, 50%, 75%, and 100% of the original concentration) and subjects were instructed to select the dilution that tasted most like nothing. The chosen concentration was used as the tasteless stimulus. Seventeen subjects chose the 25% solution, two chose the 50% solution, and one chose the 75% solution. Liquids were delivered as 1 ml of solution over 4 s using a gustometer system described previously (22). In brief, this system consists of computer controlled syringe pumps connected to an fMRI-compatible custom designed gustatory manifold via 25-foot lengths of beverage tubing (Saint-Gobain Performance Plastics). The manifold is mounted on the headcoil and liquids dripped from the manifold stylus onto the tongue.
Experimental Design
Subjects participated in one fMRI training session and one fMRI scanning session conducted on separate days. Subjects were instructed to arrive feeling neither hungry nor full and to abstain from eating or drinking anything (except water) for 1 h before both sessions. No other dietary instructions were provided. However, subjects rated their hunger upon arrival and these ratings were intended to exclude subjects reporting subjective hunger or fullness within 20 points of neutral. No subjects were excluded based upon this criterion. All scans were performed between 11 am and 3 pm. For the 10 women, the average days since the first day of their menstrual cycle was 14.6 but the range was large (2–24 days).
Training Session
Upon arrival to the training session, subjects first selected their tasteless solution. Next, after being inserted into the mock scanner bore, subjects provided a series of ratings using a mouse to move a curser to a desired location along a line on a computer screen. Subjects started by rating feelings of hunger and fullness using 20 mm visual analog scales (VAS) with the following labels: at the left anchor (−100), “I am not hungry at all” or “I am not full at all”; at the midpoint (0), “neutral”; and at the right anchor (+100), “I have never been more hungry” or “I have never been more full”. Stimulus intensity was measured using the general Labeled Magnitude Scale (gLMS; Green et al., 1996), a 100 mm vertical line scale anchored by the labels “no sensation” at the bottom and the label “strongest imaginable sensation” at the top. In between these anchors the following words were quasi-logarithmically spaced in ascending order: “barely detectable”, “weak”, “moderate”, “strong”, and “very strong”. Subjects rated pleasantness using a 100 mm Labeled Hedonic Scale (Lim, 2009) anchored by “most disliked imaginable” at the bottom anchor point (−100), “neutral” in the center (0), and “most liked imaginable” at the top anchor point (100). Importantly, this scale, which produces ratio-like data and minimizes ceiling effects was created by placing descriptors at locations corresponding to direct estimation of perceptual and psychological magnitude made by the subjects. Therefore perceptual units are not equal. For example 44 corresponds to “like very much”. Another important feature of the scale is that it assesses liking across all possible sensations. For reference, in the original paper French fries received a liking rating of 26. Ratings of wanting to eat were measured using a VAS scale labeled as follows: at the left anchor, “I would never want to eat this”; at the middle point, “neutral”; and at the right anchor, “I would want to eat this more than anything”.
After completing the ratings, subjects underwent a single mock run, which served to familiarize them with the procedure. During the mock and real runs, stimuli were delivered according to a long event-related design (Small et al., 2003; Small et al., 2004). Either a milkshake or a tasteless solution was presented to the subject for 4 s. After a 3–10 s wait, the milkshake was followed by a 4 s tasteless rinse. Before the onset of the next trial, there was a 3–10 s wait. Subjects were instructed to hold the solution in their mouths until they had received the full amount of the liquid and then to swallow during the wait. A single mock run, with a duration of 5 min 54 s and consistent of 11 presentation of each stimulus, was performed. After the mock run, subjects were asked to provide a second set of ratings.
After the mock scan, height and weight were measured using a Detecto 439 Mechanical Scale (footwear and coats removed) and BMI was calculated [BMI= weight (kg)/height (m)2]. Eating style was then measured with the Three Factor Eating Questionnaire (TFEQ) (Stunkard and Messick, 1985) and the Power of Food Scale (Lowe et al., 2009).
fMRI Session
Before and after the fMRI scan, subjects provided their internal state and stimulus ratings. Once inside the fMRI scanner, subjects performed one anatomical run and two functional runs (22 repeats of each stimulus). After undergoing the fMRI scan subjects were removed from the scanner bore and brought to a separate room where they were offered a full bottle of chocolate milkshake (1656.12 mL) to drink while the experimenters broke down the delivery equipment. When the experimenters returned (10 minutes) they debriefed the subject and measured the amount of milkshake consumed.
fMRI Data Acquisition
The images were acquired on a Siemens 3 T Trio magnetom scanner at Yale University Magnetic Resonance Research Center, using parameters similar to previous studies. Susceptibility-weighted single-shot echoplanar imaging was used to measure the blood oxygenation-level dependent (BOLD) signal as an indication of cerebral brain activation with TR, 2000 ms; TE, 20 ms; flip angle, 80°; FOV, 220 mm; matrix, 64 × 64; slice thickness, 3 mm; and acquisition of 40 contiguous slices. Slices were acquired in an interleaved mode. The MR signal was allowed to equilibrate at the beginning of each functional run over six scans for a total of 12 s, which were then excluded from analysis. A high-resolution T1-weighted three-dimensional anatomical scan was acquired with the following parameters: TR/TE, 2530/3.66 ms; flip angle, 20°; matrix, 256 × 256; 1 mm thick slices; FOV, 256; 176 slices.
Analysis of Behavioral and BMI Data
We performed Pearson’s correlations in SPSS 16.0.0 for Windows in order to evaluate whether any of the multiple measures that were recorded (BMI, hunger, fullness, intensity, pleasantness, wanting to eat) were associated with ad libitum milkshake intake.
Analysis of FMRI Data
Data were analyzed using SPM5 software (Statistical Parametric Mapping; Wellcome Department of Imaging Neuroscience, London, UK). Functional images were time-acquisition corrected to the slice obtained at 50% of the TR and realigned to the mean image. Anatomical and functional images were normalized and segmented using the VBM toolbox in SPM5. Functional time-series data was detrended, a method that eliminates at each voxel any linear component matching the global signal (Macey et al., 2004). Functional images were smoothed using a 6 mm full-width at half maximum isotropic Gaussian kernel. Sessions in which head movement during scanning exceeded a predetermined limit of 1 mm in any direction were excluded.
A design matrix was created at the individual subject level, which identified the onset and duration of each event. Events of interest were defined as mini-blocks with a duration of 4 s after onset (when solution entered the subject’s mouth). Milkshake and tasteless presentations were modeled as events of interest. According to SPM5 convention, a 128 high-pass filter was applied to the time-series data with the aim to remove low-frequency noise and slow signal drifts. General linear model was used to estimate, at each voxel, condition-specific effects. A canonical hemodynamic response function, including a temporal derivative, was used to model neural response to events.
To assess group effects, the parameter estimate images for the conditions for each subject were entered into an ANOVA contrasting Milkshake - Tasteless. T-map threshold was set at p uncorrected < 0.001 and a 3-voxel cluster size. Unpredicted responses were considered significant at p < 0.05 false discovery ratio (FDR) corrected across the entire brain for multiple comparisons. For predicted responses the WFU Pick Atlas tool in SPM5 was used to perform region of interest (ROI) analyses to test for chemosensory activations (e.g. insula, orbitofrontal cortex) to milkshake – tasteless and peaks were considered significant at p < 0.05 FDR corrected across the total number of voxels across all ROIs (Maldjian et al., 2003). Small-volume searches with ROIs defined using peaks from Small et al 2001 to create 15 mm diameter spheres were performed to test whether response in the midbrain, insula, striatum and medial and lateral OFC were related to intake.
Next, we regressed ad libitum milkshake intake, BMI, hunger, and pleasantness ratings against BOLD response to Milkshake – Tasteless across all of the subjects in a whole-brain regression analysis in SPM5. This analysis was used to test whether and where we observe significant correlations in neural response to milkshake and any of these variables. The parameter estimate images from the Milkshake - Tasteless contrast were entered into a regression design along with a vector of the variable of interest (milkshake intake, BMI, hunger, or pleasantness rating).
Three additional regression analyses were performed in which ad libitum milkshake intake was treated as a regressor of interest, whereas BMI, hunger, or pleasantness respectively were included as nuisance variables. The resulting correlation maps specifically show regions that show a response with ad libitum milkshake intake that is independent of BMI, hunger, or pleasantness.
Results
Behavioral Results
Average hunger and fullness ratings were near neutral before and after scanning ((mean ± SEM) hunger before scan: 8.92 ± 6.83; hunger after scan: 12.24 ± 7.21; fullness before scan: −14.95 ± 7.98; fullness after scan: −19.20 ± 7.14) and did not differ as a function of time (hunger, F(1,19) = 0.345, p = 0.564; fullness, F(1,19) =0.231, p = 0.636). Before and after scanning, the milkshake was rated as pleasant (before scan: 26.34 ± 3.04; after scan: 25.19 ± 3.05 – note that a score of 17 corresponds to “like moderately” and a score of 44 to “like very much” with reference to all hedonic sensations imaginable), moderately intense (before scan: 20.95 ± 2.30; after scan: 20.05 ± 2.02), and wanted (before scan: 29.68 ± 4.83; after scan: 20.32 ± 6.03). There was no significant effect of time on pleasantness (F(1,19) = 3.754, p = 0.068) or intensity ratings (F(1,19) = 0.803, p = 0.382) but wanting ratings decreased pre to post scan (F(1,19) = 7.445, p = 0.013). The tasteless solution was rated as neutral in pleasantness (before scan: −0.47 ± 1.93; after scan: 0.66 ± 2.23), barely detectable in intensity (before scan: 3.40 ± 0.63; after scan: 3.34 ± 0.70), and moderately unwanted (before scan: −15.26 ± 7.72; after scan: −15.82 ± 7.24), with no significant effects of time (pleasantness, F(1,19) = 0.298, p = 0.592; intensity, F(1,19) = 0.015, p = 0.903; wanting, F(1,19) = 0.015, p =0.904). The milkshake was rated as significantly more pleasant (F(1,18)=54.38, p<0.001), more intense (F(1,19)=83.823, p<0.001), and more wanted (F(1,17)=31.12, p<0.001) than the tasteless solution.
Following the scan subjects consumed on average 216.91 ± 187.8 milliliters of milkshake, equivalent to 166.51 calories. To address whether quantity of ad libitum milkshake consumption was related to BMI, ratings of internal state or milkshake, or eating style, we correlated milliliters drank with each of these variables across subjects. How much milkshake a subject drank was not correlated with BMI (r = −0.015, p = 0.951), hunger (r = 0.120, p = 0.615), fullness (r = 0.203, p = 0.390), pleasantness (r = 0.284, p = 0.225), intensity (r = −0.175, p = 0.460), wanting of the milkshake (r = 0.315, p = 0.189), or eating style (TFEQ restraint, r = 0.226, p = 0.353; TFEQ disinhibition, r = −0.199, p = 0.415; TFEQ hunger, r = −0.152, p = 0.534; PFS, food available, r = −0.076, p = 0.758; food present, r = −0.054, p = 0.826; food tasted, r = −0.078, p = 0.750).
fMRI Results
A main effect of milkshake vs. tasteless was observed in the mid insula bilaterally, indicating that the task activates the expected chemosensory area (Figure 1). A full list of the activations that resulted from the main stimulus contrast can be found in Table 1.
Figure 1. fMRI Results.
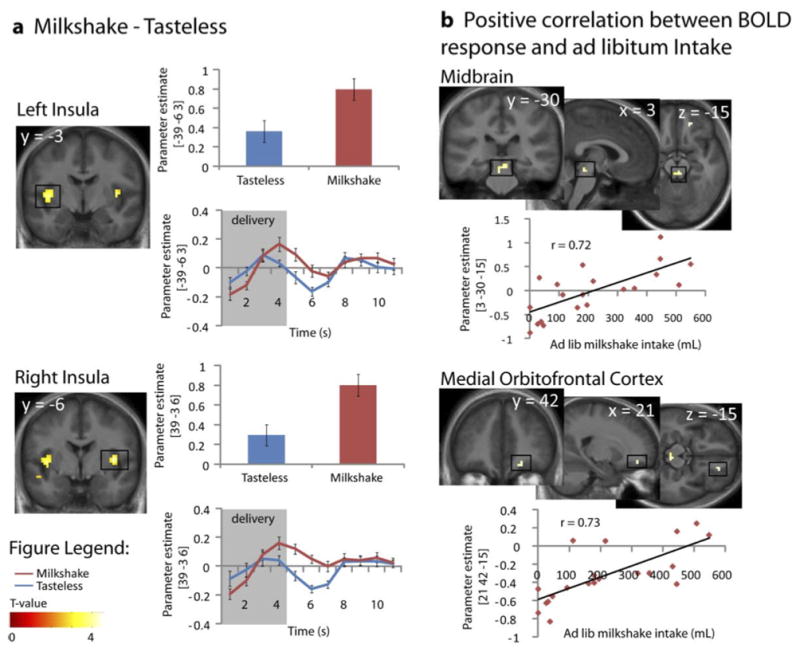
Images displayed at p < 0.005. Color bar depicts T-values. A. Significant response in the left and right mid-insula to Milkshake – Tasteless. Bar graphs for tasteless solution (blue) and milkshake (red) (from the peak voxel). Time courses for tasteless solution (blue) and milkshake (red) (from the peak voxel). B. Positive correlation between BOLD response and ad libitum intake. Response in the midbrain is positively related to intake. The scatter plots illustrate the correlation between ad libitum milkshake intake (x-axis), and parameter estimate (PE) (y-axis).
Table 1.
| x,y,z MNIa | Kb | Z | PFDR | |
|---|---|---|---|---|
| Main effect Milkshake – Tasteless | ||||
| Right mid-insula | 39 −3 6 | 22 | 4.86 | 0.030c |
| Left mid-insula | −39 −6 3 | 51 | 4.28 | 0.042d |
| Left Anterior insula | −33 18 6 | 5 | 3.29 | 0.072d |
| Positive Correlation of Milkshake – Tasteless and Ad Lib Intake | ||||
| Right medial OFC | 21 42 −15 | 4 | 3.67 | 0.061d |
| Covariate: BMI | 4 | 3.57d | ||
| Covariate: Hunger | 4 | 3.86d | ||
| Covariate: Wanting | 9 | 3.41d | ||
| Covariate: Pleasantness | 4 | 3.40d | ||
| Midbrain | 3 −30 −15 | 9 | 3.59 | 0.045d |
| −3 −30 −21 | 3.38 | 0.999d | ||
| Covariate: BMI | 10 | 3.69d | ||
| Covariate: Hunger | 11 | 3.56d | ||
| Covariate: Wanting | 5 | 3.37d | ||
| Covariate: Pleasantness | 4 | 3.31f | ||
Italics indicate that a peak falls under the same cluster as the preceding peak;
Cluster size in voxels;
Significant at PFDRcorrected = 0.05 across the whole brain
Significant at PFDRcorrected = 0.05 across SVCs;
Significant at PFDRcorrected = 0.05 across the ROIs;
Thresholded at p = 0.05
Next, we examined the relationship between brain activity and milkshake consumption by regressing ad libitum milkshake intake against BOLD response to milkshake vs. tasteless. As predicted, a significant positive association was observed between intake and response in the midbrain (Table 1; Figure 1). We also observed a trend towards a similar positive relationship between intake and activity in the mOFC (Table 1; Figure 1). However, no other positive correlations were observed and none of the predicted negative associations were observed. Unexpectedly, the midbrain activation that was observed originates from the peri-aqueductal gray (PAG) region rather than the ventral tegmental area (Mai, Assheuer and Paxinos, 2004). Since there is evidence that spatial normalization procedures aimed at whole brain registration may have shortcomings in the midbrain we re-did the analysis using the Automated Brainstem Coregistration method outlined by Napadow and colleagues (2006). Spatial coregistration was performed in two steps. First, we derived a globally defined affine transformation and then we refined this transformation by using a brainstem-weighted affine transform (MNI-152 brainstem mask). This analysis again produced significant activation centered around the PAG (−3, −31, −20; k = 15; z = .05; data not shown).
No significant associations were observed between behavioral measures (BMI, hunger, wanting, and pleasantness) and BOLD response. Including BMI, hunger, and wanting as covariates did not markedly change the magnitude of the relationship between the midbrain and mOFC response and ad libitum milkshake intake (Table 1). However, when pleasantness was included as a covariate the association between milkshake intake and the BOLD response in both the midbrain and the mOFC became weaker (non-significant at p < 0.005 uncorrected for multiple comparisons). We therefore performed a mediation analysis to test whether pleasantness ratings mediated the relation between BOLD response in midbrain and mOFC and subsequent intake. They did not (p =.54 for the midbrain and p = .16 for the mOFC).
Finally, to test for non-linear effects we examined brain response to milkshake minus tasteless with three additional regressors; quadratic, cubic and log transformations of the original intake regressor. The medial OFC showed non-significant trends with the quadratic and cubic transformations. No other effects were observed.
Discussion
The primary aim of this study was to test whether response to tasting small quantities of milkshake predicts subsequent milkshake intake in subjects who report being neither hungry nor full. In other words, we wished to isolate regions of the brain that might promote eating in the absence of hunger. Our primary prediction was that enhanced responses in the midbrain, insula, striatum and medial OFC and decreased responses in lateral OFC and lateral prefrontal cortex to the taste of milkshake would be associated with milkshake intake. In keeping with our prediction, response in the midbrain, possibly corresponding to the PAG, was positively associated with immediate subsequent ad libitum intake of milkshake. Also consistent with our hypothesis was a trend towards a similar effect in the medial OFC. However, in contrast to our hypotheses no relationships were observed in the insular, striatum, lateral OFC or lateral prefrontal cortex.
In humans, midbrain response to chocolate consumption correlates positively with pleasantness ratings (Small et al, 2001), while response here to food pictures has been shown to correlate with individual differences in sensitivity to reward (Beaver et al., 2006) and with behavioral preferences for foods (O’Doherty et al., 2006). Frank and colleagues found that midbrain response to the taste of sucrose, but not sucralose, correlates with ratings of stimulus pleasantness (Frank et al., 2008), which suggests that the midbrain response to pleasurable foods is also dependent upon metabolic effects. However, an important consideration is that the effects reported in these studies appear to be largely restricted to the ventral tegmental area and substantia nigra. In contrast, in the current study, the midbrain response can be localized primarily to the PAG. This dorsomedial region of the midbrain has a well-known role in pain, but there is only indirect evidence implicating the region in feeding. First, the PAG is rich in opioid receptors and endogenous opioid peptides (Gutstein et al., 1998; Mansour et al., 1995a; Mansour et al., 1995b). Naturally occurring opioids have been repeatedly implicated in the hedonic aspects of feeding (Peciña et al., 2006), enhancing food palatability and contributing to the consummatory experience of “liking” (Kelley et al., 2002; Wassum et al., 2009; Yeomans and Gray, 1996; 2002). Therefore it is possible that the association we observed reflects a relationship between opiod signaling in the region and subsequent food intake. However, arguing against this possibility, while we found that inclusion of subjective pleasantness, but not hunger ratings, impacted the relationship between midbrain response and intake, pleasantness ratings did not mediate the effect of the midbrain on intake. This suggests that midbrain responses might reflect an aspect of reward that was not assessed in the current study, such as incentive motivation or the reinforcement value of the food. Consistent with this possibility, medial prefrontal cortex projections to the PAG (Mota-Ortiz et al., 2009) are thought to be critically involved in opiod activation of the PAG to promote food foraging behavior in rats (Miranda-Paiva et al., 2003).
Another possibility is that the BOLD signal reflects cannabinoid signaling. Intravenous injection of the synthetic cannabinoid agonist HU210 modulates BOLD responses in the mouse PAG (Shah et al., 2004), which is intriguing since cannabinoid agonists produce clear hyperphagia (Abel, 1971; Williams et al., 1998; Koch, 2001 and Higgs et al., 2003).
Finally, there are dopamine neurons in the PAG, also known as the A10 dorsocaudal group (Hokfelt et al., 1984; Hasue and Shammah-Lagnado, 2002). Although the role for these cells in reward has not been well studied, they have been implicated in mediating the rewarding and sensitizing properties of heroin (Flores et al., 2006). Whether PAG dopamine neurons, like the ventral tegmental dopamine neurons (Abizaid et al., 2006a; Berthoud, 2002) are directly modulated by hormones to promote eating is unknown. However, it is nevertheless possible that the association between PAG response to milkshake and intake reflects dopaminergic activity in this region.
One potentially fruitful avenue for future research will be to include the PAG in region of interest analyses that have been used to evaluate the influence of dopamine, cannabinoid, and opiod antagonism on brain response to food (e.g. Rabiner et al., 2011; Dodds et al., 2012). Additionally, it would be interesting to test whether common polymorphisms that are related to food intake and dopamine or opiod signaling may influence the association between PAG response and intake. For example, Davis and colleagues reported that obese individuals are more likely to possess the G allele of the A118G polymorphism of the mu-opiod receptor gene (Davis et al., 2009) if they carry a diagnosis of binge eating disorder. Testing whether the association between PAG response to palatable food and intake is modulated by this genotype might provide insight into the neurochemistry behind BOLD responses observed here.
Like the midbrain and medial OFC, response in the insula is positively associated with reported pleasure during chocolate consumption (Small et al., 2001). The insula has also been implicated in compulsive eating (Woolly et al., 2007) and in weight gain in youth at risk for obesity by virtue of parental obesity (Stice et al., 2011). Response here remains elevated in post-obese individuals (Del Parigi et al., 2004) and it was recently reported that weight loss is associated with a reduction in insular responses (Cornier et al., 2012). These data strongly suggest that variation in insular response may be associated with susceptibility for weight gain. However, in the current study, although we observed strong insular responses to milkshake – tasteless in the insula, this response was unrelated to subsequent intake. This suggests that the role the insular cortex plays in regulating (or dysregulating) feeding is more likely related to variations in homeostatic or internal state controls rather than in the influence of the hedonic aspects of food to influence consumption. This possibility is consistent with the fact that the insula is sensitive to hunger states (Tataranni et al., 1999) and that response to food cues is modulated by endocrine factors such as ghrelin (Malik et al., 2008). Another possibility is that insular responses reflect an interaction between internal state and the appetitive characteristics of foods to influence intake. In this case we would have failed to observe an association because our subjects were not hungry.
We also failed to observe associations between lateral OFC or lateral prefrontal cortex and intake. These regions have been shown to play an important role in inhibiting hedonic eating (Hare et al., 2008 and 2011) and in consciously regulating desire for food upon exposure to food images (Wang et al., 2009; Hollmann et al., 2012). Both areas are also less responsive to food cues in individuals with high vs. low BMI (Batterlink et al., 2010; Del Parigi et al., 2003; Volkow et a., 2009). There are a variety of possible reasons for this lack of association. Most notably, our paradigm did not measure choice or explicit attempts to exercise self-control, nor did we examine intake of foods other than the milkshake. Therefore it is critical to interpret this negative finding with caution. Our group of subjects also all scored low on self-reported disinhibition towards foods, with all but one subject scoring between a 2 and an 8 on this subscale of the Three Factor Eating questionnaire. Finally, women were scanned in various phases of the menstrual cycle, which might have contributed to increased variance in response. It will be important for future studies to consider these and other factors to have a more comprehensive understanding of brain responses that predict ad libitum intake.
In summary, our findings show that response in the PAG to the taste of milkshake positively predicts immediate subsequent ad libitum intake of that milkshake, thus linking brain response in this region with feeding behavior. We suggest that this result provides support for the possibility that PAG response to palatable food is related to the motivational drive behind food consumption in the absence of hunger.
Highlights.
Periacqueductal gray response to milkshake is correlated with subsequent milkshake intake.
This relationship is not influenced by ratings of hunger, BMI, or eating style.
Insular response to milkshake is NOT correlated with subsequent milkshake intake.
Acknowledgments
This work was supported by NIH grant RO1K085579
Footnotes
Publisher's Disclaimer: This is a PDF file of an unedited manuscript that has been accepted for publication. As a service to our customers we are providing this early version of the manuscript. The manuscript will undergo copyediting, typesetting, and review of the resulting proof before it is published in its final citable form. Please note that during the production process errors may be discovered which could affect the content, and all legal disclaimers that apply to the journal pertain.
References
- Abel EL. Effects of marihuana on solution of anagrams, memory and appetite. Nature. 1971;231:260–262. doi: 10.1038/231260b0. [DOI] [PubMed] [Google Scholar]
- Abizaid A, Gao Q, Horvath TL. Thoughts for food: brain mechanisms and peripheral energy balance. Neuron. 2006a;51:691–702. doi: 10.1016/j.neuron.2006.08.025. [DOI] [PubMed] [Google Scholar]
- Abizaid A, Liu ZW, Andrews ZB, Shanabrough M, Borok E, Elsworth JD, Roth RH, Sleeman MW, Picciotto MR, Tschöp MH, Gao XB, Horvath TL. Ghrelin modulates the activity and synaptic input organization of midbrain dopamine neurons while promoting appetite. The Journal of Clinical Investigation. 2006b;116(12):3229–3239. doi: 10.1172/JCI29867. [DOI] [PMC free article] [PubMed] [Google Scholar]
- Batterham RL, Ffytche DH, Rosenthal JM, Zelaya FO, Barker GJ, Withers DJ, Williams SCR. PYY modulation of cortical and hypothalamic brain areas predicts feeding behavior in humans. Nature. 2007;450:106–109. doi: 10.1038/nature06212. [DOI] [PubMed] [Google Scholar]
- Batterink L, Yokum S, Stice E. Body mass correlates inversely with inhibitory control in response to food among adolescent girls: An fMRI study. NeuroImage. 2010;52(4):1696–1703. doi: 10.1016/j.neuroimage.2010.05.059. [DOI] [PMC free article] [PubMed] [Google Scholar]
- Beaver JD, Lawrence AD, vanDitzhuijzen J, Davis MH, Woods A, Calder AJ. Individual differences in reward drive predict neural responses to images of food. The Journal of Neuroscience. 2006;26(19):5160–5166. doi: 10.1523/JNEUROSCI.0350-06.2006. [DOI] [PMC free article] [PubMed] [Google Scholar]
- Berthoud HR. Multiple neural systems controlling food intake and body weight. Neuroscience & Biobehavioral Reviews. 2002;26(4):393–428. doi: 10.1016/s0149-7634(02)00014-3. [DOI] [PubMed] [Google Scholar]
- Cornier MA, VonKaenel SS, Bessesen DH, Tregellas JR. Effects of overfeeding on the neuronal responses to visual food cues. American Journal of Clinical Nutrition. 2007;86(4):965–971. doi: 10.1093/ajcn/86.4.965. [DOI] [PubMed] [Google Scholar]
- Cornier MA, Melanson EL, Salzberg AK, Bechtell JL, Tregellas JR. The effects of exercise on the neuronal responses to food cues. Physiology & Behavior. 2012;105(4):1028–1034. doi: 10.1016/j.physbeh.2011.11.023. [DOI] [PMC free article] [PubMed] [Google Scholar]
- Davis CA, Levitan RD, Reid C, Carter JC, Kaplan AS, Patte KA, King N, Curtis C, Kennedy JL. Dopamine for “wanting” and opiods for “liking”: a comparison of obese adults with and without binge eating. Obesity. 2009;17(6):1220–1225. doi: 10.1038/oby.2009.52. [DOI] [PubMed] [Google Scholar]
- Demos KE, Kelley WM, Heatherton TF. Dietary restraint violations influence reward responses in nucleus accumbens and amygdala. Journal of Cognitive Neuroscience. 2011;23(8):1952–1963. doi: 10.1162/jocn.2010.21568. [DOI] [PMC free article] [PubMed] [Google Scholar]
- Del Parigi A, Chen K, Salbe AD, Hill JO, Wing RR, Reiman M, Tataranni PA. Persistence of abnormal neural responses to a meal in postobese individuals. International Journal of Obesity. 2004;28(3):370–377. doi: 10.1038/sj.ijo.0802558. [DOI] [PubMed] [Google Scholar]
- DelParigi A, Chen K, Salbe AD, Reiman EM, Tataranni PA. Are we addicted to food? Obesity. 2003;11:493–495. doi: 10.1038/oby.2003.68. [DOI] [PubMed] [Google Scholar]
- Dodds CM, O’Neil B, Beaver J, Makwana A, Bani M, Merlo-Pich E, Fletcher PC, Koch A, Bullmore ET, Nathan PJ. Effect of the dopamine D2 receptor antagonist GSK5988909 on brain responses to rewarding food images in overweight and obese binge eaters. Appetite. 2012;59(1):27–33. doi: 10.1016/j.appet.2012.03.007. [DOI] [PubMed] [Google Scholar]
- Flores JA, Galan-Rodriguez B, Ramiro-Fuentes S, Fernandez-Espejo E. Role for dopamine neurons of the rostral linear nucleus and periaqueductal gray in the rewarding and sensitizing properties of heroin. Neuropsychopharmacology. 2006;31(7):1475–1488. doi: 10.1038/sj.npp.1300946. [DOI] [PubMed] [Google Scholar]
- Führer D, Zysset S, Stumvoll M. Brain activity in hunger and satiety: an exploratory visually stimulated fMRI study. Obesity. 2008;16(5):945–950. doi: 10.1038/oby.2008.33. [DOI] [PubMed] [Google Scholar]
- Frank S, Laharnar N, Kullmann S, Veit R, Canova C, Hegner YL, Fritsche A, Preissl H. Processing of food pictures: Influence of hunger, gender and calorie content. Brain Research. 2010;1350:159–166. doi: 10.1016/j.brainres.2010.04.030. [DOI] [PubMed] [Google Scholar]
- Frank S, Heni M, Moss A, von Schnurbein J, Fritsche A, Haring HU, Farooqi S, Preissl H, Wabitsch M. Leptin therapy in a congenital leptin-deficient patient leads to acute and long-term changes in homeostatic, reward, and food-related brain areas. Journal of Clinical Endocrinology and Metabolism. 2011;96(8):E1283–E1287. doi: 10.1210/jc.2010-2713. [DOI] [PubMed] [Google Scholar]
- Goldstone AP, Prechtl de Hernandez CG, Beaver JD, Muhammed K, Croese C, Bell G, Durighel G, Hughes E, Waldman AD, Frost G, Bell JD. Fasting biases brain reward systems towards high-calorie foods. European Journal of Neuroscience. 2009;30(8):1625–1635. doi: 10.1111/j.1460-9568.2009.06949.x. [DOI] [PubMed] [Google Scholar]
- Green BG, Dalton P, Cowart B, Shaffer G, Rankin K, Higgins J. Evaluating the ‘Labeled Magnitude Scale’ for measuring sensations of taste and smell. Chemical Senses. 1996;21(3):323–334. doi: 10.1093/chemse/21.3.323. [DOI] [PubMed] [Google Scholar]
- Grey J, Terry P, Higgs S. Contrasting effects of different cannabinoid receptor ligands on mouse ingestive behavior. Behavioral Pharmacology. 2012;23(5–6):551–559. doi: 10.1097/FBP.0b013e328356c3dc. [DOI] [PubMed] [Google Scholar]
- Gutstein HB, Mansour A, Watson SJ, Akil H, Fields HL. Mu and kappa opioid receptors in periaqueductal gray and rostral ventromedial medulla. Neuroreport. 1998;9(8):1777–1781. doi: 10.1097/00001756-199806010-00019. [DOI] [PubMed] [Google Scholar]
- Hare TA, O’Doherty J, Camerer CF, Schultz W, Rangel A. Dissociating the role of the orbitofrontal cortex and the striatum in the computation of goal values and prediction errors. The Journal of Neuroscience. 2008;28:5623–5630. doi: 10.1523/JNEUROSCI.1309-08.2008. [DOI] [PMC free article] [PubMed] [Google Scholar]
- Hare TA, Camerer CF, Rangel A. Self-control in decision-making involves modulation of the vmPFC valuation system. Science. 2009;324(5927):646–648. doi: 10.1126/science.1168450. [DOI] [PubMed] [Google Scholar]
- Hare TA, Malmaud J, Rangel A. Focusing attention on the health aspects of foods changes value signals in vmPFC and improves dietary choices. The Journal of Neuroscience. 2011;31(30):11077–11087. doi: 10.1523/JNEUROSCI.6383-10.2011. [DOI] [PMC free article] [PubMed] [Google Scholar]
- Hasue RH, Shammah-Lagnado SJ. Origin of the dopaminergic innervation of the central extended amygdala and accumbens shell: a combined retrograde tracing and immunohistochemical study in the rat. Journal of Comparative Neurology. 2002;454:15–33. doi: 10.1002/cne.10420. [DOI] [PubMed] [Google Scholar]
- Higgs S, Williams CM, Kirkham TC. Cannabinoid influences on palatability: microstructural analysis of sucrose drinking after [DELTA]9-THC, anandamide, 2-AG and SR141716. Psychopharmacology. 2003;165:370–377. doi: 10.1007/s00213-002-1263-3. [DOI] [PubMed] [Google Scholar]
- Hokfelt T, Martensoon R, Bjorklund A, Kleinau S, Goldstein M. Distributional maps of tyrosine-hydroxylase-immuno-reactive neurons in the brain. In: Bjiorklund A, Hokfelt T, editors. Classical Transmitters in the CNS. Vol. 2. Elsevier; Amsterdam: 1984. pp. 277–379. Series Handbook of Chemical Neuroanatomy. [Google Scholar]
- Hollmann M, Hellrung B, Schlogl H, Kabisch S, Stumvoll M, Villringer A, Horstmann A. Neural correlates of the volitional regulation of the desire for food. International Journal of Obesity. 2012;36:648–655. doi: 10.1038/ijo.2011.125. [DOI] [PubMed] [Google Scholar]
- Hommel JD, Trinko R, Sears RM, Georgescu D, Liu ZW, Gao XB, Thummon JJ, Marinelli M, DiLeone RJ. Leptin receptor signaling in midbrain dopamine neurons regulates feeding. Neuron. 2006;51(6):801–810. doi: 10.1016/j.neuron.2006.08.023. [DOI] [PubMed] [Google Scholar]
- Kelley AE, Bakshi VP, Haber SN, Steininger TL, Will MJ, Zhang M. Opioid modulation of taste hedonics within the ventral striatum. Physiology & Behavior. 2002;76(3):365–377. doi: 10.1016/s0031-9384(02)00751-5. [DOI] [PubMed] [Google Scholar]
- Kenney PJ. Reward mechanisms in obesity: new insights and future directions. Neuron. 2011;69(4):664–679. doi: 10.1016/j.neuron.2011.02.016. [DOI] [PMC free article] [PubMed] [Google Scholar]
- Kringelbach ML, O’Doherty J, Rolls ET. Activation of the human orbitofrontal cortex to a liquid food stimulus is correlated with its subjective pleasantness. Cerebral Cortex. 2003;13(10):1064–1071. doi: 10.1093/cercor/13.10.1064. [DOI] [PubMed] [Google Scholar]
- Koch JE. [DELTA]9-THC stimulates food intake in Lewis rats: effects on chow, high-fat and sweet high-fat diets. Nutritional Neuroscience. 2001;4:179–187. doi: 10.1016/s0091-3057(01)00467-1. [DOI] [PubMed] [Google Scholar]
- La Bar KS, Gitelman DR, Parrish TB, Kim YH, Nobre AC, Mesulam MM. Hunger selectively modulates corticolimbic activation to food stimuli in humans. Behavioral Neuroscience. 2001;115(2):493–500. doi: 10.1037/0735-7044.115.2.493. [DOI] [PubMed] [Google Scholar]
- Lim J, Wood A, Green BG. Derivation and evaluation of a labeled hedonic scale. Chemical Senses. 2009;34(9):739–751. doi: 10.1093/chemse/bjp054. [DOI] [PMC free article] [PubMed] [Google Scholar]
- Lowe MR, Butryn ML, Didie ER, Annunziato RA, Thomas JR, Crerand CE, Ochner CN, Coletta MC, Bellace D, Wallaert M, Halford J. The Power of Food Scale. A new measure of the psychological influence of the food environment. Appetite. 2009a;53(1):114–118. doi: 10.1016/j.appet.2009.05.016. [DOI] [PubMed] [Google Scholar]
- Lowe MR, Van Steenburgh J, Ochner C, Coletta M. Neural correlates of individual differences related to appetite. Physiology and Behavior. 2009b;97(5):561–571. doi: 10.1016/j.physbeh.2009.04.001. [DOI] [PubMed] [Google Scholar]
- Macey PM, Macey KE, Kumar R, Harper RM. A method for removal of global effects from fMRI time series. Neuroimage. 2004;22(1):360–366. doi: 10.1016/j.neuroimage.2003.12.042. [DOI] [PubMed] [Google Scholar]
- Mai JK, Assheuer J, Paxinos G. Atlas of the Human Brain. Elsevier Academic Press; San Diego CA: 2004. [Google Scholar]
- Maldjian JA, Laurienti PJ, Kraft RA, Burdette JH. An automated method for neuroanatomic and cytoarchitectonic atlas-based interrogation of fMRI data sets. Neuroimage. 2003;19(3):1233–1239. doi: 10.1016/s1053-8119(03)00169-1. [DOI] [PubMed] [Google Scholar]
- Malik S, McGlone F, Bedrossian D, Dagher A. Ghrelin modulates brain activity in areas that control appetitive behavior. Cell metabolism. 2008;7(5):400–409. doi: 10.1016/j.cmet.2008.03.007. [DOI] [PubMed] [Google Scholar]
- Mansour A, Fox CA, Akil H, Watson SJ. Opioid-receptor mRNA expression in the rat CNS: anatomical and functional implications. Trends in Neuroscience. 1995a;18(1):22–29. doi: 10.1016/0166-2236(95)93946-u. [DOI] [PubMed] [Google Scholar]
- Mansour A, Fox CA, Burke S, Akil H, Watson SJ. Immunohistochemical localization of the cloned mu opioid receptor in the rat CNS. Journal of Chemical Neuroanatomy. 1995b;8(4):283–305. doi: 10.1016/0891-0618(95)00055-c. [DOI] [PubMed] [Google Scholar]
- Miranda-Paiva CM, Ribeiro-Barbosa ER, Canteras NS, Felicio LF. A role for the periaqueductal grey in opiodergic inhibition of maternal behavior. European Journal of Neuroscience. 2003;18(3):667–674. doi: 10.1046/j.1460-9568.2003.02794.x. [DOI] [PubMed] [Google Scholar]
- Mota-Ortiz S, Sukikara MH, Felicio LF, Canteras NS. Afferent connections to the rostrolateral part of the periaqueductal gray: A critical region influencing the motivation drive to hunt and forage. Neural Plasticity. 2009 doi: 10.1155/2009/612698. [DOI] [PMC free article] [PubMed] [Google Scholar]
- Napadow V, Dhond R, Kennedy D, Hui KS, Makris N. Automated brainstem co-registration (ABC) for MRI. Neuroimage. 2006;32(3):1113–1119. doi: 10.1016/j.neuroimage.2006.05.050. [DOI] [PubMed] [Google Scholar]
- O’Doherty J, Rolls ET, Francis S, Bowtell R, McGlone F, Kobal G, Renner B, Ahne G. Sensory-specific satiety-related olfactory activation of the human orbitofrontal cortex. Neuroreport. 2000;11(4):893–897. doi: 10.1097/00001756-200003200-00046. [DOI] [PubMed] [Google Scholar]
- O’Doherty J, Buchanan TW, Seymour B, Dolan RJ. Predictive neural coding of reward preference involves dissociable response in human ventral midbrain and ventral striatum. 2006. [DOI] [PubMed] [Google Scholar]
- Oldfield RC. The assessment and analysis of handedness: the Edinburgh inventory. Neuropsychologia. 1971;9(1):97–113. doi: 10.1016/0028-3932(71)90067-4. [DOI] [PubMed] [Google Scholar]
- Pannacciulli N, Del Parigi A, Chen K, Le DSNT, Reiman EM, Tataranni PA. Brain abnormalities in human obesity : A voxel-based morphometric study. NeuroImage. 2006;31(4):1419–1425. doi: 10.1016/j.neuroimage.2006.01.047. [DOI] [PubMed] [Google Scholar]
- Peciña S, Smith KS, Berridge KC. Hedonic hot spots in the brain. The Neuroscientist. 2006;12(6):500–511. doi: 10.1177/1073858406293154. [DOI] [PubMed] [Google Scholar]
- Rabiner EA, Beaver J, Makwana A, Searle G, Long C, Nathan PJ, Newbould RD, Howard J, Miller SR, Bush MA, Reiley R, Passchier J, Gunn RN, Mathews PM, Bullmore ET. Pharmacological differentiation of opiod receptor antagonists by molecular and functional imaging of target occupancy and food reward-related brain activation in humans. Molecular Psychiatry. 2011;16:826–835. doi: 10.1038/mp.2011.29. [DOI] [PMC free article] [PubMed] [Google Scholar]
- Rothemund Y, Preuschhof C, Bohner G, Bauknecht HC, Klingebiel R, Flor H, Klapp BF. Differential activation of the dorsal striatum by high-calorie visual food stimuli in obese individuals. Neuroimage. 2007;37(2):410–421. doi: 10.1016/j.neuroimage.2007.05.008. [DOI] [PubMed] [Google Scholar]
- Shah YB, Prior MJW, Dixon AL, Morris PG, Marsden CA. Detection of cannabinoid agonist evoked increase in BOLD contrast in rats using functional magnetic resonance imaging. Neuropharmacology. 2004;46:379–387. doi: 10.1016/j.neuropharm.2003.09.023. [DOI] [PubMed] [Google Scholar]
- Schultz W. Predictive reward signal of dopamine neurons. Journal of Neurophysiology. 1998;80(1):1–27. doi: 10.1152/jn.1998.80.1.1. [DOI] [PubMed] [Google Scholar]
- Siep N, Roefs A, Roebroeck A, Havermans R, Bonte ML, Jansen A. Hunger is the best spice: An fMRI study of the effects of attention, hunger and calorie content on food reward processing in the amygdala and orbitofrontal cortex. Behavioural Brain Research. 2009;198(1):149–158. doi: 10.1016/j.bbr.2008.10.035. [DOI] [PubMed] [Google Scholar]
- Small DM, Zatorre RJ, Dagher A, Evans AC, Jones-Gotman M. Changes in brain activity related to eating chocolate: from pleasure to aversion. Brain. 2001;124(9):1720–1733. doi: 10.1093/brain/124.9.1720. [DOI] [PubMed] [Google Scholar]
- Small DM, Gregory MD, Mak YE, Gitelman D, Mesulam MM, Parrish T. Dissociation of neural representation of intensity and affective valuation in human gustation. Neuron. 2003;39(4):701–711. doi: 10.1016/s0896-6273(03)00467-7. [DOI] [PubMed] [Google Scholar]
- Small DM, Voss J, Mak YE, Simmons KB, Parrish T, Gitelman D. Experience dependent neural integration of taste and smell in the human brain. Journal of Neurophysiology. 2004;92(3):1892–1903. doi: 10.1152/jn.00050.2004. [DOI] [PubMed] [Google Scholar]
- Small DM. Individual differences in the neurophysiology of reward and the obesity epidemic. International Journal of Obesity. 2009;33:S44–S48. doi: 10.1038/ijo.2009.71. [DOI] [PMC free article] [PubMed] [Google Scholar]
- Stice E, Spoor S, Bohon C, Small DM. Relation between obesity and blunted striatal response to food is moderated by TaqlA A1 allele. Science. 2008a;332(5900):449–452. doi: 10.1126/science.1161550. [DOI] [PMC free article] [PubMed] [Google Scholar]
- Stice E, Spoor S, Bohon C, Veldhuizen MG, Small DM. Relation of reward from food intake and anticipated food intake to obesity: a functional magnetic resonance imaging study. Journal of Abnormal Psychology. 2008b;117(4):924–935. doi: 10.1037/a0013600. [DOI] [PMC free article] [PubMed] [Google Scholar]
- Stice E, Yokum S, Bohon C, Marti N, Smolen A. Reward circuitry responsivity to food predicts increases in body mass: moderating effects of DRD2 and DRD4. Neuroimage. 2010;50(4):1618–1625. doi: 10.1016/j.neuroimage.2010.01.081. [DOI] [PMC free article] [PubMed] [Google Scholar]
- Stice E, Yokum S, Burger KS, Epstein LH, Small DM. Youth at risk for obesity show greater activation of striatal and somatosensory regions to food. The Journal of Neuroscience. 2011;31(12):4360–4366. doi: 10.1523/JNEUROSCI.6604-10.2011. [DOI] [PMC free article] [PubMed] [Google Scholar]
- Stoeckel LE, Weller RE, Cook EW, III, Twieg DB, Knowlton RC, Cox JE. Widespread reward-sytem activation in obese women in response to pictures of high calorie foods. NeuroImage. 2008;41(2):636–647. doi: 10.1016/j.neuroimage.2008.02.031. [DOI] [PubMed] [Google Scholar]
- Stunkard AJ, Messick S. The three-factor eating questionnaire to measure dietary restraint, disinhibition and hunger. Journal of Psychosomatic Research. 1985;29(1):71–83. doi: 10.1016/0022-3999(85)90010-8. [DOI] [PubMed] [Google Scholar]
- Tataranni PA, Gautier JF, Chen K, Ueker A, Bandy D, Salbe AD, Pratley RE, Lawson M, Reinman EM, Ravussin E. Neuroanatomical correlates of hunger and satiation in humans using positron emission tomography. Proceedings of the National Academy of Sciences. 1999;96(8):4569–4574. doi: 10.1073/pnas.96.8.4569. [DOI] [PMC free article] [PubMed] [Google Scholar]
- Veldhuizen MG, Bender G, Constable RT, Small DM. Trying to detect taste in a tasteless solution: modulation of early gustatory cortex by attention to taste. Chemical Senses. 2007;32(6):569–581. doi: 10.1093/chemse/bjm025. [DOI] [PubMed] [Google Scholar]
- Volkow ND, Wise RA. How can drug addiction help us understand obesity? Nature Neuroscience. 2005;8:555–560. doi: 10.1038/nn1452. [DOI] [PubMed] [Google Scholar]
- Volkow ND, Wang GJ, Telang F, Fowler JS, Goldstein RZ, Alia-Klein N, Logan J, Wong C, Thanos PK, Ma Y, Pradhan K. Inverse association between BMI and prefrontal metabolic activity in healthy adults. Obesity. 2009;17(1):60–65. doi: 10.1038/oby.2008.469. [DOI] [PMC free article] [PubMed] [Google Scholar]
- Wassum KM, Ostlund SB, Maidment NT, Balleine BW. Distinct opioid circuits determine the palatability and the desirability of rewarding events. Proceedings of the National Academy of Sciences. 2009;106(30):12512–12517. doi: 10.1073/pnas.0905874106. [DOI] [PMC free article] [PubMed] [Google Scholar]
- Williams CM, Rogers PJ, Kirkham TC. Hyperphagia in pre-fed rats following oral [DELTA]9-THC. Physiology and Behavior. 1998;65:343–346. doi: 10.1016/s0031-9384(98)00170-x. [DOI] [PubMed] [Google Scholar]
- Wang GJ, Volkow ND, Telang F, Jayne M, May Y, Zhu W, Wong CT, Thanos PK, Geliebter A, Biegon A, Fowler JS. Evidence of gender differences in the ability to inhibit brain activation elicited by food stimulation. Proceedings of the National Academy of Sciences. 2009;106(4):1249–1254. doi: 10.1073/pnas.0807423106. [DOI] [PMC free article] [PubMed] [Google Scholar]
- Woolley JD, Gorno-Tempini ML, Seeley WW, Rankin K, Lee SS, Matthews BR, Miller BL. Binge eating is associated with right orbitofrontal-insular-striatal atrophy in frontotemporal dementia. Neurology. 2007;69(14):1424–1433. doi: 10.1212/01.wnl.0000277461.06713.23. [DOI] [PubMed] [Google Scholar]
- Wise RA. Dopamine, learning and motivation. Nature Reviews Neuroscience. 2004;5:483–484. doi: 10.1038/nrn1406. [DOI] [PubMed] [Google Scholar]
- Yeomans MR, Gray RW. Selective effects of naltrexone on food pleasantness and intake. Physiology & Behavior. 1996;60(2):439–446. doi: 10.1016/s0031-9384(96)80017-5. [DOI] [PubMed] [Google Scholar]
- Yeomans MR, Gray RW. Opiod peptides and the control of human ingestive behavior. Neuroscience Biobehavioral Reviews. 2002;26:713–728. doi: 10.1016/s0149-7634(02)00041-6. [DOI] [PubMed] [Google Scholar]
- Zheng H, Lenard NR, Shin AC, Berthoud HR. Appetite control and energy balance regulation in the modern world: reward-driven brain overrides repletion signals. International Journal of Obesity. 2009;33:S8–S13. doi: 10.1038/ijo.2009.65. [DOI] [PMC free article] [PubMed] [Google Scholar]