Abstract
Despite the recent attention focused on the roles of the nucleotide binding and oligomerization domain-like receptor family pyrin domain-containing 3 (NLRP3) inflammasome in the pathogenesis of type 2 diabetes, little is known about the ex vivo profile of inflammasome activation in type 2 diabetic patients. In this study, we investigated patterns of NLRP3 inflammasome activation in monocyte-derived macrophages (MDMs) from drug-naïve patients with newly diagnosed type 2 diabetes. Type 2 diabetic subjects had significantly increased mRNA and protein expression of NLRP3, apoptosis-associated speck-like protein containing a CARD (ASC), and proinflammatory cytokines in MDMs cultured with autologous sera compared with healthy controls. Upregulated interleukin (IL)-1β maturation, IL-18 secretion, and caspase-1 cleavage were observed in MDMs from type 2 diabetic patients after stimulation with various danger molecules (ATP, high-mobility group protein B1, free fatty acids, islet amyloid polypeptide, and monosodium uric acid crystals). Mitochondrial reactive oxygen species and NLRP3 were required for IL-1β synthesis in MDMs. Finally, 2 months of therapy with the antidiabetic drug metformin significantly inhibited the maturation of IL-1β in MDMs from patients with type 2 diabetes through AMP-activated protein kinase (AMPK) activation. Taken together, these data suggest that NLRP3 inflammasome activation is elevated in myeloid cells from type 2 diabetic patients and that antidiabetic treatment with metformin contributes to modulation of inflammasome activation in type 2 diabetes.
The prevalence of type 2 diabetes has increased worldwide, and it has become a global health burden because of its drastic cardiovascular complications (1,2). Thus, it is important to investigate the mechanisms underlying the pathogenesis of type 2 diabetes. There is considerable evidence that chronic low-grade inflammation caused by activation of the innate immune system plays an essential role in the pathogenesis of type 2 diabetes and its major complications (3). Key mechanisms of hyperglycemia-induced inflammation include nuclear factor-κB–dependent production of proinflammatory cytokines, Toll-like receptor (TLR) expression, increased oxidative stress, and inflammasome activation (4,5). Innate immune cells, such as macrophages, can induce inflammatory responses through detection of a variety of pathogen- or damage-associated molecular patterns using innate sensors, i.e., membrane-bound TLRs or cytosolic Nod-like receptors (NLRs) (6). Emerging evidence suggests that activation of the nucleotide binding and oligomerization domain-like receptor family pyrin domain-containing 3 (NLRP3) inflammasome leads to the maturation and secretion of interleukin (IL)-1β and is involved in the pathogenic mechanisms of obesity-induced inflammation, insulin resistance, and type 2 diabetes development (7–11). Whereas the importance of IL-1β in insulin resistance has been studied in animal models and human adipose tissues (12–15), the expression profiling of inflammasome activation in myeloid cells from type 2 diabetic patients has remained largely unexplored.
The NLRP3 inflammasome is the best-characterized inflammasome to date and acts as a molecular platform for IL-1β and IL-18 secretion (16). It contains the adaptor molecule apoptosis-associated speck-like protein containing a CARD (ASC) and procaspase-1 (16,17). Because the NLRP3 inflammasome plays a pivotal role in the production of IL-1β in response to various danger molecular patterns, it is considered a rational and effective target for modulating the initiation and progression of various autoinflammatory and autoimmune disorders. Recent data also suggest that reactive oxygen species (ROS) derived from dysfunctional mitochondria are required for NLRP3 inflammasome activation, and so ROS exert an indirect effect on cellular metabolic pathways, including glycolysis (18). Moreover, there is growing evidence of close connections between inflammation, mitochondrial function, and insulin resistance in type 2 diabetes (19). Although the relationship between mitochondrial function and inflammation has been extensively characterized in skeletal muscle (19), it has not been characterized in myeloid cells from patients with type 2 diabetes.
Metformin is widely used to improve glycemic control in type 2 diabetic patients through inhibition of hepatic glucose production, gluconeogenesis, and insulin resistance (20). However, the precise roles of metformin in controlling type 2 diabetes have not been fully elucidated. In this study, we show that monocyte-derived macrophages (MDMs) from type 2 diabetic patients exhibit markedly increased mRNA and protein expression of NLRP3, IL-1β, and IL-18 compared with MDMs from healthy control subjects. The cleavage of caspase-1 and release of mature IL-1β were significantly elevated in diabetic patients being treated with various “danger signal” molecules, including ATP, high-mobility group protein B1 (HMGB1), free fatty acids (FFAs), islet amyloid polypeptide (IAPP), and monosodium uric acid crystals (MSU). The diabetic subjects also had higher mitochondrial ROS production in monocyte populations. Some patients were followed-up after metformin treatment. Interestingly, after treatment with metformin for 2 months, patients showed significant inhibition of the synthesis and secretion of IL-1β and IL-18 in MDMs.
RESEARCH DESIGN AND METHODS
Patients.
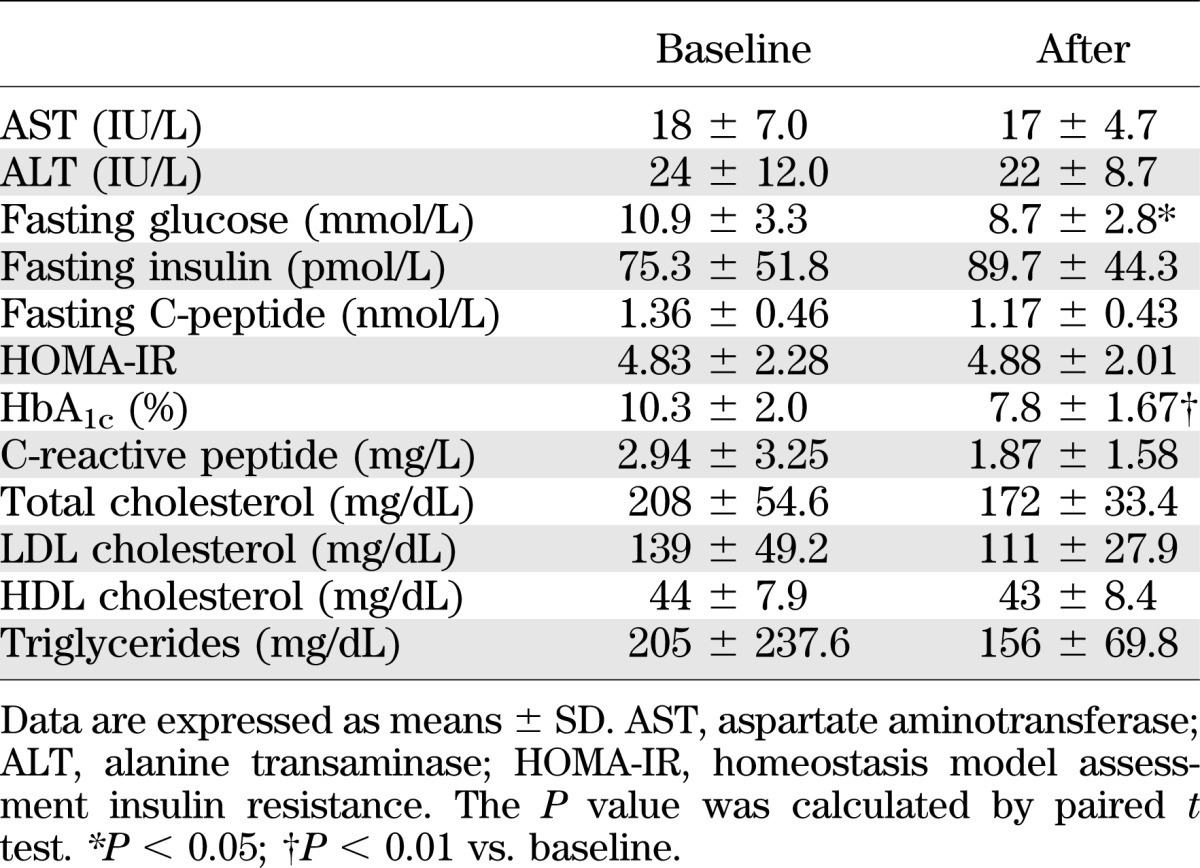
A total of 47 drug-naïve patients with newly diagnosed type 2 diabetes (male/female, 31/16; age, 51.9 ± 11.8 years; HbA1c, 8.5% ± 2.3%) and 57 healthy controls (male/female, 39/18; age, 52.0 ± 8.3 years; HbA1c, 5.0% ± 0.3%) were enrolled (Table 1). Type 2 diabetes was diagnosed according to the American Diabetes Association diagnostic criteria (American Diabetes Association 2012). Patients who used medication, such as angiotensin II receptor blockers or statins, were excluded. The diabetic patients had elevated levels of fasting plasma glucose and HbA1c compared with healthy controls. According to the WHO Asia-Pacific classification for obesity (BMI ≥ 25 kg/m2, Western Pacific Region WHO criteria on obesity) (21), patients with type 2 diabetes in the current study were obese (BMI = 25.3) (Table 1). Of the 47 diabetic patients, 11 were treated with metformin (500–1,000 mg/day) for 8 weeks and enrolled for additional experiments (male/female, 10/1; age, 45.6 ± 10.1 years; HbA1c 10.3 ± 2.0) (Table 2). The patients who were followed-up did not use any antidiabetic drugs other than metformin. The protocol for this research was approved by the Institutional Review Board of Chungnam National University Hospital and all of the participants provided written informed consent. The experimental protocol was performed in accordance with the Declaration of Helsinki.
TABLE 1.
Clinical and laboratory characteristics of the study subjects
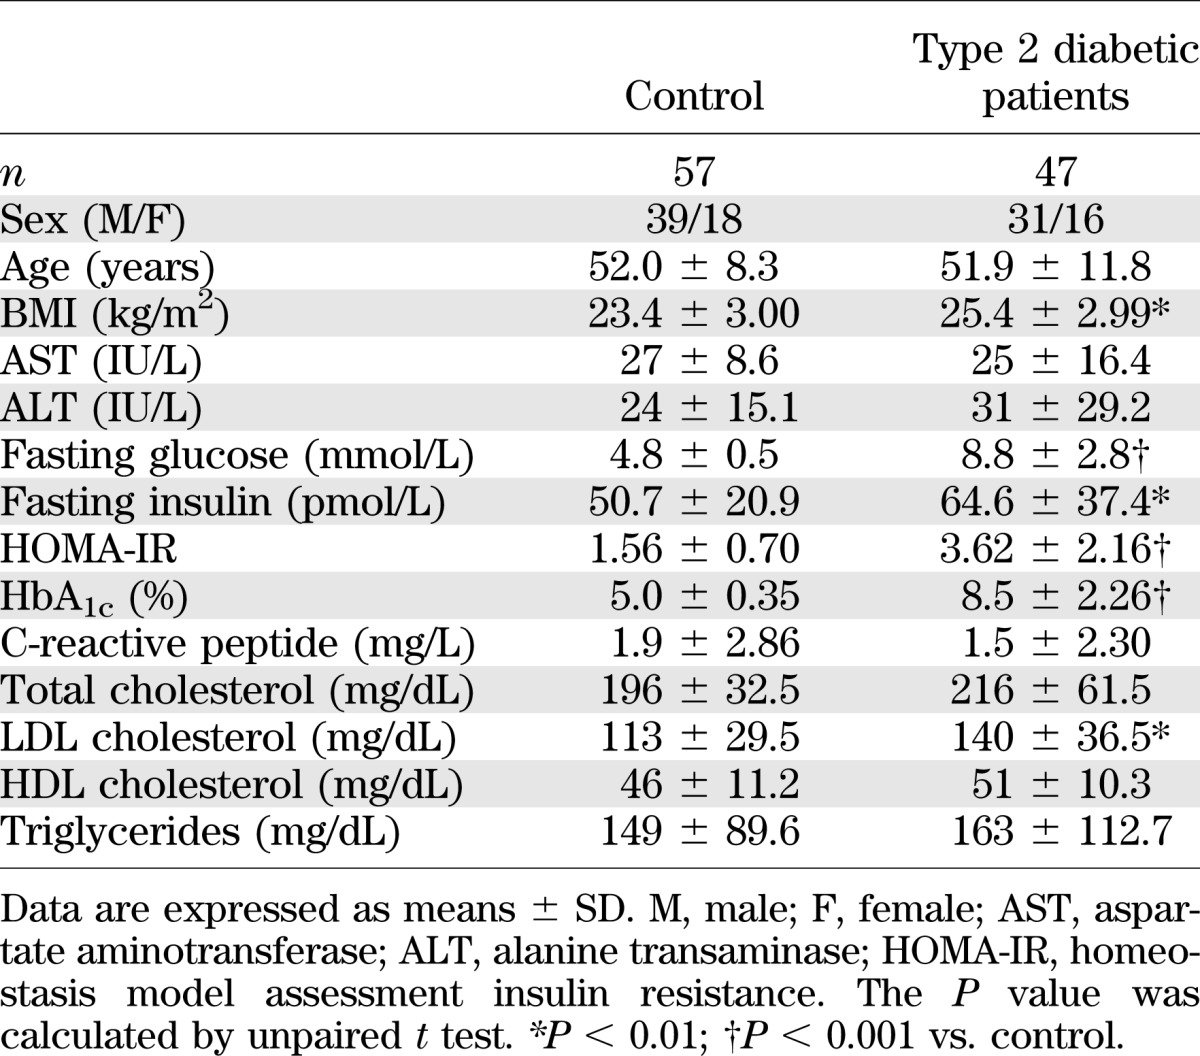
TABLE 2.
The change of laboratory data from baseline by 8 weeks of metformin treatment (n = 11)
Laboratory tests.
Blood chemistry and lipid profiles were measured using a blood chemistry analyzer (Hitachi 747; Hitachi, Tokyo, Japan). HbA1c was measured by high-performance liquid chromatography (Bio-Rad, Hercules, CA). Insulin and C-peptide were measured by radioimmunoassay (Roche, Penzberg, Germany). Homeostasis model assessment insulin resistance was calculated using the equation homeostasis model assessment insulin resistance = [fasting insulin (μU/mL) × fasting glucose (mmol/L)]/22.5.
Chemicals, antibodies, and DNA.
Lipopolysaccharide (LPS; Escherichia coli serotype 055:B5) and Pam3CSK4 were from InvivoGen (San Diego, CA). ATP disodium salt, DMSO (added to the cultures at 0.1% [volume/volume] as a solvent control), human IAPP, sodium palmitate, fatty acid-free bovine serum albumin (A8806), and metformin were from Sigma-Aldrich (St. Louis, MO). For the experiments, FFAs were prepared by conjugation of sodium palmitate to bovine serum albumin, as described previously (10). The MSU crystals were washed twice with 100% ethanol, dried, resuspended in sterile PBS, and briefly sonicated (5,7). HMGB1 was from R&D Systems (Minneapolis, MN). The following inhibitors and chemicals were obtained from the sources shown: z-yVAD-fmk (Tocris Bioscience, Ellisville, MO), Mito-TEMPO (Enzo Life Sciences, Farmingdale, NY), protease inhibitor cocktails (1.5 μg/mL chymotrypsin, 0.8 μg/mL thermolysin, 1 mg/mL papain, 1.5 μg/mL pronase, 1.5 μg/mL pancreatic extract, and 2 ng/mL trypsin; Roche), and compound C (Calbiochem, San Diego, CA). For Western blotting analysis, human IL-1β (sc-7884), caspase-1 (sc-622, sc-514), NLRP3 (sc-34411), ASC (sc-22514), and β-actin (sc-1616) antibodies (Abs) were from Santa Cruz Biotechnology (Santa Cruz, CA). Human IL-1β (2021) and p-AMPKα (2535) Abs were from Cell Signaling Technology (Danvers, MA).
Isolation and culture of peripheral blood mononuclear cells and MDMs.
Peripheral blood mononuclear cells (PBMCs) were freshly isolated from heparinized venous blood using Ficoll-Hypaque (Lymphoprep; Axis-Shield, Oslo, Norway) as described previously (22). Adherent CD14+ monocyte subpopulations were collected from PBMCs as described previously (22). Human MDMs were prepared by culturing peripheral blood monocytes for 5 days in the presence of 2 ng/mL human macrophage colony-stimulating factor (Sigma, St. Louis, MO), as described previously (22). Human PBMCs and MDMs were cultured in complete PRMI 1640 medium (Gibco-BRL, Grand Island, NY) with 10% pooled autologous human sera in which the complement components had been heat-inactivated.
RT-PCR analysis.
RNA was extracted from MDMs using TRIzol reagent (Invitrogen, Carlsbad, CA), as described previously (22). Total RNA was used for cDNA synthesis using an iScript cDNA Synthesis Kit (Bio-Rad). PCR was performed with a Veriti Thermal Cycler (Applied Biosystems, Foster City, CA) for 35 cycles with 45-s annealing steps at various temperatures, as follows: 58°C for Il1β, Nlrp3, Asc, and βactin; and 60°C for Tnfα, Il6, Il8, and Ccl2. The primer sequences are shown in Supplementary Table 1. Optical band data were analyzed semiquantitatively using an iCycler IQ Optical System (version 3.0a; Bio-Rad). Quantitative real-time RT-PCR was performed using power SYBR green PCR master mix (Applied Biosystems) on a real-time PCR system (Applied Biosystems, Naerum, Denmark), as described previously (22).
Western blotting, enzyme-linked immunosorbent assay, and flow cytometric analysis.
Western blot analysis was performed using whole-cell lysates and cell supernatants, as described previously (22). To detect IL-1β and IL-18 production, enzyme-linked immunosorbent assays (ELISAs) were performed for IL-1β (BD Pharmingen, San Diego, CA) and IL-18 (MBL International, Woburn, MA), according to the respective manufacturer’s instructions. Mitochondrial ROS levels in PBMCs were measured by staining with MitoSOX (Invitrogen) at a concentration of 5 μmol/L for 30 min at 37°C. CD14+ monocyte subpopulations were gated using a FACSCanto II flow cytometer (BD Biosciences, San Jose, CA), as described previously (18).
Human lentiviral shRNA generation and transduction to primary cells.
To silence human NLRP3 and ASC in primary MDMs, pLKO.1-based lentiviral hNLRP3 shRNA constructs (RHS4533; clone ID, TRCN0000062723 to TRCN0000062727; NM_001079821) and hASC shRNA constructs (RHS4533; clone ID, TRCN0000059073 to TRCN0000059077; NM_013258) were obtained as glycerol stocks from Open Biosystems (Huntsville, AL). The production of lentiviruses and infection of MDMs with lentiviral vectors were performed as described previously (23).
Statistical analysis.
The results are expressed as means ± SEM or means ± SD (Tables 1 and 2). Differences between the two groups were analyzed by Mann-Whitney U test and Student paired or unpaired t tests. Spearman correlation was used to assess associations between variables. Statistical significance is indicated as P < 0.05, P < 0.01, and P < 0.001. All statistical analyses were performed using GraphPad Prism Software (version 5.0; GraphPad, San Diego, CA).
RESULTS
Increased expression of NLRP3, ASC, and proinflammatory cytokines in MDMs from patients with type 2 diabetes.
The ex vivo studies indicated that the expression levels of TLRs and their signaling were upregulated in terms of inflammatory cytokine production in monocytes from type 2 diabetic patients (24). However, the expressions of pro–IL-1β, NLRP3, and ASC have not been characterized in myeloid cells from patients with type 2 diabetes. Therefore, we examined the mRNA expression of Nlrp3, Asc, and proinflammatory cytokines in drug-naïve patients with newly diagnosed type 2 diabetes. To minimize the influence of drugs that have been reported to alter cytokine production, patients who had used statins, anti-inflammatory drugs, or antidiabetic drugs were excluded.
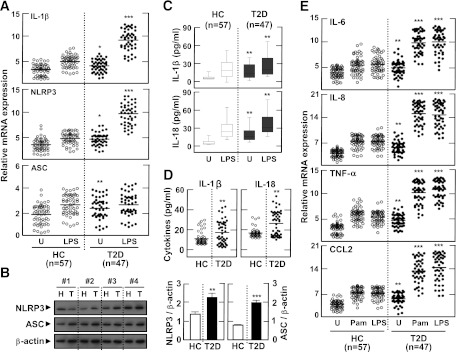
We first assessed Il1β, Nlrp3, and Asc mRNA expression in MDMs from the 47 diabetic patients and 57 nondiabetic, healthy controls after stimulation with LPS (a TLR4 ligand). There were no significant differences in the numbers of PBMCs or CD4+, CD8+, CD14+, or CD56+ cells between patients and healthy controls (data not shown). After LPS stimulation, Il1β and Nlrp3 mRNA expression in MDMs was significantly increased in cells from patients with type 2 diabetes compared with cells from controls. Basal levels of Il1β, Nlrp3, and Asc mRNA expression were also significantly upregulated in patients (Fig. 1A). In addition, basal NLRP3 and ASC protein levels were elevated in MDMs from type 2 diabetic patients, compared with MDMs from controls (Fig. 1B; n = 10). Basal and LPS-induced production of IL-1β and IL-18 was significantly elevated in MDMs (Fig. 1C) and sera (Fig. 1D) from patients. Finally, when MDMs were stimulated with TLR2 (Pam3CSK4) and TLR4 agonists, the Il6, Il8, Tnfα, and Ccl2 mRNA levels were significantly upregulated in the MDMs from patients (Fig. 1E). These data suggest that in the initial phase of type 2 diabetes, patients show upregulation of inflammatory cytokine production and NLRP3 expression in their myeloid lineage cells compared with healthy controls.
FIG. 1.
Expression profiles of NLRP3, ASC, and inflammatory cytokines in MDMs and sera from patients with type 2 diabetes (T2D) and healthy controls (HCs). A, C–E: MDMs were obtained from 47 patients with T2D and 57 HCs. The MDMs were incubated with media containing autologous sera and stimulated with ultrapure LPS (A, C, and E; 10 ng/mL) and Pam3CSK4 (Pam, E; 10 ng/mL) for 4 h. B: MDMs were cultured from T2D patients (n = 10) and HCs (n = 10). The protein levels of NLRP3 and ASC were measured by Western blot analysis. The intensity of each band for each protein was quantified and normalized relative to the housekeeping gene β-actin (B, right). D: Sera collected from the peripheral blood of T2D patients (n = 47) and HCs (n = 57). The mRNA expression of Il1β, Nlrp3, and Asc (A) and Il6, Il8, Tnfα, and Ccl2 (E) was analyzed by quantitative real-time RT-PCR. IL-1β and IL-18 production in culture supernatants (C) and sera (D) were measured by ELISA. Serum cytokine levels were determined in samples pretreated with protease inhibitors (4% volume/volume). A and E: Results are expressed as the mean concentration of triplicate samples. Data are representative of two independent experiments. B–D: Data are expressed as means ± SEM. *P < 0.05, **P < 0.01, ***P < 0.001 vs. HCs. U, untreated.
Upregulated maturation of IL-1β and caspase-1 activation in MDMs and PBMCs from type 2 diabetic patients.
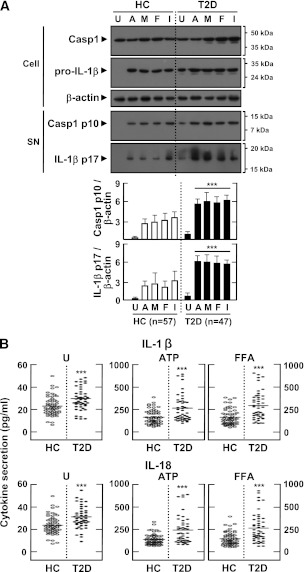
Various DAMP signals and heat shock proteins are significantly elevated in peripheral blood from type 2 diabetic patients (24). Because human monocytes exhibit constitutive caspase-1 cleavage and inflammasome activation (25), we assessed the activation of caspase-1 and IL-1β in MDMs. As shown in Fig. 2A, type 2 diabetic patients had significantly elevated levels of active p10 capase-1 fragment and mature IL-1β in LPS-primed MDMs before and after stimulation with different DAMP signals. We also found that IL-1β and IL-18 secretion levels, in the presence or absence of a variety of DAMP signals (ATP, MSU, FFAs, and IAPP), were markedly upregulated in the MDMs of type 2 diabetic patients compared with nondiabetic healthy controls (Fig. 2B and Supplementary Fig. 1A). Production of IL-1β and IL-18 was significantly reduced in MDMs by pretreatment with caspase-1 inhibitors, as determined by ELISA (Supplementary Fig. 1B). Production of neither tumor necrosis factor-α nor IL-8 was inhibited by caspase-1 inhibitors in either group (data not shown). Similar upregulations of IL-1β and IL-18 levels were observed in PBMCs from patients (Supplementary Fig. 1C).
FIG. 2.
Upregulated activation of casapse-1, IL-1β maturation, and production of IL-1β and IL-18 in MDMs from patients with type 2 diabetes (T2D) compared with healthy controls (HCs). MDMs were isolated from T2D patients (n = 47) and HCs (n = 57) were primed with LPS (10 ng/mL) for 4 h and stimulated with various ligands: ATP (1 mmol/L for 1 h), MSU (100 μg/mL for 6 h), FFAs (200 μmol/L for 16 h), and IAPP (10 μmol/L for 16 h). A: Western blotting analysis to determine caspase-1 (Casp1) and IL-1β protein levels (cell lysates [Cell], Casp1 p45, and pro-IL-1β [31 kDa]; supernatants [SN], cleaved Casp1 p10, and mature IL-1β [17 kDa]). The intensity of each band for each protein was quantified and normalized to the housekeeping gene β-actin (A, bottom). Data are expressed as means ± SEM. B: ELISA of IL-1β (top) and IL-18 (bottom) levels in culture supernatants. Cells were left untreated (U; left) or treated with the indicated ligands. Results are expressed as the mean of triplicate samples. Data are representative of two independent experiments. ***P < 0.001 vs. HCs. A, ATP; M, MSU; F, FFAs; I, IAPP.
Several clinical criteria (BMI, fasting glucose, fasting insulin, homeostasis model assessment insulin resistance, HbA1c, and LDL cholesterol) were significantly increased in type 2 diabetic patients compared with controls (Table 1). However, there was no significant correlation between IL-1β expression and BMI (P > 0.05) or age (P > 0.05) in type 2 diabetic patients. These results indicate that caspase-1 cleavage and IL-1β maturation are upregulated in the MDMs and PBMCs of type 2 diabetic patients.
Mitochondrial ROS and NLRP3 are required for IL-1β synthesis in MDMs and PBMCs from type 2 diabetic patients.
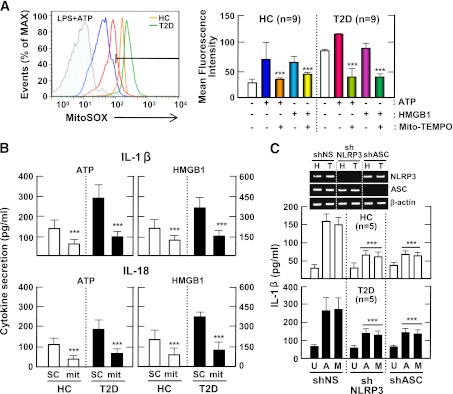
Several mechanisms have been suggested to explain the activation of the NLRP3 inflammasome. Recently, ROS derived from mitochondria have been implicated in NLRP3 inflammasome activation (18,26). In addition, mitochondrial ROS play essential roles in the progression of diabetes and its complications (27). We further investigated whether inflammasome stimuli can increase mitochondrial ROS generation in CD14+ cell fractions of PBMCs, and whether this was greater in type 2 diabetic patients than in healthy controls. Mitochondrial ROS generation in LPS-primed PBMCs stimulated with ATP or HMGB1 was higher in cells from type 2 diabetic patients than in cells from healthy controls (Fig. 3A).
FIG. 3.
Upregulated NLRP3 inflammasome activation in patients with type 2 diabetes (T2D) is mediated by mitochondrial ROS. A: PBMCs isolated from T2D patients (n = 9) and healthy controls (HCs; n = 9) were primed with LPS (10 ng/mL) for 4 h and then stimulated with ATP (1 mmol/L) or HMGB1 (10 ng/mL) for 1 h in the absence or presence of Mito-TEMPO (mit; 200 μmol/L). Then, the cells were stained with MitoSOX, gated for the CD14+ population, and analyzed by flow cytometry. Representative images (left) and quantitative analysis of mean fluorescence intensities (right) are shown (A, right). Data are expressed as means ± SEM. B: MDMs from T2D patients (n = 5) and HCs (n = 5) were primed with LPS (10 ng/mL, for 4 h), and then stimulated with ATP (1 mmol/L) or HMGB1 (10 ng/mL) for 1 h in the absence or presence of Mito-TEMPO (mit; 200 μmol/L). C: MDMs from T2D patients (n = 5) and HCs (n = 5) were transduced with nonspecific control shRNA lentiviral particles (shNS) or lentiviral shRNA specific for NLRP3 (shNLRP3) or ASC (shASC), primed with LPS, and stimulated with ATP (1 mmol/L for 1 h) or MSU (100 μg/mL for 6 h). ELISA analysis of IL-1β (B and C) and IL-18 (B). Data are expressed as means ± SEM. C: Representative images of gels run to assess transduction efficiency by semiquantitative RT-PCR analysis (top). ***P < 0.001 vs. HCs. U, untreated; A, ATP; M, MSU; SC, solvent control.
We further investigated whether mitochondrial ROS and NLRP3 are required for IL-1β secretion in MDMs. As shown in Fig. 3B, pretreatment with the mitochondria-targeting antioxidant Mito-TEMPO, which inhibits mitochondrial ROS production, significantly inhibited ATP-induced and HMGB1-induced IL-1β and IL-18 secretion in LPS-primed MDMs from both groups (n = 5). Moreover, we transduced MDMs with shRNA specific for hNLRP3 or hASC to silence the expression of NLRP3 in MDMs (Fig. 3C, inset). The shRNA-mediated knockdown of NLRP3 or ASC significantly attenuated IL-1β production in response to inflammasome stimuli in LPS-primed MDMs (Fig. 3C). These data suggest that the monocyte fractions of PBMCs from type 2 diabetic patients have elevated mitochondrial ROS levels.
Treatment of type 2 diabetes with metformin for 2 months significantly improves clinical findings, concurrent with decreases in caspase-1 cleavage and activation of IL-1β.
Next, we investigated whether metformin treatment would affect the responsiveness of PBMCs and MDMs to inflammasome stimuli. Eleven type 2 diabetic patients treated with the oral antidiabetic drug metformin (monotherapy, 500–1,000 mg) were followed-up for inflammasome activation profiles. The clinical characteristics of the patients are shown in Table 2. There was no significant difference between the values of BMI at baseline (BMI 25.5 ± 1.7) and after treatment (BMI 25.6 ± 1.9) among the follow-up patients. However, HbA1c and fasting glucose levels were significantly reduced in patients after 2 months of metformin therapy (P < 0.01, for HbA1c; P < 0.05, for fasting glucose).
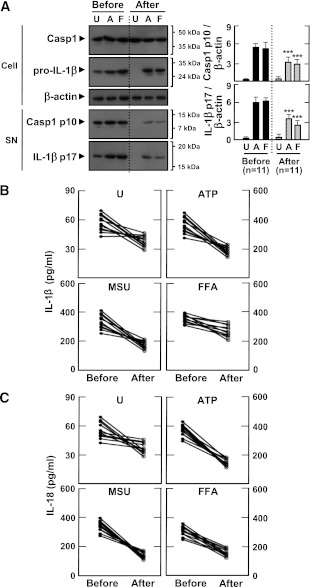
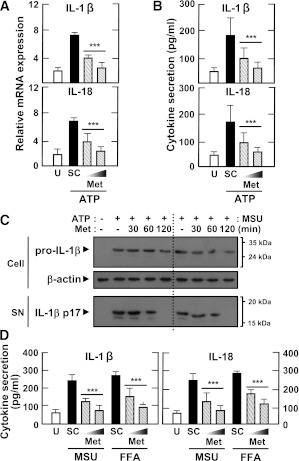
After 2 months of treatment, MDMs from patients showed significantly decreased levels of IL-1β maturation and caspase-1 cleavage before and after exposure to inflammasome stimuli (Fig. 4A; ATP and FFAs). In addition, IL-1β and IL-18 production after stimulation with ATP, MSU, and FFAs was significantly downregulated (Fig. 4B and C). Similar IL-1β and IL-18 downregulation after stimulation with LPS and ATP was observed in their PBMCs, reaching levels comparable with those of healthy controls (Supplementary Fig. 2). These data suggest that metformin therapy contributes to the regulation of inflammasome activation in MDMs and PBMCs from type 2 diabetic patients by modulating mitochondrial ROS generation.
FIG. 4.
Metformin treatment inhibits the secretion of mature IL-1β and caspase-1 activation in MDMs from patients with type 2 diabetes (T2D). MDMs were isolated from T2D patients (n = 11) before (Before) and after (After) treatment with metformin for 2 months. MDMs were primed with LPS (10 ng/mL) for 4 h, and then stimulated with various ligands: ATP (1 mmol/L for 1 h), MSU (100 μg/mL for 6 h), and FFAs (200 μmol/L for 16 h). A: Western blotting analysis to determine caspase-1 (Casp1) and IL-1β protein levels (cell lysates [Cell], Casp1 p45, and pro-IL-1β [31 kDa]; supernatants [SN], cleaved Casp1 p10, and mature IL-1β [17 kDa]) (A, right). The intensity of each band for each protein was quantified and normalized to the housekeeping gene β-actin. Data are expressed as means ± SEM. ***P < 0.001 vs. control cultures. ELISA analysis of IL-1β (B) and IL-18 (C) levels in supernatants from cultured MDMs. Results are expressed as the mean of triplicate samples. Data are representative of two independent experiments. U, untreated; A, ATP; M, MSU; F, FFAs.
The antidiabetic drug metformin inhibits IL-1β and IL-18 production through activation of the AMPK pathway.
Next, we investigated whether metformin treatment would affect the synthesis and secretion of IL-1β and IL-18 in MDMs, and we investigated the mechanisms by which metformin modulates inflammasome activation in MDMs. We first examined whether metformin treatment would inhibit ATP-induced IL-1β and IL-18 mRNA expression and protein synthesis in MDMs primed with LPS in the presence of a high glucose concentration (15 mmol/L). As shown in Fig. 5A and B, metformin dose-dependently inhibited IL-1β and IL-18 mRNA expression and protein synthesis in MDMs after LPS priming and stimulation with ATP. A similar metformin-mediated reduction in proinflammatory cytokines was observed in PBMCs (data not shown). We also examined the metformin-dependent modulation of IL-1β maturation in MDMs after treatment with LPS plus ATP. As shown in Fig. 5C, the increased IL-1β maturation induced by ATP or MSU stimulation in LPS-primed MDMs was attenuated by metformin treatment. Moreover, the MSU-mediated and FFA-mediated production of IL-1β and IL-18 in LPS-primed MDMs was significantly abrogated by metformin treatment (Fig. 5D).
FIG. 5.
The antidiabetic drug metformin inhibits IL-1β and IL-18 production induced by various inflammasome stimuli in LPS-primed MDMs. Primary MDMs from healthy controls (n = 5) were primed with LPS (10 ng/mL for 4 h) in the presence of a high glucose concentration (15 mmol/L). They were then treated with metformin (Met) at the indicated doses (A, B, and D; 200 and 500 μmol/L for 60 min) or for the indicated periods of time (C; 200 μmol/L for 30, 60, or 120 min), and stimulated with ATP (A–C; 1 mmol/L for 1 h), MSU (C and D; 100 μg/mL for 6 h), or FFAs (D; 200 μmol/L for 16 h). A: Quantitative real-time RT-PCR analysis of Il1β and IL8 mRNA levels. B and D: ELISA analysis of IL-1β and IL-18. C: Western blotting analysis of IL-1β protein levels in cell lysates (Cell, pro-IL-1β [31 kDa]) and supernatants (SN; mature IL-1β [17 kDa]). A, B, and D: Data are expressed as means ± SEM of five independent experiments. ***P < 0.001 vs. solvent control (SC). U, untreated.
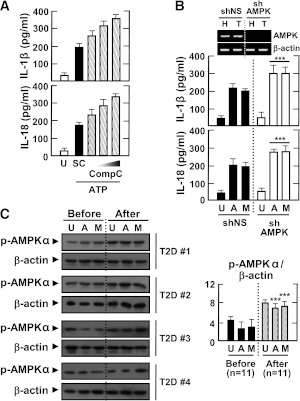
Recent studies have shown that AMPK is activated in the adipose tissue of type 2 diabetic patients treated with metformin (28). We first examined whether inflammasome stimuli would affect the activation of AMPK in MDMs. AMPK was constitutively phosphorylated in MDMs, and levels of AMPK phosphorylation were significantly inhibited in MDMs after stimulation with LPS and ATP (Supplementary Fig. 3A). Then, we examined whether metformin treatment would activate the AMPK pathway in MDMs. As shown in Supplementary Fig. 3B, metformin substantially enhanced phosphorylation of the AMPKα subunit in LPS-primed MDMs after stimulation with ATP or MSU. Furthermore, blockade of the AMPK pathway by the specific pharmacological inhibitor compound C or shRNA against AMPK significantly counteracted the metformin-dependent attenuation of IL-1β and IL-18 production in MDMs (Fig. 6A and B). Finally, type 2 diabetic patients showed increased AMPK activation in their MDMs after 2 months of metformin therapy (Fig. 6C). Thus, metformin inhibits inflammasome activation in type 2 diabetic patients through the AMPK pathway.
FIG. 6.
AMPK pathway activation inhibits the induction of IL-1β and IL-18 production by various inflammasome stimuli in LPS-primed MDMs. Primary MDMs were isolated from healthy controls (A and B; n = 5) or type 2 diabetic patients (C; n = 11) before and after treatment with metformin for 2 months. A: MDMs were primed with LPS (10 ng/mL) for 4 h in the presence of a high glucose concentration (15 mmol/L) and then treated with compound C (Comp C; 5, 10, or 25 μmol/L) and stimulated with ATP (1 mmol/L for 1 h). Data are expressed as means ± SEM of five independent experiments. B: MDMs were transduced with nonspecific control shRNA lentiviral particles (shNS) or lentiviral shRNA specific for AMPK (shAMPK). Then, the cells were primed with LPS (10 ng/mL) for 4 h in the presence of a high glucose concentration (15 mmol/L) and treated with ATP or MSU (100 μg/mL for 6 h). Data are expressed as means ± SEM of three independent experiments. Representative images of semiquantitative RT-PCR gels run to assess transduction efficiency (top). C: The cells were primed with LPS (10 ng/mL) for 4 h in the presence of autologous sera and then treated with ATP or MSU. A and B: ELISA of IL-1β and IL-18 levels. C: Western blotting analysis of p-AMPKα protein levels. The intensity of each band for each protein was quantified and normalized to the housekeeping protein β-actin (C, right). Data are expressed as means ± SEM. ***P < 0.001 vs. control cultures. U, untreated; SC, solvent control; A, ATP; M, MSU; Before, before treatment with metformin; After, after treatment with metformin.
DISCUSSION
Chronic inflammation and inflammasome activation play roles in the pathogenesis of type 2 diabetes (2,29,30). NLRP3 is a member of the NLR family, which is responsible for cytosolic inflammasome activation. The NLRP3 inflammasome has been the focus of particular attention with regard to its roles in inflammatory responses, antimicrobial responses, and a variety of human diseases, including hereditary autoinflammatory syndromes, atherosclerosis, and diabetes (7,22,30,31). Recently, obesity-induced danger signals have been reported to activate the NLRP3 inflammasome and induce the production of IL-1β in adipose tissue in type 2 diabetic patients and mice fed a high-fat diet (9). Circulating levels of C-X-C motif chemokine 10 and CCL2, as well as interferon-γ mRNA and protein levels in adipose tissue, were significantly reduced in NLRP3-deficient mice, suggesting that the NLRP3 inflammasome plays a role in the macrophage–T-cell interactions that are associated with sustained levels of chronic inflammation in obesity-induced metabolic diseases (9). Moreover, the saturated fatty acid palmitate induces activation of the NLRP3 inflammasome in hematopoietic cells, which is responsible for the impairment of insulin signaling and inhibition of glucose tolerance in mice (10).
Although these findings suggest a strong association between the NLRP3 inflammasome and the pathogenesis of type 2 diabetes, whether the levels of mature IL-1β and IL-18 are elevated in hematopoietic cells in type 2 diabetic patients, and whether their levels are reduced after antidiabetic treatment, have not been reported. Here, we present clear evidence that type 2 diabetic patients show elevated levels of NLRP3, ASC, IL-1β, and IL-18 mRNA and protein expression in PBMCs and MDMs. The current study also showed that MDMs from patients with type 2 diabetes have increased activation of caspase-1, maturation of IL-1β, and levels of IL-18 compared with those from healthy controls. We observed that the secretion and maturation of IL-1β were significantly increased in MDMs under high-glucose conditions (data not shown). Previous studies showed that ex vivo culture of monocytes with high glucose levels induces TLR2 and TLR4 expression (24). Additionally, type 2 diabetic patients have elevated TLR2 and TLR4 expression and elevated activation of TLR signaling (24). Moreover, levels of endotoxin, the best-known TLR4-activating ligand, are reported to be increased in type 2 diabetic patients (24). The circulating levels of other danger molecules that activate TLR signals, including HMGB1, heat shock proteins, and hyaluronan (32), are known to be increased in type 2 diabetic patients (24). We observed that HMGB1 and endotoxin levels were significantly elevated in sera from type 2 diabetic patients compared with sera from healthy controls (data not shown). Taken together, our data strongly suggest that endogenous danger molecules are systemically elevated in type 2 diabetes, leading to an intrinsic inflammasome-activating status characterized by elevated basal NLRP3 and ASC expression in MDMs and elevated serum IL-1β and IL-18 levels.
Recent studies have indicated that mitochondria, as the main source of inflammasome-activating ROS, deliver signals for activation of the NLRP3 inflammasome (18,30). A number of studies also have indicated that an altered redox potential and oxidative stress are highly associated with risk factors for type 2 diabetes and its complications (33,34). However, it has not been determined whether hematopoietic cells from patients during the initial stages of type 2 diabetes development have increased mitochondrial ROS generation in response to inflammasome stimuli. In the current study, we observed that monocyte fractions of PBMCs from type 2 diabetic patients showed elevated production of mitochondrial ROS before and after treatment with NLRP3 inflammasome stimuli, suggesting that the increased production of mitochondrial ROS influences NLRP3 inflammasome activation in type 2 diabetic patients. The inhibition of mitochondrial ROS by pharmaceutical inhibitors significantly decreased IL-1β and IL-18 secretion in LPS-primed MDMs from type 2 diabetic patients, suggesting that mitochondrial ROS are responsible for the inflammasome activation in type 2 diabetic patients.
Defective mitochondrial homeostasis in macrophages results in increases in mitochondrial ROS production, thus rendering mitochondria more susceptible to damage by inflammasome stimuli (18). Moreover, mitochondrial ROS generation and mitochondrial membrane permeability transition are required for caspase-1 activation and increased IL-1β secretion (18). Recent studies further suggest that intracellular ROS are required for the association of NLRP3 with thioredoxin-interacting protein, also known as vitamin D3-upregulated protein 1, which plays an important role in NLRP3 inflammasome activation in macrophages (5,7). The mitochondrial outer membrane protein voltage-dependent anion channel, the major channel controlling the flux of metabolites between mitochondria and other cellular compartments (35), is required for NLRP3 inflammasome activation (26). Interestingly, patients with tumor necrosis factor receptor-associated periodic syndrome, an autoinflammatory disorder caused by missense mutations in the type 1 tumor necrosis factor receptor, have elevated mitochondrial ROS levels, which are responsible for the stronger inflammatory responses to LPS (36). Thus, ROS produced by mitochondria play a role in the upregulation of inflammatory responses by acting as signal-transducing molecules (37).
Interestingly, cells obtained from type 2 diabetic patients after 2 months of metformin therapy showed lower levels of inflammatory cytokine production in response to inflammasome stimulation compared with both those initial-phase cells and the levels in healthy controls. Moreover, this treatment also increased AMPK activation in their MDMs. The therapeutic actions of metformin have been suggested to be mediated by activation of the hepatic AMPK pathway. Earlier studies showed that treatment with metformin for 10 weeks significantly increased AMPK activity and Thr172 phosphorylation in skeletal muscle (38). It was demonstrated that adipose AMPK activity was increased in type 2 diabetic patients after metformin treatment and that metformin stimulated phosphorylation of AMPK at Thr172 in 3T3-L1 adipocytes (28). Another recent study showed that metformin downregulates nuclear factor-κB and Bax expression and also specifically suppresses cellular metabolic memory during hyperglycemic stress through SIRT1/LKB1/AMPK pathway activation (39). Metformin has been reported to decrease hepatic glucose production, thereby activating AMPK, reducing fatty liver, and decreasing microvascular and macrovascular complications associated with type 2 diabetes (40). Several studies also have suggested additional benefits of metformin beyond hypoglycemic effects, including improvement of vascular function, regulation of vaspin levels and ovary function in polycystic ovary syndrome, adjuvant treatment for cancer, and disease prevention in prediabetic populations (41–43). The anti-inflammatory effect of metformin also was demonstrated in neutrophils and acute lung injury mediated by mitochondrial complex I inhibition (44). Taken together, these observations suggest that metformin therapy regulates circulating IL-1β levels and inflammasome activation in immune cells from type 2 diabetic patients through modulation of mitochondrial function and activation of the AMPK pathway.
In summary, our data suggest that NLRP3 inflammasome activation is associated with the pathogenesis of type 2 diabetes. Our findings may provide new avenues for antidiabetic therapies, not only against type 2 diabetes but also in a variety of metabolic and inflammatory diseases.
ACKNOWLEDGMENTS
This work was supported by a grant from the Korea Healthcare Technology R&D Project, Ministry for Health, Welfare & Family Affairs, Republic of Korea (A100588), and by the Korea Science & Engineering Foundation through the Infection Signaling Network Research Center (2012-0005763) at Chungnam National University.
No potential conflicts of interest relevant to this article were reported.
H.-M.L., J.-J.K., H.J.K., B.J.K., and E.-K.J. researched data. H.-M.L., B.J.K., and E.-K.J. contributed to discussion, wrote the manuscript, and reviewed and edited the manuscript. J.-J.K., H.J.K., and M.S. contributed to discussion. E.-K.J. is the guarantor of this work, and as such, had full access to all the data in the study, and takes responsibility for the integrity of data and the accuracy of data analysis.
The authors are grateful to Dr. Heung-Sik Choi (Chonnam National University) for helpful discussion and to Tae Sung Kim and Jin Kyung Kim (Chungnam National University) for excellent technical suggestions.
Footnotes
See accompanying commentary, p. 22.
REFERENCES
- 1.Centers for Disease Control and Prevention. National Diabetes Surveillance System: prevalence of diabetes. http://www.cdc.gov/diabetes/statistics/prev/national/menuage.htm 2010
- 2.Donath MY, Shoelson SE. Type 2 diabetes as an inflammatory disease. Nat Rev Immunol 2011;11:98–107 [DOI] [PubMed] [Google Scholar]
- 3.Shoelson SE, Lee J, Goldfine AB. Inflammation and insulin resistance. J Clin Invest 2006;116:1793–1801 [DOI] [PMC free article] [PubMed] [Google Scholar]
- 4.Ceriello A, Motz E. Is oxidative stress the pathogenic mechanism underlying insulin resistance, diabetes, and cardiovascular disease? The common soil hypothesis revisited. Arterioscler Thromb Vasc Biol 2004;24:816–823 [DOI] [PubMed] [Google Scholar]
- 5.Zhou R, Tardivel A, Thorens B, Choi I, Tschopp J. Thioredoxin-interacting protein links oxidative stress to inflammasome activation. Nat Immunol 2010;11:136–140 [DOI] [PubMed] [Google Scholar]
- 6.Pedra JH, Cassel SL, Sutterwala FS. Sensing pathogens and danger signals by the inflammasome. Curr Opin Immunol 2009;21:10–16 [DOI] [PMC free article] [PubMed] [Google Scholar]
- 7.De Nardo D, Latz E. NLRP3 inflammasomes link inflammation and metabolic disease. Trends Immunol 2011;32:373–379 [DOI] [PMC free article] [PubMed] [Google Scholar]
- 8.Stienstra R, Joosten LA, Koenen T, et al. The inflammasome-mediated caspase-1 activation controls adipocyte differentiation and insulin sensitivity. Cell Metab 2010;12:593–605 [DOI] [PMC free article] [PubMed] [Google Scholar]
- 9.Vandanmagsar B, Youm YH, Ravussin A, et al. The NLRP3 inflammasome instigates obesity-induced inflammation and insulin resistance. Nat Med 2011;17:179–188 [DOI] [PMC free article] [PubMed] [Google Scholar]
- 10.Wen H, Gris D, Lei Y, et al. Fatty acid-induced NLRP3-ASC inflammasome activation interferes with insulin signaling. Nat Immunol 2011;12:408–415 [DOI] [PMC free article] [PubMed] [Google Scholar]
- 11.Stienstra R, van Diepen JA, Tack CJ, et al. Inflammasome is a central player in the induction of obesity and insulin resistance. Proc Natl Acad Sci USA 2011;108:15324–15329 [DOI] [PMC free article] [PubMed] [Google Scholar]
- 12.Spranger J, Kroke A, Möhlig M, et al. Inflammatory cytokines and the risk to develop type 2 diabetes: results of the prospective population-based European Prospective Investigation into Cancer and Nutrition (EPIC)-Potsdam Study. Diabetes 2003;52:812–817 [DOI] [PubMed] [Google Scholar]
- 13.Jager J, Grémeaux T, Cormont M, Le Marchand-Brustel Y, Tanti JF. Interleukin-1beta-induced insulin resistance in adipocytes through down-regulation of insulin receptor substrate-1 expression. Endocrinology 2007;148:241–251 [DOI] [PMC free article] [PubMed] [Google Scholar]
- 14.Larsen CM, Faulenbach M, Vaag A, et al. Interleukin-1-receptor antagonist in type 2 diabetes mellitus. N Engl J Med 2007;356:1517–1526 [DOI] [PubMed] [Google Scholar]
- 15.Mandrup-Poulsen T, Pickersgill L, Donath MY. Blockade of interleukin 1 in type 1 diabetes mellitus. Nat Rev Endocrinol 2010;6:158–166 [DOI] [PubMed] [Google Scholar]
- 16.Stutz A, Golenbock DT, Latz E. Inflammasomes: too big to miss. J Clin Invest 2009;119:3502–3511 [DOI] [PMC free article] [PubMed] [Google Scholar]
- 17.Shaw PJ, McDermott MF, Kanneganti TD. Inflammasomes and autoimmunity. Trends Mol Med 2011;17:57–64 [DOI] [PMC free article] [PubMed] [Google Scholar]
- 18.Nakahira K, Haspel JA, Rathinam VA, et al. Autophagy proteins regulate innate immune responses by inhibiting the release of mitochondrial DNA mediated by the NALP3 inflammasome. Nat Immunol 2011;12:222–230 [DOI] [PMC free article] [PubMed] [Google Scholar]
- 19.Coletta DK, Mandarino LJ. Mitochondrial dysfunction and insulin resistance from the outside in: extracellular matrix, the cytoskeleton, and mitochondria. Am J Physiol Endocrinol Metab 2011;301:E749–E755 [DOI] [PMC free article] [PubMed] [Google Scholar]
- 20.DeFronzo RA, Abdul-Ghani M. Type 2 diabetes can be prevented with early pharmacological intervention. Diabetes Care 2011;34(Suppl 2):S202–S209 [DOI] [PMC free article] [PubMed] [Google Scholar]
- 21.WHO/IASO/IOTF , Ed. The Asia-Pacific Perspective: Redefining Obesity and Its Treatment. Melbourne, Health Communications Australia Pty Ltd, 2000 [Google Scholar]
- 22.Lee HM, Yuk JM, Kim KH, et al. Mycobacterium abscessus activates the NLRP3 inflammasome via Dectin-1-Syk and p62/SQSTM1. Immunol Cell Biol 2012;90:601–610. [DOI] [PMC free article] [PubMed] [Google Scholar]
- 23.Yuk JM, Shin DM, Lee HM, et al. Vitamin D3 induces autophagy in human monocytes/macrophages via cathelicidin. Cell Host Microbe 2009;6:231–243 [DOI] [PubMed] [Google Scholar]
- 24.Dasu MR, Devaraj S, Park S, Jialal I. Increased toll-like receptor (TLR) activation and TLR ligands in recently diagnosed type 2 diabetic subjects. Diabetes Care 2010;33:861–868 [DOI] [PMC free article] [PubMed] [Google Scholar]
- 25.Netea MG, Nold-Petry CA, Nold MF, et al. Differential requirement for the activation of the inflammasome for processing and release of IL-1beta in monocytes and macrophages. Blood 2009;113:2324–2335 [DOI] [PMC free article] [PubMed] [Google Scholar]
- 26.Zhou R, Yazdi AS, Menu P, Tschopp J. A role for mitochondria in NLRP3 inflammasome activation. Nature 2011;469:221–225 [DOI] [PubMed] [Google Scholar]
- 27.Herlein JA, Fink BD, O’Malley Y, Sivitz WI. Superoxide and respiratory coupling in mitochondria of insulin-deficient diabetic rats. Endocrinology 2009;150:46–55 [DOI] [PMC free article] [PubMed] [Google Scholar]
- 28.Boyle JG, Logan PJ, Jones GC, et al. AMP-activated protein kinase is activated in adipose tissue of individuals with type 2 diabetes treated with metformin: a randomised glycaemia-controlled crossover study. Diabetologia 2011;54:1799–1809 [DOI] [PubMed] [Google Scholar]
- 29.Lee MS. Role of innate immunity in diabetes and metabolism: recent progress in the study of inflammasomes. Immune Netw 2011;11:95–99 [DOI] [PMC free article] [PubMed] [Google Scholar]
- 30.Masters SL, Latz E, O’Neill LAJ. The inflammasome in atherosclerosis and type 2 diabetes. Sci Transl Med 2011;3:81ps17. [DOI] [PubMed] [Google Scholar]
- 31.Hoffman HM, Mueller JL, Broide DH, Wanderer AA, Kolodner RD. Mutation of a new gene encoding a putative pyrin-like protein causes familial cold autoinflammatory syndrome and Muckle-Wells syndrome. Nat Genet 2001;29:301–305 [DOI] [PMC free article] [PubMed] [Google Scholar]
- 32.Wagner H. Endogenous TLR ligands and autoimmunity. Adv Immunol 2006;91:159–173 [DOI] [PubMed] [Google Scholar]
- 33.Drummond GR, Selemidis S, Griendling KK, Sobey CG. Combating oxidative stress in vascular disease: NADPH oxidases as therapeutic targets. Nat Rev Drug Discov 2011;10:453–471 [DOI] [PMC free article] [PubMed] [Google Scholar]
- 34.Rains JL, Jain SK. Oxidative stress, insulin signaling, and diabetes. Free Radic Biol Med 2011;50:567–575 [DOI] [PMC free article] [PubMed] [Google Scholar]
- 35.Colombini M. VDAC: the channel at the interface between mitochondria and the cytosol. Mol Cell Biochem 2004;256-257:107–115 [DOI] [PubMed] [Google Scholar]
- 36.Bulua AC, Simon A, Maddipati R, et al. Mitochondrial reactive oxygen species promote production of proinflammatory cytokines and are elevated in TNFR1-associated periodic syndrome (TRAPS). J Exp Med 2011;208:519–533 [DOI] [PMC free article] [PubMed] [Google Scholar]
- 37.Naik E, Dixit VM. Mitochondrial reactive oxygen species drive proinflammatory cytokine production. J Exp Med 2011;208:417–420 [DOI] [PMC free article] [PubMed] [Google Scholar]
- 38.Musi N, Hirshman MF, Nygren J, et al. Metformin increases AMP-activated protein kinase activity in skeletal muscle of subjects with type 2 diabetes. Diabetes 2002;51:2074–2081 [DOI] [PubMed] [Google Scholar]
- 39.Zheng Z, Chen H, Li J, et al. Sirtuin 1-mediated cellular metabolic memory of high glucose via the LKB1/AMPK/ROS pathway and therapeutic effects of metformin. Diabetes 2012;61:217–228 [DOI] [PMC free article] [PubMed] [Google Scholar]
- 40.Viollet B, Guigas B, Sanz Garcia N, Leclerc J, Foretz M, Andreelli F. Cellular and molecular mechanisms of metformin: an overview. Clin Sci (Lond) 2012;122:253–270 [DOI] [PMC free article] [PubMed] [Google Scholar]
- 41.Tan BK, Heutling D, Chen J, et al. Metformin decreases the adipokine vaspin in overweight women with polycystic ovary syndrome concomitant with improvement in insulin sensitivity and a decrease in insulin resistance. Diabetes 2008;57:1501–1507 [DOI] [PubMed] [Google Scholar]
- 42.Grenader T, Goldberg A, Shavit L. Metformin as an addition to conventional chemotherapy in breast cancer. J Clin Oncol 2009;27:e260. [DOI] [PubMed] [Google Scholar]
- 43.Joya-Galeana J, Fernandez M, Cervera A, et al. Effects of insulin and oral anti-diabetic agents on glucose metabolism, vascular dysfunction and skeletal muscle inflammation in type 2 diabetic subjects. Diabetes Metab Res Rev 2011;27:373–382 [DOI] [PMC free article] [PubMed] [Google Scholar]
- 44.Zmijewski JW, Lorne E, Zhao X, et al. Mitochondrial respiratory complex I regulates neutrophil activation and severity of lung injury. Am J Respir Crit Care Med 2008;178:168–179 [DOI] [PMC free article] [PubMed] [Google Scholar]


