Abstract
Intrauterine growth restriction (IUGR) increases the risk for metabolic disease and diabetes, although the developmental origins of this remain unclear. We measured glucose metabolism during basal and insulin clamp periods in a fetal sheep model of placental insufficiency and IUGR. Compared with control fetuses (CON), fetuses with IUGR had increased basal glucose production rates and hepatic PEPCK and glucose-6-phosphatase expression, which were not suppressed by insulin. In contrast, insulin significantly increased peripheral glucose utilization rates in CON and IUGR fetuses. Insulin robustly activated AKT, GSK3β, and forkhead box class O (FOXO)1 in CON and IUGR fetal livers. IUGR livers, however, had increased basal FOXO1 phosphorylation, nuclear FOXO1 expression, and Jun NH2-terminal kinase activation during hyperinsulinemia. Expression of peroxisome proliferator–activated receptor γ coactivator 1α and hepatocyte nuclear factor-4α were increased in IUGR livers during basal and insulin periods. Cortisol and norepinephrine concentrations were positively correlated with glucose production rates. Isolated IUGR hepatocytes maintained increased glucose production in culture. In summary, fetal sheep with IUGR have increased hepatic glucose production, which is not suppressed by insulin despite insulin sensitivity for peripheral glucose utilization. These data are consistent with a novel mechanism involving persistent transcriptional activation in the liver that seems to be unique in the fetus with IUGR.
Intrauterine growth restriction (IUGR) increases the risk of preterm birth, neonatal morbidity and mortality, and the development of diabetes and obesity during the life span (1–3). In animal models of IUGR, early developmental shifts in fetal metabolism include increased hepatic gluconeogenic gene expression, glucose production, and decreased pancreatic insulin secretion (2,4–8). Postnatal offspring from animal models of IUGR continue to have increased hepatic glucose production accompanied by insulin resistance and defects in insulin secretion (5,9–12). Activation of glucose production in the fetus with IUGR may be a beneficial adaptive response to maintain glucose supply to vital organs as placental glucose supply is diminished. If persistent after birth, however, this adaptation can have adverse consequences by promoting glucose production in excess of glucose utilization capacity, contributing to persistent hyperglycemia.
Gluconeogenesis is regulated such that expression of PEPCK (PCK1 gene), glucose-6-phosphatase (G6Pase, G6PC gene), and fructose-1,6-bisphosphatase is normally quiescent until just before birth, when increases in glucagon, cortisol, and catecholamines activate the glycogenolytic and gluconeogenic pathways (13–15). Experiments in fetal sheep indicate similar effects of these hormones on glucose metabolism (4,6,15–17). Expression of peroxisome proliferator–activated receptor γ coactivator (PGC) 1α and activation of cAMP-responsive element–binding protein (CREB) are increased in the IUGR fetal liver, supporting a role for increased cAMP in transcriptional activation of PEPCK and G6Pase (6,7,18,19). Previously, we found only modest increases in CCAAT enhancer binding proteins α and β and a lack of activation of several energy and stress sensors, indicating that IUGR produces a complex and robust set of mechanisms resulting in fetal glucose production (6,7).
Insulin is the dominant mechanism for suppressing gluconeogenic gene expression and glucose production; however, the mechanisms of insulin’s effects on postnatal hepatic glucose metabolism have become delineated only recently (20,21). Little is known about the regulation of glucose production in fetuses with premature activation of gluconoegenesis and no prior studies have examined how insulin regulates hepatic glucose metabolism in the IUGR fetus. In the IUGR fetus, basal insulin concentrations are reduced and those of counter-regulatory hormones are increased, favoring increased glucose production (4,6,16,17).
We hypothesized that IUGR produced by placental insufficiency results in an adaptive increase in hepatic glucose production, which is not suppressed by insulin, while peripheral insulin sensitivity for glucose utilization is maintained. Our aim was to test the ability of insulin to suppress hepatic glucose production and gluconeogenic gene activation and simultaneously increase peripheral glucose utilization in a fetal sheep model of IUGR. We also tested whether insulin could appropriately activate and regulate signaling pathways and nuclear proteins in the IUGR fetal liver that control glucose production and the persistence of these effects in isolated hepatocytes.
RESEARCH DESIGN AND METHODS
IUGR fetal sheep model.
Pregnant Columbia-Rambouillet ewes were studied under regulatory compliance at the University of Colorado School of Medicine Perinatal Research Center, Aurora, Colorado. IUGR fetuses were created by exposing pregnant ewes to elevated humidity and temperature (40°C for 12 h, 35°C for 12 h) from 37 ± 1 days’ gestational age (dGA) (term = ∼147 dGA) to 116 ± 1 dGA in an environmentally controlled room (6,7,22). Control (CON) fetuses were from pregnant ewes exposed to normal humidity and temperatures daily (25°C) in an environmentally controlled room from 38 ± 1 to 117 ± 2 dGA. These ewes were pair-fed to the intake of the IUGR ewes. After treatment, ewes were exposed to normal humidity and temperatures until the time of the study. Indwelling catheters were surgically placed in the umbilical vein, descending aorta, and femoral vein of the fetuses at ∼125 dGA (CON, 125 ± 2 dGA; IUGR, 126 ± 1 dGA) using previously described procedures (6,23). Maternal catheters were placed in the femoral artery and vein. All ewes were carrying singleton pregnancies, except for one in the CON group and two in the IUGR group, which were carrying twins or triplets. Only one fetus per pregnancy was catheterized and studied.
Fetal hyperinsulinemic clamp and glucose metabolism study.
A fetal hyperinsulinemic-isoglycemic clamp was performed (CON: 132 ± 1 dGA, n = 6; IUGR: 133 ± 1 dGA, n = 9) (24). Tracer infusions were initiated with a bolus of 3H20 (37.5 μCi) and d-(U-14C-glucose) (62.5 μCi) to measure umbilical blood flow and glucose metabolism, respectively, followed by a constant infusion of 3H20 (0.5 μCi/min) and 14C-glucose (0.83 μCi/min) (6,23,24). After 90 min, four steady-state basal blood samples were drawn simultaneously from the umbilical vein and fetal artery at 10- to 15-min intervals. The clamp was initiated with a priming dose of insulin (150 mU/kg) followed by a constant infusion (3 mU/min/kg based on estimated fetal weight at the time of surgery). Isoglycemia was maintained with a prime (2.5 mL) followed by a variable infusion of glucose (25% dextrose in saline). In addition, a balanced amino acid solution (Trophamine) was infused (2.5 mL prime followed by a variable infusion) in three CON and seven IUGR fetuses. The three CON and two IUGR fetuses that did not receive Trophamine were included in all analyses because no differences were found for variables measured (Supplementary Table 1). Fetal arterial plasma glucose and branched chain amino acid (BCAA) concentrations were monitored every 10–15 min and infusion rates were adjusted to match each fetus’ own mean arterial glucose and BCAA concentration observed during the basal period. After physiologic and isotopic steady state was reached (CON, 166 ± 13 min; IUGR, 164 ± 6 min), another set of four blood samples were drawn at 10- to 15-min intervals. Fetal blood was replaced isovolumetrically with heparinized maternal blood during both draw periods (40 mL/period) (24–26).
Analysis of blood samples.
Measurements were performed in all umbilical venous and arterial samples (four per period), unless indicated, and mean values were calculated per period. Blood samples were analyzed for hematocrit, pH, Po2 and partial pressure of CO2, oxygen saturation, and oxygen content using a blood gas analyzer as well as plasma samples for glucose and lactate using Yellow Springs Instrument 2700 and plasma BCAA concentrations with spectrophotometry (6,7,27). Fetal blood concentration of radioactive glucose and plasma 3H2O were measured as previously described (23,28). Plasma arterial insulin, glucagon, norepinephrine, and cortisol were measured (4,6,29).
Calculations.
Umbilical plasma and blood flow was determined by steady-state diffusion (3H2O) (28,30). Umbilical (net fetal) oxygen, umbilical glucose uptake (UGU) rate, and fetal glucose utilization rate (GUR) were calculated as previously described (6,23,31). Total fetal glucose entry rate (GER) equals the sum of the UGU rate and the glucose infusion rate (GIR). Fetal glucose production rate (GPR) was calculated as the difference between the GUR and GER (6,26). All results were normalized to fetal weight determined at necropsy. Glucose tracer and metabolism data were excluded for one IUGR fetus that was not at isotopic steady state during the insulin period. The fetuses from twin and triplet pregnancies were included in analyses because no differences were noted between them and singletons (Supplementary Table 2).
Liver tissue.
After completion of blood sampling, under insulin-clamped conditions (∼3.5 h after starting insulin), the ewe and fetus were killed. Fetuses were weighed and samples of liver tissue were collected immediately and snap frozen in liquid nitrogen. Liver tissue for molecular analysis also was collected from other CON and IUGR fetuses that received either a hyperinsulinemic-isoglycemic clamp or a saline-only infusion in the absence of glucose tracers. The saline groups provided unstimulated basal tissue for analyses.
Gene expression.
RNA was extracted from liver tissue, reverse transcribed, and used in real-time PCR as previously described (7). Primers used for real-time PCR assays were IGFBP1 (Fʹ-CCAGGGAGCAGCAGAAGGC, Rʹ-GAGCCCAGGCTCTCCGTCCA) and as previously reported (7).
Western blotting.
Whole-cell lysates and nuclear enriched protein lysates were prepared from liver tissue, and Western immunoblotting was performed (7). Antibodies were from Cell Signaling to detect phosphorylated (p-)FOXO1 (T24), total FOXO1, p-Jun NH2-terminal kinase (JNK) (T183/Y185), total JNK, and p-GSK3β (S9); from Calbiochem to detect total GSK3β; from Santa Cruz to detect G6Pase; and from Abcam to detect PEPCK; and as previously described (7). Samples were run on two blots (10 samples each plus a reference sample). Results were quantified on each blot and data for the reference sample on both blots were determined to be similar.
Primary fetal hepatocytes.
Primary fetal sheep hepatocytes were isolated (32). A 15- to 30-g piece of the medial right lobe was flushed with perfusion buffer (PB) (10 mmol/L HEPES, 138 mmol/L NaCl, 5.3 mmol/L KCl, 0.7 mmol/L Na2HPO4) containing 30 U/mL heparin, followed by perfusion with PB supplemented with 0.5 mmol/L EGTA, 2 mmol/L glucose, and 0.5% BSA, and then 500 mL PB supplemented with 2 mmol/L glucose, 3 mmol/L CaCl2, 1.2 mmol/L MgSO4, 0.5% BSA, 0.05% collagenase, and 0.001% DNase I. Digested tissue was filtered, cells were spun and washed three times with Dulbecco’s modified Eagle’s medium (DMEM) similar to fetal circulation (1.1 mmol/L glucose, 2 mmol/L lactate, 2 mmol/L glutamine, 1 mmol/L pyruvate, 1× nonessential amino acids, 1× penicillin-streptomycin) supplemented with 0.1 nmol/L insulin, 10 mmol/L dexamethasone, and 10% FBS. Cells were plated in complete DMEM (3 × 10⁵ cells/cm2, six-well plates, 5 μg/cm2 collagen). After a 4-h attachment period, cells were washed twice and media was replaced with fetal DMEM plus 0.2% BSA. After overnight incubation, hepatocytes were washed twice and incubated in phenol red and glucose-free DMEM with 10 mmol/L HEPES, 0.369% NaHCO3, 2 mmol/L sodium pyruvate, 20 mmol/L sodium lactate containing 100 μmol/L cAMP, 500 nmol/L dexamethasone, or 100 nmol/L insulin, as indicated, for 24 h in duplicate wells. Glucose in the media (glucose oxidase assay) and protein content of cells (bicinchoninic acid protein assay) per well was measured.
Statistical analysis.
Data were analyzed by mixed model ANOVA with fixed effects of group (CON, IUGR), period (basal, insulin), and the interaction and random effect for sheep using SAS software (PROC MIXED). Measurements in liver tissue were analyzed with fixed effects of group (CON, IUGR), treatment (saline, insulin), and the interaction. Hepatocyte data were analyzed similarly and included a random effect for animal of origin. When the interaction was significant, individual posttest comparisons were made. In CON fetuses, GPR was tested against a theoretical mean of zero by one-sample t test and Wilcoxon signed rank test. Statistical significance was declared at P < 0.05.
RESULTS
Fetal characteristics.
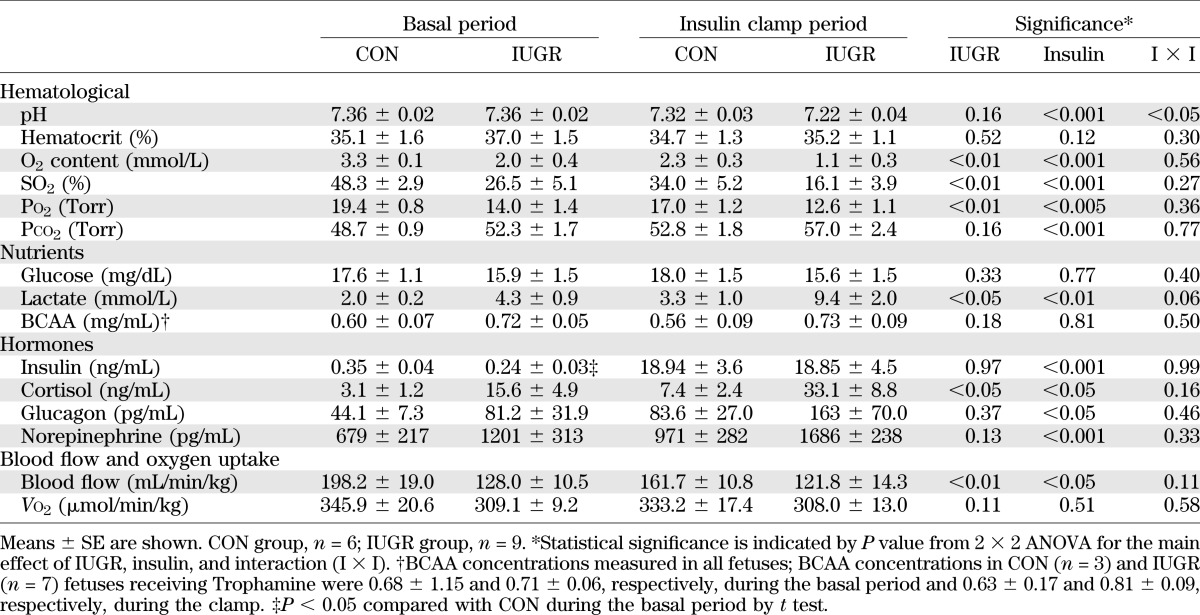
IUGR fetuses had smaller placentas (IUGR, 261 ± 52 g; CON, 444 ± 40 g; P < 0.05) and weighed ∼40% less than CON fetuses (IUGR, 2.1 ± 0.2 kg; CON, 3.4 ± 0.1 kg; P < 0.001). Under basal conditions, IUGR fetuses had 30% lower plasma insulin concentrations and similar glucose and BCAA concentrations compared with CON fetuses (Table 1). Insulin infusions during the clamp increased plasma insulin concentrations similarly by more than 50-fold, and, by design, glucose and BCAA concentrations in CON and IUGR fetuses were not different compared with the basal period (Table 1). This allowed us to test the effect of hyperinsulinemia independently of glucose.
TABLE 1.
Fetal arterial blood hematological values, plasma nutrient and hormone concentrations, and blood flow and oxygen uptake rates
IUGR fetuses had lower arterial blood oxygenation compared with CON fetuses but had similar oxygen consumption rates (Table 1). Hyperinsulinemia further reduced fetal arterial oxygenation in both CON and IUGR groups, yet oxygen consumption rates remained similar (Table 1). Fetal arterial blood pH and the partial pressure of CO2 were similar in CON and IUGR fetuses during the basal period. During hyperinsulinemia, blood pH decreased and the partial pressure of CO2 increased in CON and IUGR fetuses (Table 1). Plasma lactate concentrations were higher in IUGR fetuses under basal conditions and increased twofold in both groups during hyperinsulinemia (Table 1). Weight-specific umbilical blood flow rates were 35% lower in IUGR fetuses during both periods and insulin reduced flow by 5–15% in CON and IUGR fetuses (Table 1).
Glucose metabolism rates.
Insulin infusion rates based on necropsy-determined fetal weight were similar between groups (CON, 2.5 ± 0.3 mU/min/kg; IUGR, 2.9 ± 0.2 mU/min/kg; P = 0.3). UGU was not different between CON or IUGR fetuses during the basal or insulin periods (Fig. 1). GIR and total GER (GER = GIR + UGU) during the clamp were similar between CON and IUGR fetuses, but GER was higher in both groups during hyperinsulinemia due to the GIR (Fig. 1). IUGR fetuses had a higher GPR under basal conditions compared with CON fetuses, which is consistent with prior data (6). In response to hyperinsulinemia, IUGR fetuses maintained this increased GPR. GPR was not significantly different from zero in CON animals during basal or insulin periods (P > 0.05).
FIG. 1.
Glucose metabolism flux rates measured in late gestation CON and growth-restricted (IUGR) fetal sheep during basal and hyperinsulinemic clamp (insulin) periods. Total fetal GER represents the sum of UGU (lower bars) and GIR (upper bars). GUR was measured with glucose tracer, and GPR represents the difference between GUR and GER. Means ± SE are shown for CON (n = 6; white bars) and IUGR (n = 8 or 9; black bars). Significant effects from two-way ANOVA are indicated.
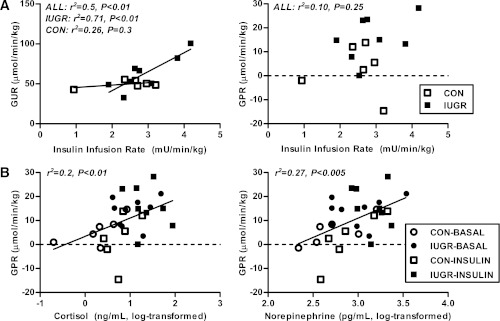
In response to insulin, the GUR increased nearly twofold in both CON and IUGR fetuses. GUR was positively correlated with the insulin infusion rate across all fetuses and study periods. When compared separately, however, the relationship was significant only in IUGR fetuses and not in CON fetuses (Fig. 2A). GPR did not correlate with insulin infusion rate in CON or IUGR fetuses (Fig. 2A).
FIG. 2.
Fetal glucose metabolism rates and plasma hormones. A: The relationship between GUR (left) and GPR (right) and insulin infusion rate during the clamp in CON (n = 6) and growth-restricted (IUGR) (n = 8) fetuses. B: The relationship between GPR with plasma cortisol (log-transformed) (left) and norepinephrine (log-transformed) concentrations (right) in CON and IUGR fetuses during basal and hyperinsulinemic clamp (insulin) periods (n = 28).
Hormone levels.
IUGR fetuses had fivefold increases in arterial plasma cortisol concentrations during basal and insulin periods (Table 1). Concentrations of cortisol, glucagon, and norepinephrine increased by approximately twofold in both CON and IUGR fetuses during hyperinsulinemia (Table 1). GPR was positively correlated with fetal cortisol and norepinephrine concentrations (Fig. 2B) but not glucagon (data not shown).
Hepatic gluconeogenic gene expression.
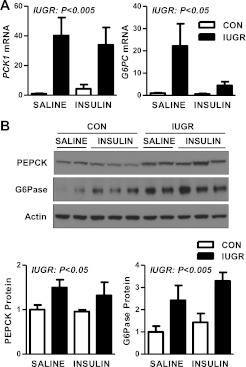
The IUGR fetal liver had a more than 30-fold increase in mRNA abundance of PCK1, the cytosolic form of PEPCK, and a 20-fold increase in G6PC under basal conditions (Fig. 3A). In response to hyperinsulinemia, PCK1 mRNA was not suppressed in the IUGR liver and remained elevated by 30-fold. Expression of G6PC was reduced 75% by insulin in the IUGR livers, yet was still more than fourfold higher compared with CON livers under insulin conditions (Fig. 3A). Given the short half-life (30 min) of PCK1 mRNA, we examined the levels of these proteins. Protein expression of PEPCK was increased by 50% in IUGR livers and expression of G6Pase increased more than twofold during both basal and hyperinsulinemic periods (Fig. 3B).
FIG. 3.
The effect of growth restriction (IUGR) and hyperinsulinemia (insulin) on the expression of gluconeogenic genes and proteins in the fetal liver. Liver samples were collected from CON and IUGR fetuses after a saline infusion (saline) or hyperinsulinemic clamp (insulin). A: RNA was analyzed for expression of PCK1 and G6PC. Means ± SE are shown for each group in saline (CON, n = 5; IUGR, n = 9) and insulin (CON, n = 11; IUGR, n = 13). B: Protein expression of PEPCK, G6Pase, and β-actin was measured by Western blotting in whole-cell tissue lysates. Representative images and quantifications are shown for saline (CON, n = 4; IUGR, n = 4) and insulin (CON, n = 6; IUGR, n = 6). Significant effects from two-way ANOVA are indicated.
Molecular effects of insulin.
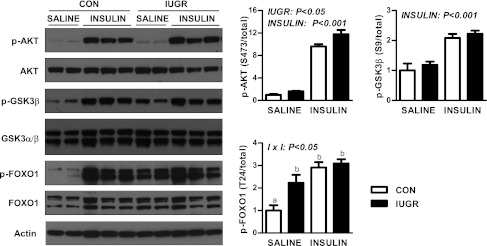
The lack of suppression of GPR and PEPCK by insulin prompted us to evaluate the effect of hyperinsulinemia on the insulin signaling pathway. Expression of components in the proximal pathway (IR-β, IRS-2, p85, AKT1, and AKT2) were relatively similar between CON and IUGR fetal livers during the basal and insulin periods (Supplementary Fig. 1). Phosphorylation of (p-)AKT at S473 was modestly increased under basal and insulin conditions in IUGR livers (Fig. 4). In response to insulin, p-AKT (S473 and T308) increased nearly 10-fold in both the CON and IUGR groups (Fig. 4 and Supplementary Fig. 1). We next measured activation of two AKT target proteins, GSK3β and FOXO1 (33,34). Insulin increased p-GSK3β twofold in CON and IUGR livers (Fig. 4). Under basal conditions, p-FOXO1 (T24) was more than twofold higher in IUGR livers. Furthermore, insulin increased p-FOXO1 by nearly threefold in CON livers but failed to do so in the IUGR livers (Fig. 4).
FIG. 4.
The effect of growth restriction (IUGR) and hyperinsulinemia (insulin) on the activation of AKT, GSK3β, and FOXO1 in the fetal liver. Protein expression of p-AKT (S473), total AKT, p-GSK3β (S9), total GSK3β, p-FOXO1 (T24), total FOXO1, and actin was measured by Western blotting in whole-cell tissue lysates. Representative images are shown. Results were quantified and means ± SE are shown for saline (CON, n = 4; IUGR, n = 4) and insulin (CON, n = 6; IUGR, n = 6). Significant effects from two-way ANOVA are indicated.
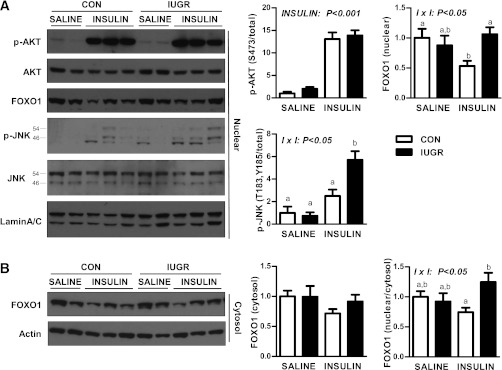
Given the importance of cellular localization of AKT and FOXO1 in mediating insulin’s effects, we measured expression in nuclear and cytosol-enriched protein lysates. Nuclear p-AKT (S473) was increased 10-fold in both the CON and IUGR groups (Fig. 5A). Basal nuclear FOXO1 protein localization was similar between the CON and IUGR groups. Insulin reduced nuclear FOXO1 expression in CON livers by 50%, yet in the IUGR livers nuclear FOXO1 expression was unchanged by insulin and was twofold higher compared with CON livers (Fig. 5A). Cytosolic expression of FOXO1 was similar under basal and insulin conditions (Fig. 5B). The ratio of nuclear to cytosolic FOXO1 protein expression during the insulin period was 25% higher in IUGR livers compared with CON livers (Fig. 5B). Nuclear JNK phosphorylation was increased more than fivefold in the IUGR fetal livers (Fig. 5A) in response to insulin.
FIG. 5.
The effect of growth restriction (IUGR) and hyperinsulinemia (insulin) on nuclear AKT, FOXO1, and JNK in the fetal liver. A: Nuclear protein expression of p-AKT (S473), total AKT, total FOXO1, p-JNK (p54 and p46 at T183/Y185), total JNK (p54 and p46), and lamin A/C measured by Western blotting. B: Cytosolic protein expression of FOXO1 and β-actin. Representative images and quantification of results and ratio of nuclear to cytosolic FOXO1 protein expression are shown. Means ± SE are shown for saline (CON, n = 4; IUGR, n = 4) and insulin (CON, n = 6; IUGR, n = 6). Significant effects from two-way ANOVA are indicated. Bars with different letters are significant differences when interaction (I × I) is significant.
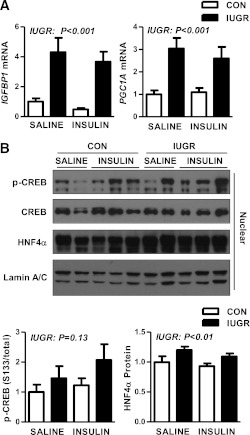
We next examined the mRNA expression of IGFBP1, a target of insulin and a measure of FOXO1 activity (34,35). IGFBP1 was increased fourfold in the IUGR livers under basal conditions and remained increased during hyperinsulinemia, consistent with increased FOXO1 activity (Fig. 6A). Likewise, expression of PGC1A mRNA was increased nearly threefold in the IUGR livers during basal and insulin conditions (Fig. 6A). Nuclear expression of p-CREB was higher in the IUGR livers by 30% during basal conditions and nearly 50% during hyperinsulinemia, although neither increase was statistically different (Fig. 6B). Nuclear expression of hepatocyte nuclear factor 4α (HNF4α) was increased by 20% in IUGR livers (Fig. 6B).
FIG. 6.
The effect of growth restriction (IUGR) and hyperinsulinemia (insulin) on expression nuclear target genes and regulators in the fetal liver. Liver samples were collected from CON and IUGR fetuses after a saline infusion (saline) or hyperinsulinemic clamp (insulin). A: RNA was analyzed for expression of IGFBP1 and PGC1A. Means ± SE are shown for each group in saline (CON, n = 5; IUGR, n = 9) and insulin (CON, n = 11; IUGR, n = 13). B: Nuclear protein expression of p-CREB (S133), total CREB, and total HNF4α was measured by Western blotting. Representative images are shown. Results were quantified and means ± SE are shown for saline (CON, n = 4; IUGR, n = 4) and insulin (CON, n = 6; IUGR, n = 6). Significant effects from two-way ANOVA are indicated.
Isolated primary fetal hepatocytes.
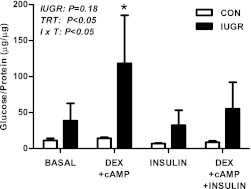
Isolated primary hepatocytes from the IUGR fetal livers had higher glucose output in response to treatment with dexamethasone and cAMP compared with untreated IUGR hepatocytes and compared with CON hepatocytes similarly treated (Fig. 7). IUGR hepatocytes also tended to have higher glucose output (P = 0.18) compared with CON hepatocytes under all treatment conditions.
FIG. 7.
The effect of growth restriction (IUGR) on glucose production in isolated primary fetal hepatocytes. Hepatocytes were isolated from CON and IUGR fetal livers. Glucose production was measured after 24 h of treatment with 500 nmol/L dexamethasone (DEX), 100 μmol/L cAMP, or 100 nmol/L insulin, as indicated. Results are expressed as glucose produced (μg) per amount of protein per well (μg). Means ± SE are shown (CON cell isolations, n = 4; IUGR cell isolations, n = 4). Significant effects from two-way ANOVA are indicated. *P < 0.05 compared with all other group × treatment (I × T) comparisons.
DISCUSSION
This study is the first to show that increased glucose production and hepatic gluconeogenic gene expression (PCK1, G6PC, PGC1A) is not suppressible by insulin in late gestation IUGR fetal sheep. During hyperinsulinemia, GPR remained increased in IUGR fetuses. As expected, CON fetuses had a low basal GPR (not significantly greater than zero) because the gluconeogenic pathway is not activated until just before birth (15), leaving limited GPR for insulin to suppress. In other studies, acute fetal hypoglycemia alone increases GPR and gluconeogenic gene activation, similar to the IUGR fetus (26,36–38). In the hypoglycemic fetus, GPR is suppressed by hyperinsulinemia (26,36), indicating that factors besides hypoglycemia may be contributing to the development of hepatic insulin resistance in the IUGR fetus. Furthermore, these studies demonstrate that fetal GPR can be suppressed using an insulin clamp technique similar to the one performed here. Hyperinsulinemia also robustly increased glucose utilization in both CON and IUGR fetuses, supporting maintained peripheral sensitivity to insulin.
Mechanisms responsible for increased hepatic glucose production and the inability of insulin to suppress this in the IUGR fetus may include the combined effects of hormonal cues and persistently increased nuclear factors. Components in the proximal insulin pathway are similar between CON and IUGR fetal livers and, even in IUGR fetuses, insulin robustly activates nuclear AKT. Furthermore, insulin-stimulated phosphorylation of GSK3β, a target of AKT, is similar between CON and IUGR fetal livers. Thus, there is discordance between normal proximal insulin signaling to AKT and the failure of insulin to suppress gluconeogenic gene expression and GPR in the IUGR fetus. This is consistent with a nuclear mechanism and alteration in transcriptional regulation that seems to be unique in the IUGR fetus compared with adults and rodents with hepatic insulin resistance (39).
Improper FOXO1 activation and regulation may contribute to increased GPR and gluconeogenic gene expression. The phosphorylation and nuclear exclusion of FOXO1 is one well-characterized mechanism for insulin-mediated suppression of gluconeogenic gene expression, and recent studies indicate the importance of proper FOXO1 regulation for hepatic metabolism (40–43). Basal phosphorylation of FOXO1 is higher in the IUGR liver and is not increased further with insulin, nor is nuclear localization reduced, despite normal AKT activation. This is in contrast to the nearly threefold increase in phosphorylation and 50% reduction in nuclear FOXO1 in response in insulin in the CON liver. Expression of PCK1 and IGFBP1 mRNA, both transcriptional targets of FOXO1 (34,35), remain increased during hyperinsulinemia in the IUGR liver, supporting increased nuclear FOXO1 activity. Nuclear phosphorylation of JNK is increased in the IUGR liver with insulin. JNK-mediated phosphorylation of FOXO1 has been shown to prevent 14-3-3 protein binding and subsequent nuclear export and degradation (44). We speculate that increased JNK activation in IUGR may antagonize AKT-induced phosphorylation, which has classically been viewed as the inactivation signal for FOXO1 nuclear exclusion. In addition, decreased phosphatase activity may contribute to increased p-FOXO1 in the IUGR liver. Mechanistic studies in isolated hepatocytes are needed to test these hypotheses.
Expression of PGC1A mRNA, nuclear HNF4α, and p-CREB are increased in the IUGR liver during basal and hyperinsulinemic conditions, supporting the potential role of cAMP-dependent signaling in mediating glucose production (6,7,18,45). IUGR fetuses have increased cortisol concentrations, and cortisol and norepinephrine concentrations positively correlate with GPR, suggesting that these hormones may potentiate glucose production. Indeed, in normal fetal sheep, experimentally induced changes in cortisol, glucagon, and catecholamines have been implicated in regulating glucose production (15–17). Recent studies and our data also support an inverse relationship between fetal oxygenation and catecholamine concentrations (results not shown), which may drive glucose production in the IUGR fetus (6).
The increase in GPR is likely due to gluconeogenesis rather than glycogenolysis because liver glycogen content is similar between CON and IUGR fetuses (data not shown), and PCK1 and G6PC gene expression were both higher in IUGR fetuses during hyperinsulinemia (6,7). Given that G6PC expression was reduced with insulin in IUGR liver, it is possible that there is a change in glycogen flux, as observed in humans and canines during hyperinsulinemia (20,21,46,47). Additional studies are needed to address this in fetal sheep. It is interesting that acute hyperglycemia (fourfold) accompanied by a twofold increase in insulin for 3 h was able to suppress glucose production rates in our fetal sheep model of IUGR (6). This suggests that glucose and insulin regulate glucose production via different mechanisms in the fetus, similar to the differential regulation observed in other species and physiological states (46,48).
Offspring that were IUGR are at an increased risk for the development of insulin resistance and uncontrolled hepatic glucose production (1–3). Recent data suggest that IUGR produces early tissue differences in insulin sensitivity that eventually evolve into insulin resistance as the offspring mature (2). Our data support this: along with the inability of insulin to suppress GPR, IUGR fetal sheep maintained and potentially increased insulin sensitivity for glucose uptake and utilization by peripheral tissues. This finding is consistent with previous data in our model (6) and two other fetal sheep models of placental insufficiency and IUGR (9,25), suggesting maintained or increased peripheral insulin sensitivity for glucose utilization. Despite a nearly 50% reduction in plasma insulin concentrations during basal conditions, IUGR fetuses had a GUR similar to that of CON fetuses (4,6). During the insulin clamp, CON fetuses increased their GUR to a potentially maximal rate because there was little variation in GUR and no relationship with insulin infusion rate. Previous studies in normal fetal sheep have shown that insulin infusions producing more than fivefold increases in insulin concentration (>∼5 ng/mL) during euglycemia result in a maximal GUR of ∼47 μmol/min/kg (24). In contrast, IUGR fetuses in this study demonstrated dose-response sensitivity to insulin infusion rate, with some having a GUR nearly twofold higher than that observed in CON fetuses.
Isolated primary IUGR fetal hepatocytes maintain increased glucose production. The persistence of this phenotype and the lack of induction in CON hepatocytes implicate developmental programming that is independent of in vivo factors such as circulating hormones, hypoxia, and nutrient supply. Future studies are needed to test whether persistent increases in expression of nuclear regulatory factors (PGC1α, FOXO1, or JNK) or alterations in PCK1 promoter are responsible for glucose production in the IUGR liver.
Conclusions.
Glucose diffuses across the placenta to the fetus by concentration-dependent, facilitated transport (49). It is advantageous for the IUGR fetus to have a lower glucose concentration to maximize UGU because it has reduced placental glucose transport capacity (22,50). Maintained or increased peripheral tissue glucose utilization and insulin sensitivity in the IUGR fetus also helps maintain glucose metabolism. The development of GPR adds an additional adaptive capacity of the fetus to maintain plasma glucose concentrations to support glucose uptake and energy metabolism. Together, the increased GPR and GUR maintain the survival of vital organs despite reduced restricted nutrient supply. These changes in fetal glucose metabolism have important implications for managing glucose homeostasis in IUGR neonates. Furthermore, the persistence of these phenotypes across the life span may underlie the increased susceptibility of IUGR offspring to develop hyperglycemia and type 2 diabetes.
ACKNOWLEDGMENTS
This research was supported by National Institutes of Health Grants F32-DK-08220, K01-DK-090199 (S.R.T.), K08-HD-060688, R01-DK-088139 (P.J.R.), K12-HD-04332 (L.D.B.), and T32-HD-07186 (W.W.H.) and a pilot award to S.R.T. (P50-DK-048520).
No potential conflicts of interest relevant to this article were reported.
S.R.T. designed and performed the experiments, analyzed data, and wrote the manuscript. L.D.B., P.J.R., W.W.H., and J.E.F. designed the experiments and reviewed and edited the manuscript. S.R.T. is the guarantor of this work and, as such, had full access to all the data and takes full responsibility for the integrity of the data and the accuracy of the data analysis.
The authors thank David Caprio, Karen Trembler, Alex Cheung, Gates Roe, Meghan O’Meara, and Dan LoTurco, from the University of Colorado, for technical support and Dr. Giacomo Meschia, also from the University of Colorado, for critically evaluating the data.
Footnotes
This article contains Supplementary Data online at http://diabetes.diabetesjournals.org/lookup/suppl/doi:10.2337/db11-1727/-/DC1.
REFERENCES
- 1.Symonds ME, Sebert SP, Hyatt MA, Budge H. Nutritional programming of the metabolic syndrome. Nat Rev Endocrinol 2009;5:604–610 [DOI] [PubMed] [Google Scholar]
- 2.Thorn SR, Rozance PJ, Brown LD, Hay WW., Jr The intrauterine growth restriction phenotype: fetal adaptations and potential implications for later life insulin resistance and diabetes. Semin Reprod Med 2011;29:225–236 [DOI] [PMC free article] [PubMed] [Google Scholar]
- 3.Martin-Gronert MS, Ozanne SE. Experimental IUGR and later diabetes. J Intern Med 2007;261:437–452 [DOI] [PubMed] [Google Scholar]
- 4.Limesand SW, Rozance PJ, Zerbe GO, Hutton JC, Hay WW., Jr Attenuated insulin release and storage in fetal sheep pancreatic islets with intrauterine growth restriction. Endocrinology 2006;147:1488–1497 [DOI] [PubMed] [Google Scholar]
- 5.Park JH, Stoffers DA, Nicholls RD, Simmons RA. Development of type 2 diabetes following intrauterine growth retardation in rats is associated with progressive epigenetic silencing of Pdx1. J Clin Invest 2008;118:2316–2324 [DOI] [PMC free article] [PubMed] [Google Scholar]
- 6.Limesand SW, Rozance PJ, Smith D, Hay WW., Jr Increased insulin sensitivity and maintenance of glucose utilization rates in fetal sheep with placental insufficiency and intrauterine growth restriction. Am J Physiol Endocrinol Metab 2007;293:E1716–E1725 [DOI] [PubMed] [Google Scholar]
- 7.Thorn SR, Regnault TR, Brown LD, et al. Intrauterine growth restriction increases fetal hepatic gluconeogenic capacity and reduces messenger ribonucleic acid translation initiation and nutrient sensing in fetal liver and skeletal muscle. Endocrinology 2009;150:3021–3030 [DOI] [PMC free article] [PubMed] [Google Scholar]
- 8.Nijland MJ, Mitsuya K, Li C, et al. Epigenetic modification of fetal baboon hepatic phosphoenolpyruvate carboxykinase following exposure to moderately reduced nutrient availability. J Physiol 2010;588:1349–1359 [DOI] [PMC free article] [PubMed] [Google Scholar]
- 9.Owens JA, Gatford KL, De Blasio MJ, Edwards LJ, McMillen IC, Fowden AL. Restriction of placental growth in sheep impairs insulin secretion but not sensitivity before birth. J Physiol 2007;584:935–949 [DOI] [PMC free article] [PubMed] [Google Scholar]
- 10.Rueda-Clausen CF, Dolinsky VW, Morton JS, Proctor SD, Dyck JR, Davidge ST. Hypoxia-induced intrauterine growth restriction increases the susceptibility of rats to high-fat diet-induced metabolic syndrome. Diabetes 2011;60:507–516 [DOI] [PMC free article] [PubMed] [Google Scholar]
- 11.Lane RH, Flozak AS, Ogata ES, Bell GI, Simmons RA. Altered hepatic gene expression of enzymes involved in energy metabolism in the growth-retarded fetal rat. Pediatr Res 1996;39:390–394 [DOI] [PubMed] [Google Scholar]
- 12.Vuguin P, Raab E, Liu B, Barzilai N, Simmons R. Hepatic insulin resistance precedes the development of diabetes in a model of intrauterine growth retardation. Diabetes 2004;53:2617–2622 [DOI] [PubMed] [Google Scholar]
- 13.Pilkis SJ, Granner DK. Molecular physiology of the regulation of hepatic gluconeogenesis and glycolysis. Annu Rev Physiol 1992;54:885–909 [DOI] [PubMed] [Google Scholar]
- 14.Hanson RW, Reshef L. Regulation of phosphoenolpyruvate carboxykinase (GTP) gene expression. Annu Rev Biochem 1997;66:581–611 [DOI] [PubMed] [Google Scholar]
- 15.Fowden AL, Mundy L, Silver M. Developmental regulation of glucogenesis in the sheep fetus during late gestation. J Physiol 1998;508:937–947 [DOI] [PMC free article] [PubMed] [Google Scholar]
- 16.Fowden AL, Forhead AJ. Adrenal glands are essential for activation of glucogenesis during undernutrition in fetal sheep near term. Am J Physiol Endocrinol Metab 2011;300:E94–E102 [DOI] [PMC free article] [PubMed] [Google Scholar]
- 17.Teng C, Battaglia FC, Meschia G, Narkewicz MR, Wilkening RB. Fetal hepatic and umbilical uptakes of glucogenic substrates during a glucagon-somatostatin infusion. Am J Physiol Endocrinol Metab 2002;282:E542–E550 [DOI] [PubMed] [Google Scholar]
- 18.Rhee J, Inoue Y, Yoon JC, et al. Regulation of hepatic fasting response by PPARgamma coactivator-1alpha (PGC-1): requirement for hepatocyte nuclear factor 4alpha in gluconeogenesis. Proc Natl Acad Sci U S A 2003;100:4012–4017 [DOI] [PMC free article] [PubMed] [Google Scholar]
- 19.Herzig S, Long F, Jhala US, et al. CREB regulates hepatic gluconeogenesis through the coactivator PGC-1. Nature 2001;413:179–183 [DOI] [PubMed] [Google Scholar]
- 20.Edgerton DS, Ramnanan CJ, Grueter CA, et al. Effects of insulin on the metabolic control of hepatic gluconeogenesis in vivo. Diabetes 2009;58:2766–2775 [DOI] [PMC free article] [PubMed] [Google Scholar]
- 21.Ramnanan CJ, Edgerton DS, Rivera N, et al. Molecular characterization of insulin-mediated suppression of hepatic glucose production in vivo. Diabetes 2010;59:1302–1311 [DOI] [PMC free article] [PubMed] [Google Scholar]
- 22.Bell AW, Wilkening RB, Meschia G. Some aspects of placental function in chronically heat-stressed ewes. J Dev Physiol 1987;9:17–29 [PubMed] [Google Scholar]
- 23.Hay WW, Jr, Sparks JW, Quissell BJ, Battaglia FC, Meschia G. Simultaneous measurements of umbilical uptake, fetal utilization rate, and fetal turnover rate of glucose. Am J Physiol 1981;240:E662–E668 [DOI] [PubMed] [Google Scholar]
- 24.Hay WW, Jr, Meznarich HK, DiGiacomo JE, Hirst K, Zerbe G. Effects of insulin and glucose concentrations on glucose utilization in fetal sheep. Pediatr Res 1988;23:381–387 [DOI] [PubMed] [Google Scholar]
- 25.Wallace JM, Milne JS, Aitken RP, Hay WW., Jr Sensitivity to metabolic signals in late-gestation growth-restricted fetuses from rapidly growing adolescent sheep. Am J Physiol Endocrinol Metab 2007;293:E1233–E1241 [DOI] [PubMed] [Google Scholar]
- 26.DiGiacomo JE, Hay WW., Jr Fetal glucose metabolism and oxygen consumption during sustained hypoglycemia. Metabolism 1990;39:193–202 [DOI] [PubMed] [Google Scholar]
- 27.Brown LD, Hay WW., Jr Effect of hyperinsulinemia on amino acid utilization and oxidation independent of glucose metabolism in the ovine fetus. Am J Physiol Endocrinol Metab 2006;291:E1333–E1340 [DOI] [PubMed] [Google Scholar]
- 28.Van Veen LC, Hay WW, Jr, Battaglia FC, Meschia G. Fetal CO2 kinetics. J Dev Physiol 1984;6:359–365 [PubMed] [Google Scholar]
- 29.Maliszewski AM, Gadhia MM, O’Meara MC, Thorn SR, Rozance PJ, Brown LD. Prolonged infusion of amino acids increases leucine oxidation in fetal sheep. Am J Physiol Endocrinol Metab 2012;302:E1483–E1492 [DOI] [PMC free article] [PubMed] [Google Scholar]
- 30.Meschia G, Cotter JR, Breathnach CS, Barron DH. Simultaneous measurement of uterine and umbilical blood flows and oxygen uptake. Q J Exp Physiol 1966;52:1–8 [Google Scholar]
- 31.Hay WW, Jr, Sparks JW, Battaglia FC, Meschia G. Maternal-fetal glucose exchange: necessity of a three-pool model. Am J Physiol 1984;246:E528–E534 [DOI] [PubMed] [Google Scholar]
- 32.Townsend SF, Thureen PJ, Hay WW, Jr, Narkewicz MR. Development of primary culture of ovine fetal hepatocytes for studies of amino acid metabolism and insulinlike growth factors. In Vitro Cell Dev Biol Anim 1993;29A:592–596 [DOI] [PubMed] [Google Scholar]
- 33.Zhang W, Patil S, Chauhan B, et al. FoxO1 regulates multiple metabolic pathways in the liver: effects on gluconeogenic, glycolytic, and lipogenic gene expression. J Biol Chem 2006;281:10105–10117 [DOI] [PubMed] [Google Scholar]
- 34.Dong XC, Copps KD, Guo S, et al. Inactivation of hepatic Foxo1 by insulin signaling is required for adaptive nutrient homeostasis and endocrine growth regulation. Cell Metab 2008;8:65–76 [DOI] [PMC free article] [PubMed] [Google Scholar]
- 35.Hall RK, Yamasaki T, Kucera T, Waltner-Law M, O’Brien R, Granner DK. Regulation of phosphoenolpyruvate carboxykinase and insulin-like growth factor-binding protein-1 gene expression by insulin. The role of winged helix/forkhead proteins. J Biol Chem 2000;275:30169–30175 [DOI] [PubMed] [Google Scholar]
- 36.DiGiacomo JE, Hay WW., Jr Regulation of placental glucose transfer and consumption by fetal glucose production. Pediatr Res 1989;25:429–434 [DOI] [PubMed] [Google Scholar]
- 37.Rozance PJ, Limesand SW, Barry JS, et al. Chronic late-gestation hypoglycemia upregulates hepatic PEPCK associated with increased PGC1alpha mRNA and phosphorylated CREB in fetal sheep. Am J Physiol Endocrinol Metab 2008;294:E365–E370 [DOI] [PMC free article] [PubMed] [Google Scholar]
- 38.Narkewicz MR, Carver TD, Hay WW., Jr Induction of cytosolic phosphoenolpyruvate carboxykinase in the ovine fetal liver by chronic fetal hypoglycemia and hypoinsulinemia. Pediatr Res 1993;33:493–496 [DOI] [PubMed] [Google Scholar]
- 39.Samuel VT, Shulman GI. Mechanisms for insulin resistance: common threads and missing links. Cell 2012;148:852–871 [DOI] [PMC free article] [PubMed] [Google Scholar]
- 40.Lu M, Wan M, Leavens KF, et al. Insulin regulates liver metabolism in vivo in the absence of hepatic Akt and Foxo1. Nat Med 2012;18:388–395 [DOI] [PMC free article] [PubMed] [Google Scholar]
- 41.Kamagate A, Kim DH, Zhang T, et al. FoxO1 links hepatic insulin action to endoplasmic reticulum stress. Endocrinology 2010;151:3521–3535 [DOI] [PMC free article] [PubMed] [Google Scholar]
- 42.Hall RK, Wang XL, George L, Koch SR, Granner DK. Insulin represses phosphoenolpyruvate carboxykinase gene transcription by causing the rapid disruption of an active transcription complex: a potential epigenetic effect. Mol Endocrinol 2007;21:550–563 [DOI] [PubMed] [Google Scholar]
- 43.Puigserver P, Rhee J, Donovan J, et al. Insulin-regulated hepatic gluconeogenesis through FOXO1-PGC-1alpha interaction. Nature 2003;423:550–555 [DOI] [PubMed] [Google Scholar]
- 44.Greer EL, Brunet A. FOXO transcription factors in ageing and cancer. Acta Physiol (Oxf) 2008;192:19–28 [DOI] [PubMed] [Google Scholar]
- 45.Nyirenda MJ, Dean S, Lyons V, Chapman KE, Seckl JR. Prenatal programming of hepatocyte nuclear factor 4alpha in the rat: A key mechanism in the ‘foetal origins of hyperglycaemia’? Diabetologia 2006;49:1412–1420 [DOI] [PubMed] [Google Scholar]
- 46.Petersen KF, Laurent D, Rothman DL, Cline GW, Shulman GI. Mechanism by which glucose and insulin inhibit net hepatic glycogenolysis in humans. J Clin Invest 1998;101:1203–1209 [DOI] [PMC free article] [PubMed] [Google Scholar]
- 47.Adkins A, Basu R, Persson M, et al. Higher insulin concentrations are required to suppress gluconeogenesis than glycogenolysis in nondiabetic humans. Diabetes 2003;52:2213–2220 [DOI] [PubMed] [Google Scholar]
- 48.Kahn CR, Lauris V, Koch S, Crettaz M, Granner DK. Acute and chronic regulation of phosphoenolpyruvate carboxykinase mRNA by insulin and glucose. Mol Endocrinol 1989;3:840–845 [DOI] [PubMed] [Google Scholar]
- 49.Hay WW, Jr, Molina RA, DiGiacomo JE, Meschia G. Model of placental glucose consumption and glucose transfer. Am J Physiol 1990;258:R569–R577 [DOI] [PubMed] [Google Scholar]
- 50.Thureen PJ, Trembler KA, Meschia G, Makowski EL, Wilkening RB. Placental glucose transport in heat-induced fetal growth retardation. Am J Physiol 1992;263:R578–R585 [DOI] [PubMed] [Google Scholar]


