

Abstract
Fetuin-A interferes with insulin action in animal studies, but data on fetuin-A and diabetes risk in humans are sparse and the role of nonalcoholic fatty liver disease in this association is unknown. From 2000 to 2006, we prospectively identified 470 matched incident diabetes case-control pairs in the Nurses’ Health Study, for whom levels of plasma fetuin-A, alanine transaminase (ALT), and γ-glutamyltranspeptidase (GGT) were measured. After multivariate adjustment for covariates, including ALT and GGT, the odds ratio (OR) (95% CI) comparing extreme fetuin-A quintiles was 1.81 (1.07–3.06) (P for trend = 0.009). A mediational analysis showed that this positive association was largely (79.9%) explained by fasting insulin and hemoglobin A1c levels; after further adjustment of these factors, the OR (95% CI) comparing extreme quintiles was attenuated to 1.09 (0.56–2.10) (P for trend = 0.42). In addition, liver enzymes did not modify this association (P for interaction = 0.91 for ALT and 0.58 for GGT). When results from this study were pooled with those in three prior prospective investigations of the same association, a consistent, positive association was observed between high fetuin-A levels and diabetes risk: the relative risk (95% CI) comparing high versus low fetuin-A levels was 1.69 (1.39–2.05) (P for heterogeneity = 0.45). These findings suggest that plasma fetuin-A levels were independently associated with higher risk of developing type 2 diabetes.
The liver plays a pivotal role in glucose metabolism and works in concert with the pancreas, muscle, adipose tissue, and other organs to maintain glucose homeostasis in the circulation (1). Besides its function in gluconeogenesis and glycogen synthesis, accumulating evidence indicates that the liver also secretes molecules that can directly regulate peripheral insulin sensitivity (2–5). Of these molecules, fetuin-A is a serum glycoprotein produced primarily in the liver that circulates at high levels (6,7). Widely deemed as an inhibitor of calcification (8,9), fetuin-A also can inhibit the insulin receptor at the tyrosine kinase level (4,10,11). Animal studies have consistently shown that fetuin-A knockout mice are resistant to weight gain and insulin resistance induced by diet or aging (12,13). Human observational studies regarding fetuin-A levels in relation to insulin resistance or diabetes are scarce. Several cross-sectional studies documented a positive association between fetuin-A and prevalent diabetes (14,15), although a temporal relationship cannot be extrapolated from these studies. Thus far, only three prospective studies have been conducted and all reported a positive association between fetuin-A levels and diabetes risk (16–18). However, it is largely unknown whether nonalcoholic fatty liver disease (NAFLD), a condition associated with both diabetes and fetuin-A levels (19,20), may explain or modify the association between fetuin-A and diabetes risk. Therefore, we performed a prospective, nested, case-control study among the Nurses’ Health Study (NHS) participants to examine the association between fetuin-A and diabetes risk and to explore whether this association is explained or modified by alanine transaminase (ALT) and γ-glutamyltranspeptidase (GGT), two liver enzymes that serve as surrogate markers of NAFLD (21).
RESEARCH DESIGN AND METHODS
Study population.
A total of 121,700 registered nurses living in one of 11 populous U.S. states composed the NHS when they responded to a questionnaire inquiring about their medical history and lifestyle characteristics in 1976. In 2000–2001, 18,717 NHS participants aged 53–79 years provided blood samples via overnight courier, which were immediately processed upon arrival; aliquots were placed into cryotubes as plasma, buffy coat, and erythrocytes. All cryotubes were stored in the vapor phase of liquid nitrogen freezers at −130°C or less. Among these participants, we conducted a prospective, nested, case-control study to examine plasma biomarkers in relation to type 2 diabetes risk. After excluding women with self-reported prevalent diabetes, cardiovascular disease, and cancer at blood draw, we prospectively identified and confirmed 470 type 2 diabetes cases from the date of blood draw through June 2006. We used risk-set sampling to randomly select one control for each case from the rest of population who remained free of diabetes when the case was diagnosed (22); the probability of being selected as a control is proportional to the length of follow-up. We further matched cases and controls for age at blood draw (±1 year), date of blood draw (±3 months), fasting status (fast for ≥8 h or not), and race (white or other races). Of note, we excluded cases diagnosed with diabetes within the first year since blood collection to minimize reverse causation bias. The study protocol was approved by the institutional review board of the Brigham and Women’s Hospital and the Human Subjects Committee Review Board of Harvard School of Public Health.
Ascertainment of type 2 diabetes.
In the baseline questionnaire and all biennial follow-up questionnaires, we inquire about the incidence of physician-diagnosed diabetes. Participants who report such a diagnosis received a supplementary questionnaire querying about symptoms, diagnostic tests, and treatment for the purpose of confirmation. The self-report of diagnosis of type 2 diabetes has been demonstrated to be highly reliable in a validation study (23) in which self-reported diagnosis of diabetes was confirmed by medical records, which were reviewed by an endocrinologist blinded to the supplementary questionnaire information for 61 of 62 randomly selected participants who responded. In another validation study among the NHS participants, the reliability of a “negative screen” also was examined. Medical record review documented that 129 of 130 participants who reported a negative screen had fasting plasma glucose levels <126 mg/dL (24). Only patients with confirmed type 2 diabetes were included in this study. We used the American Diabetes Association 1998 criteria to confirm or refute self-reported type 2 diabetes diagnosis: 1) an elevated glucose concentration (fasting plasma glucose ≥7.0 mmol/L, random plasma glucose ≥11.1 mmol/L, or plasma glucose ≥11.1 mmol/L after an oral glucose load) and at least one symptom (excessive thirst, polyuria, weight loss, or hunger) related to diabetes; 2) no symptoms, but elevated glucose concentrations on two occasions; or 3) treatment with insulin or oral hypoglycemic medication.
Measurement of fetuin-A and other biomarkers.
Samples from each case-control pair were shipped in the same batch and analyzed in the same run. Within each batch, samples were assayed by the same technicians in a random sequence under identical conditions. Plasma fetuin-A levels were measured in singlicates by an enzyme immunoassay from R&D Systems (Minneapolis, MN). Plasma levels of ALT and GGT were measured using a direct enzymatic colorimetric assay, performed on the Roche P Modular system (Roche Diagnostics, Indianapolis, IN). Quality control samples (n = 80) were run along with the case-control samples. Based on the measurements of these samples, the average intra-assay coefficient of variation (CV) was 13.1% for fetuin-A, 7.9% for ALT, and 3.4% for GGT. We also measured C-reactive protein (CRP), hemoglobin A1c (HbA1c), fasting insulin, and adiponectin among the cases and controls. The CVs for these assays was 1.2% for CRP, 5.3% for HbA1c, 3.3% for fasting insulin, and 8.0% for adiponectin.
Assessment of covariates.
Information on major lifestyle practices, medical history, and body weight was collected at baseline and has been updated every two years since study baseline. BMI as self-reported weight in kilograms divided by height in meters squared was calculated to assess overall adiposity. We asked the participants to measure their waist circumference (at umbilicus) in 2000. Since 1980, diet has been assessed using a validated semiquantitative food frequency questionnaire every 2–4 years. Nutrient intake was calculated based on responses to the food frequency questionnaire, and the nutrient content of foods was derived from the Harvard Food Composition Database. Information on cigarette smoking, physical activity, family history of diabetes, postmenopausal hormone use, and history of hypertension or hypercholesterolemia also was assessed. We used the measurements of these covariates (except waist circumference) derived from the questionnaire administered in 1998 in the current analysis. The validity of these assessments has been documented in previous investigations (25–28).
Statistical methods.
Correlations between fetuin-A levels and diabetes risk factors, including age, BMI, waist circumference, and biomarkers, were evaluated using partial Spearman correlation coefficients (r), which were controlled for age at blood draw, time of blood draw, race, BMI, waist circumference, smoking status, postmenopausal hormone use, physical activity, alcohol use, and fasting status whenever appropriate. To evaluate the association between fetuin-A and diabetes risk, we used both conditional logistic regression and unconditional logistic regression. Because both methods generated largely similar results but unconditional logistic regression had more power for interaction tests, we show results only from unconditional logistic regression in this study. We categorized the study population into quintiles according to the distribution of fetuin-A levels among controls. In multivariate analysis, we controlled for all matching factors as well as the aforementioned covariates plus family history of diabetes; Alternate Healthy Eating Index (summarizing higher intakes of vegetables, fruit, nuts, soy, and cereal fiber, higher ratios of chicken plus fish to red meat and polyunsaturated to saturated fat, lower intake of trans fat, and multivitamin use for ≥5 years) (29); coffee consumption; history of hypercholesterolemia or hypertension; and levels of CRP, ALT, and GGT. P values for linear trend were calculated by entering the median value in each quintile of fetuin-A levels into the multivariate models. To examine potential interactions between fetuin-A and liver enzymes, we constructed interaction terms between these biomarkers in tertiles and used likelihood ratio tests to assess the significance of these interaction terms. Likelihood ratio tests are calculated as the difference of −2 log likelihood in models with and without interaction terms and follow the χ2 distribution with the degree of freedom equal to the number of parameters for the interaction terms. We used the same method to examine whether the association of fetuin-A is constant over time by evaluating the interaction between fetuin-A levels and the follow-up period. To model the dose-response relationship, we used restricted cubic spline regressions with three knots to examine possible nonlinear relationships between fetuin-A levels and risk of type 2 diabetes. Tests for nonlinearity were based on the likelihood ratio test, comparing the model with only the linear term to the model with the linear and the cubic spline terms. In a secondary analysis, we examined the extent to which the association of fetuin-A with diabetes risk can be mediated through fasting insulin and HbA1c using an SAS macro %MEDIATE (available upon request). This program was based on the work of Lin et al. (30) estimating the proportion of treatment effect ascribed to surrogate markers. Last, we fitted a random-effects model to pool our results with previous studies (16–18) examining the same association.
All P values were two-sided, and 95% CIs were calculated for odds ratios (ORs). Data were analyzed with the Statistical Analysis Systems software package, version 9.1 (SAS Institute, Inc., Cary, NC) and STATA version 11.0 (Stata Corporation, College Station, TX).
RESULTS
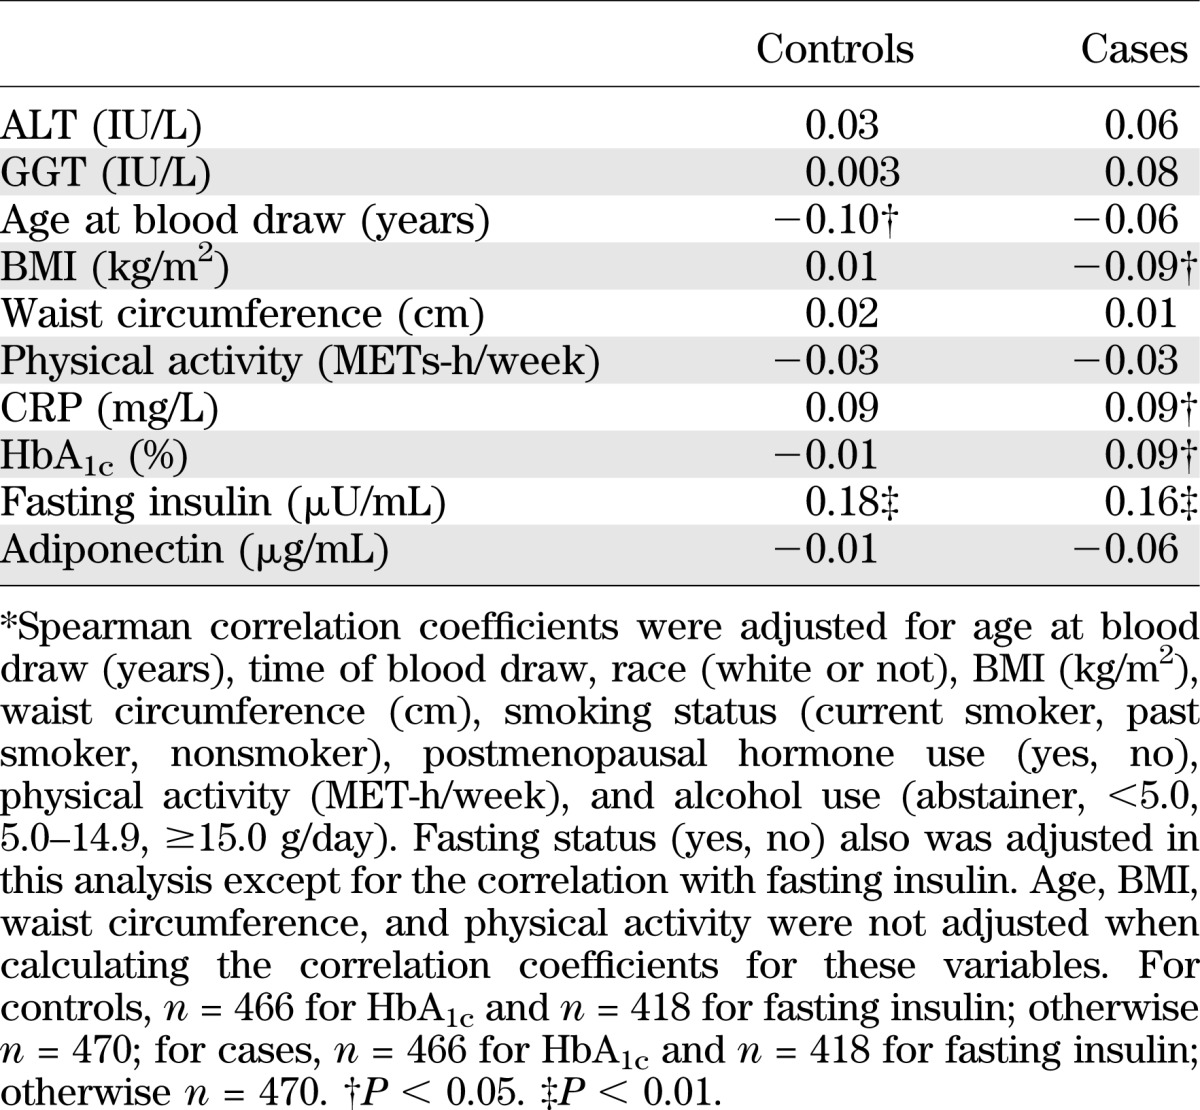
Table 1 shows baseline characteristics of cases and controls. Cases subjects with diabetes had a less favorable profile of lifestyle practices and medical history than controls, except for matching factors, which were evenly distributed between cases and controls. In terms of biochemical risk factors for type 2 diabetes, including fetuin-A, ALT, and GGT, cases had significantly higher levels of all of these markers at baseline than controls. Among controls, fetuin-A levels were inversely correlated with age at blood draw and were positively correlated with fasting insulin levels (Table 2). The correlations with liver enzymes did not reach the level of significance. Among cases, we observed a largely similar pattern of correlations, although the correlation with HbA1c and BMI was somewhat stronger than that among controls.
TABLE 1.
Baseline characteristics of cases with type 2 diabetes and controls in 2000–2001 from the Nurses’ Health Study
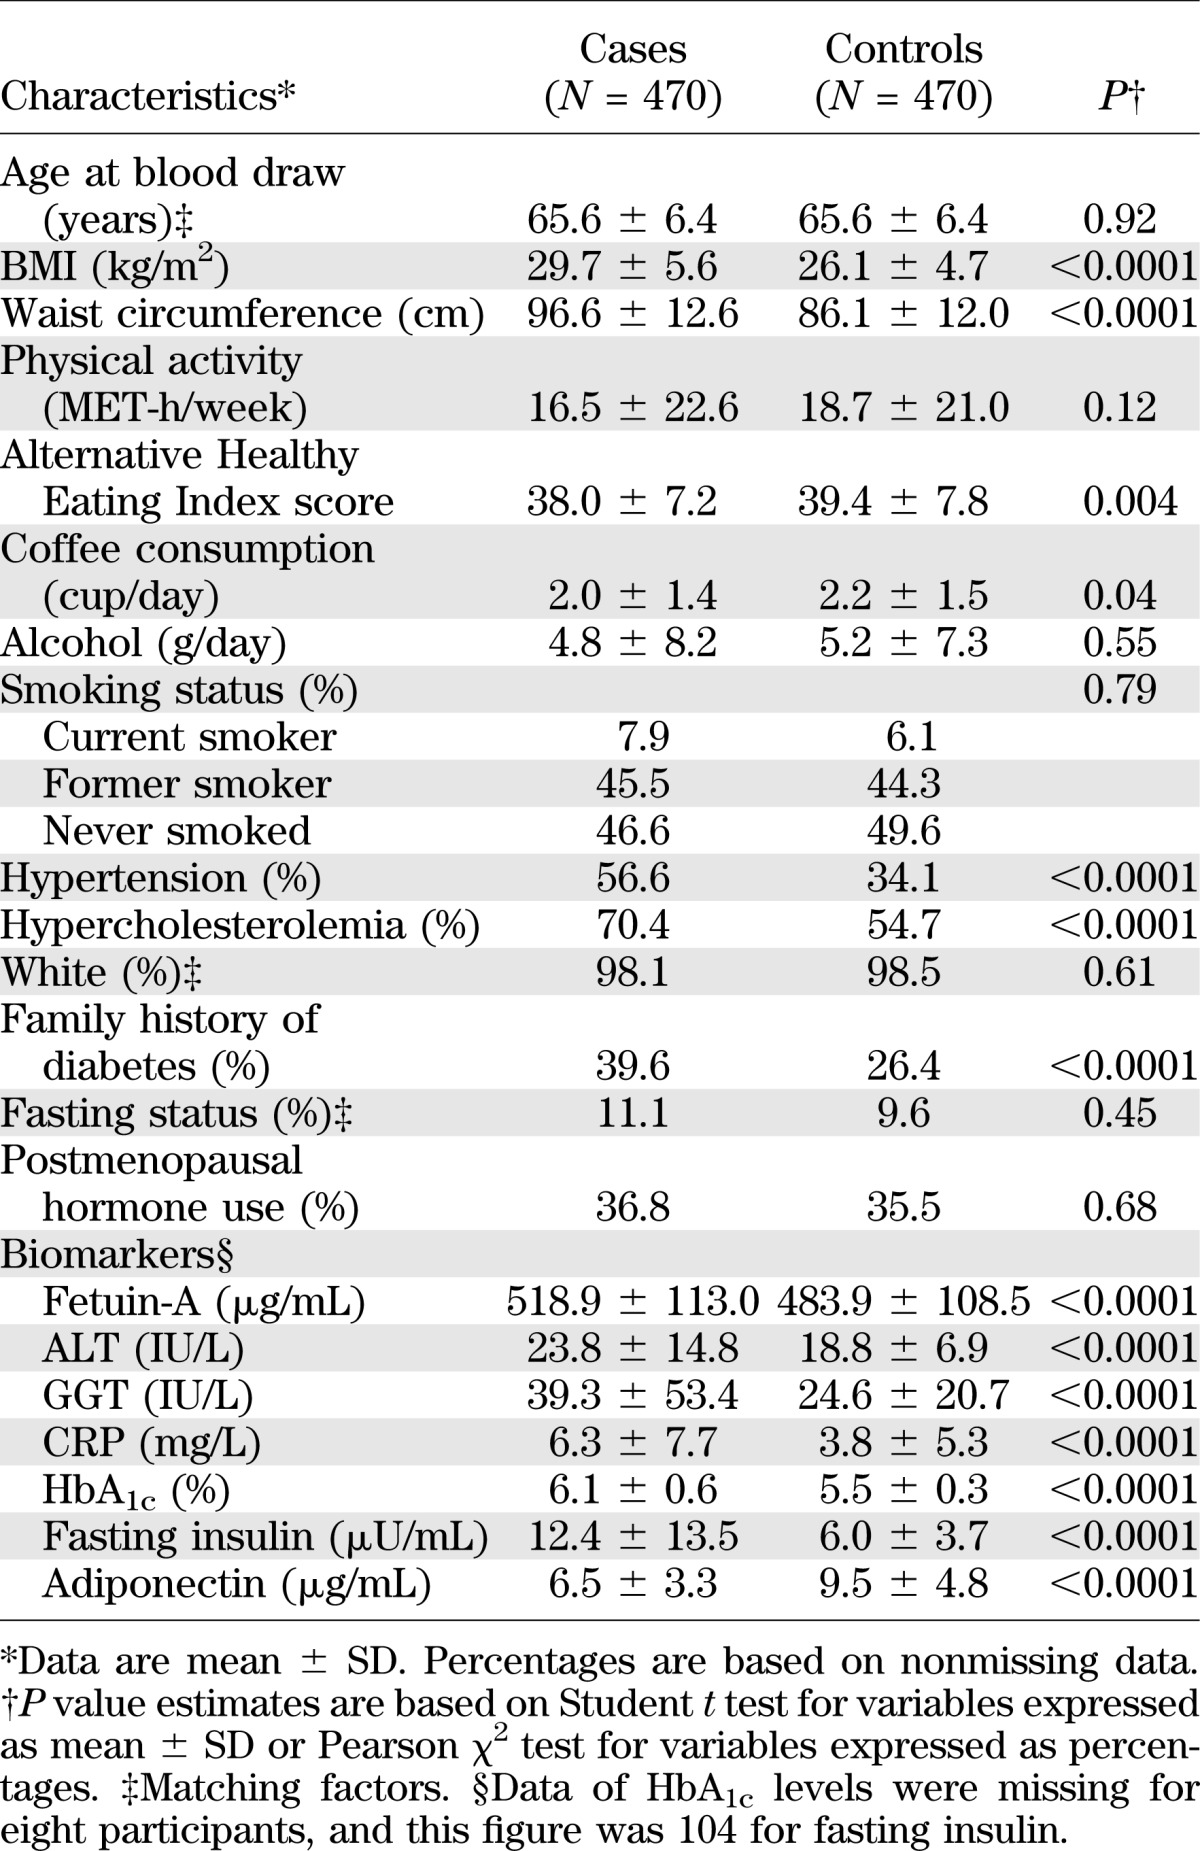
TABLE 2.
Spearman partial correlation coefficients* between fetuin-A (μg/mL) and selected diabetes risk factors among cases and controls from the Nurses’ Health Study
In a crude analysis adjusting for only matching factors, fetuin-A levels were significantly associated with increased risk of type 2 diabetes (Table 3). After further adjusting for diabetes risk factors, including BMI, waist circumference, alcohol use, and CRP levels, the OR comparing extreme quintiles was attenuated from 2.20 to 1.77. Additional adjustment for ALT and GGT did not change these associations materially; the OR (95% CI) was 1.81 (1.07–3.06) (P for trend = 0.009). Last, when we further controlled for fasting insulin that may mediate the effects of fetuin-A on diabetes risk, the OR (95% CI) was attenuated to 1.23 (0.70–2.16) (P for trend = 0.16). Adjustment of HbA1c further attenuated this OR (95% CI) to 1.09 (0.56–2.10) (P for trend = 0.42). Overall, we estimated that 79.9% (P = 0.03) of the association between fetuin-A and diabetes risk could be ascribed to fasting insulin and HbA1c levels. Further adjustment for total adiponectin had little impact on this association; the OR (95% CI) was 1.10 (0.57–2.12) (P for trend = 0.41).
TABLE 3.
ORs (95% CIs) of type 2 diabetes by quintiles of fetuin-A levels: the Nurses’ Health Study

We did not find evidence suggesting any nonlinear relationship between fetuin-A levels and diabetes risk; P for nonlinearity was 0.52. Figure 1 demonstrates a dose-response relationship based on the results of the cubic spline regression. Given the likely linear association, we further estimated that for every 100 µg/mL increment of fetuin-A levels, the OR (95% CI) of type 2 diabetes was 1.27 (1.10–1.47).
FIG. 1.

OR of type 2 diabetes (95% CI) by levels of fetuin-A. Study participants with the lowest and highest 1% of fetuin-A were excluded to minimize the potential impact of outliers. Multivariate logistic regression models were adjusted for the same set of covariates for model 3 in Table 3. In this analysis, a linear relationship between plasma levels of fetuin-A and diabetes was not assumed. Bold lines are ORs and thin lines are 95% CIs. The horizontal line is the reference line. A: y-axis on a regular scale. B: y-axis on a natural logarithm scale.
ALT and GGT both were associated with an increased risk of type 2 diabetes: after adjusting for the covariates included in model 2 of Table 2, ORs (95% CIs) comparing extreme quintiles were 2.42 (1.45–4.04) (P for trend < 0.0001) for ALT and 4.84 (2.56–9.17) (P for trend < 0.0001) for GGT. After the same multivariate adjustment, we did not detect significant interactions on the multiplicative scale between fetuin-A levels and ALT/GGT levels (P values for interaction were 0.91 for ALT and 0.58 for GGT). A joint analysis of fetuin-A and these liver enzymes demonstrated a strong positive association with diabetes risk when both fetuin-A and GGT levels were high (Supplementary Fig. 1), indicating that the positive associations of both markers with diabetes risk were simply additive to each other. Compared with women in the lowest tertiles of both fetuin-A and GGT levels, women with both markers in the highest tertiles had an OR (95% CI) of 5.70 (2.51–12.95), and these values were 3.16 (1.66–5.99) for the same joint association between fetuin-A and ALT levels.
We conducted several sensitivity analyses to examine the robustness of our observations. When we restricted the analysis to participants with HbA1c levels less than 6.5% at baseline (90.5% of total participants), we found a similar association: the OR (95% CI) comparing extreme quintiles of fetuin-A was 1.86 (1.07–3.23) (P for trend = 0.01). Further restricting the analysis to participants with HbA1c levels less than 5.7% (51.7% of total participants) generated somewhat stronger results, although the association did not reach significance because of diminished power: the OR (95% CI) was 2.23 (0.88–5.66) (P for trend = 0.14). When we repeated the analysis among participants with GGT levels less than 51 IU/L (88.0% of total participants), we observed a slightly attenuated association: the OR (95% CI) comparing extreme quintiles of fetuin-A was 1.77 (1.01–3.13) (P for trend = 0.04). To evaluate whether the association of fetuin-A with diabetes risk persisted throughout the 6 years of follow-up, we examined this association within the first and second 3 years of follow-up, respectively. In this analysis, to generate stable estimates, we examined fetuin-A tertiles. Results showed that the associations were similar in these two periods (P for interaction between fetuin-A and time = 0.22): in the first 3 years of follow-up, the OR (95% CI) comparing extreme tertiles was 1.81 (0.81–4.03) (P for trend = 0.10); in the second half of follow-up period, these values were 1.75 (1.09–2.81) (P for trend = 0.03).
In a secondary analysis, when we used a random effects model to pool our results with those of three previous prospective studies (16–18), we observed remarkably consistent results across all four studies. The pooled OR (95% CI) was 1.69 (1.39–2.05) (I2 = 0.0%; P for heterogeneity = 0.45) comparing high versus low fetuin-A levels (Supplementary Fig. 2). In this analysis, we included relative risks estimated from the fully adjusted multivariate model (Supplementary Table 1) in each study except that of Stefan et al. (17), in which only age was adjusted for when modeling the association for quintiles of plasma fetuin-A levels. Detailed characteristics of these studies are listed in Supplementary Table 1 as well.
DISCUSSION
In this prospective study among women, we found a positive association between plasma fetuin-A levels and risk of type 2 diabetes, which was independent of liver enzymes and of other established risk factors for diabetes. Each 100 µg/mL increment in fetuin-A level was associated with a 27% increased risk of type 2 diabetes. Liver enzyme levels did not modify the association of fetuin-A with diabetes risk on the multiplicative scale.
The function of fetuin-A was first revealed through in vitro experiments that characterized fetuin-A as an antagonist of insulin’s actions by inhibiting insulin receptor tyrosine kinase activity (10,11,31). Fetuin-A knockout mouse models consistently demonstrated increased phosphorylation of insulin receptor and downstream signaling, improved insulin sensitivity, and resistance to weight gain induced by a high-fat diet or biological aging (12,13). Cross-sectional studies of humans have not consistently shown a positive relationship between fetuin-A levels and insulin resistance (14,15,20,32–36). The only available longitudinal study clearly showed that high baseline fetuin-A levels were prospectively associated with less improved insulin sensitivity after weight reduction (20). Consistent with data from animal experiments and prospective human studies, our analysis demonstrated a positive correlation between fetuin-A and fasting insulin levels (r = 0.18), which partially explained the positive association of fetuin-A with diabetes risk. Of note, fetuin-A also may be causally involved in tissue calcification (8,9), although the role of such a function in the etiology of type 2 diabetes remains unclear.
Thus far, three previous prospective studies have been conducted to evaluate fetuin-A levels in relation to risk of developing type 2 diabetes. In the European Prospective Investigation into Cancer and Nutrition–Potsdam study consisting of 2,867 men and women aged 35–65 years, a significant linear dose-response relationship between fetuin-A levels and type 2 diabetes risk was found (17). In 541 ethnically diverse men and women aged 70–79 years who participated in the Health, Aging, and Body Composition study, baseline fetuin-A levels were associated with more than a twofold increased risk of type 2 diabetes (16). More recently, in the Cardiovascular Health Study consisting of 3,710 men and women at aged 65 years or older, fetuin-A levels also were associated with an increased risk of type 2 diabetes (18). Despite the notable difference in study design, method of fetuin-A assays, and characteristics of participants including age, sex, and ethnicity, the current analysis and these three studies demonstrated highly consistent associations for fetuin-A. In our meta-analysis of all four studies, the pooled OR (95% CI) was 1.69 (1.39–2.05) (I2 = 0.0%; P for heterogeneity = 0.45) comparing high versus low fetuin-A levels.
Few studies have examined the role of NAFLD in the association between fetuin-A and diabetes risk. Interestingly, both this analysis (r = 0.003 ∼ 0.03) and the European Prospective Investigation into Cancer and Nutrition–Potsdam study (r = 0.06) suggested that the correlation between fetuin-A and liver enzymes was at most moderate in the general population, although among subjects with possible insulin resistance, fetuin-A levels may be more strongly correlated with liver enzyme levels or liver fat content (20). Nonetheless, prospective data are needed to elucidate whether high fetuin-A levels lead to subsequent fat accumulation in the liver. We found that the association of fetuin-A with diabetes was independent of liver enzyme levels, suggesting that fetuin-A and NAFLD may increase diabetes risk through different mechanisms.
Limitations of this investigation warrant consideration. First, our study participants primarily consisted of white female nurses. Because fetuin-A levels may vary across different ethnic groups (16), it is unknown whether our results can be generalized to men and to other ethnicities. In addition, because the fetuin-A assay has not been standardized, absolute fetuin-A levels may not be comparable among different studies, further limiting the generalizability. Nonetheless, the results from the three prospective studies are highly consistent. Second, measurement error in the fetuin-A assay (intra-assay CV of 13.1%) may introduce random variation that likely attenuates the true association. In addition, baseline fetuin-A measurement may not necessarily represent biologically relevant, long-term values, and this source of measurement error may further attenuate the true association. However, in a random sample of 38 NHS participants, we evaluated the stability of fetuin-A levels in blood samples collected 1–2 years apart (37) and found an intraclass correlation of 0.88 (K.M. Rexrode, unpublished data; Supplementary Fig. 2), indicating that a single fetuin-A measurement may reasonably represent average levels over a few years. Third, although our validation studies have clearly demonstrated the accuracy of self-report of diabetes diagnosis, we cannot entirely exclude the possibility that some cases with underdiagnosed diabetes were excluded. However, because such under-diagnosis is unlikely related to fetuin-A levels, it would not be expected to bias the association because the numerator and denominator of the OR are multiplied by the same fraction (38). Fourth, although we controlled for a wide array of possible confounders, including lifestyle, medical history, alcohol use, diet, and CRP levels, we cannot exclude the possibility that at least some of the association still can be explained by unmeasured or residual confounding. Fifth, we used ALT and GGT as surrogate markers of NAFLD; misclassification of the severity of NAFLD cannot be excluded and may bias our interaction tests toward the null. Nonetheless, liver biopsy, the diagnostic method for NAFLD, is not feasible in large-scale epidemiologic studies (21). Last, it has been suggested that the association of fetuin-A with diabetes might be due to overnutrition (39), but this notion was not supported by our study in which the association was independent of BMI and liver enzymes. However, we did not measure plasma albumin levels and therefore could not examine whether such an association was independent of overall hepatic protein production. The strengths of this analysis include a prospective study design, rigorous quality control of laboratory procedures, use of a validated approach to confirm cases with self-reported type 2 diabetes, high follow-up rate, large sample size, and rich data, allowing comprehensive analysis.
Conclusion.
High plasma fetuin-A levels were significantly associated with an increased risk of developing type 2 diabetes among U.S. women, and this association was independent of established diabetes risk factors as well as liver enzymes. Liver enzyme levels did not modify the association for fetuin-A on the multiplicative scale. Overall, existing data from prospective studies consistently support the hypothesis that fetuin-A is an independent, novel risk factor for type 2 diabetes.
ACKNOWLEDGMENTS
This study was supported by research grants (CA87969, CA4449, DK58845, DK58785, and P30 DK46200) from the National Institutes of Health. Q.S. was supported by career development award K99HL098459 from the National Heart, Lung, and Blood Institute and a Pilot and Feasibility program sponsored by the Boston Obesity Nutrition Research Center (DK46200). The funders have no role in the design and conduct of the study; collection, management, analysis, and interpretation of the data; and preparation, review, or approval of the manuscript.
No potential conflicts of interest relevant to this article were reported.
Q.S. and F.B.H. participated in study concept and design, acquisition of data, and interpretation of results. F.B.H. participated in statistical analysis. Q.S. drafted the article, and all authors participated in critical revision and approved the final version of the manuscript. Q.S. and F.B.H. are the guarantors of this work and, as such, had full access to all of the data in the study and take responsibility for the integrity of the data and the accuracy of the data analysis.
Footnotes
This article contains Supplementary Data online at http://diabetes.diabetesjournals.org/lookup/suppl/doi:10.2337/db12-0372/-/DC1.
REFERENCES
- 1.Levine R, Haft DE. Carbohydrate homeostasis. I. N Engl J Med 1970;283:175–183 [DOI] [PubMed] [Google Scholar]
- 2.Misu H, Takamura T, Takayama H, et al. A liver-derived secretory protein, selenoprotein P, causes insulin resistance. Cell Metab 2010;12:483–495 [DOI] [PubMed] [Google Scholar]
- 3.Oike Y, Akao M, Yasunaga K, et al. Angiopoietin-related growth factor antagonizes obesity and insulin resistance. Nat Med 2005;11:400–408 [DOI] [PubMed] [Google Scholar]
- 4.Srinivas PR, Wagner AS, Reddy LV, et al. Serum alpha 2-HS-glycoprotein is an inhibitor of the human insulin receptor at the tyrosine kinase level. Mol Endocrinol 1993;7:1445–1455 [DOI] [PubMed] [Google Scholar]
- 5.Xu A, Lam MC, Chan KW, et al. Angiopoietin-like protein 4 decreases blood glucose and improves glucose tolerance but induces hyperlipidemia and hepatic steatosis in mice. Proc Natl Acad Sci U S A 2005;102:6086–6091 [DOI] [PMC free article] [PubMed] [Google Scholar]
- 6.Denecke B, Gräber S, Schäfer C, Heiss A, Wöltje M, Jahnen-Dechent W. Tissue distribution and activity testing suggest a similar but not identical function of fetuin-B and fetuin-A. Biochem J 2003;376:135–145 [DOI] [PMC free article] [PubMed] [Google Scholar]
- 7.Ix JH, Chertow GM, Shlipak MG, Brandenburg VM, Ketteler M, Whooley MA. Fetuin-A and kidney function in persons with coronary artery disease—data from the Heart and Soul Study. Nephrol Dial Transplant 2006;21:2144–2151 [DOI] [PMC free article] [PubMed] [Google Scholar]
- 8.Jahnen-Dechent W, Schinke T, Trindl A, et al. Cloning and targeted deletion of the mouse fetuin gene. J Biol Chem 1997;272:31496–31503 [DOI] [PubMed] [Google Scholar]
- 9.Schinke T, Amendt C, Trindl A, Pöschke O, Müller-Esterl W, Jahnen-Dechent W. The serum protein alpha2-HS glycoprotein/fetuin inhibits apatite formation in vitro and in mineralizing calvaria cells. A possible role in mineralization and calcium homeostasis. J Biol Chem 1996;271:20789–20796 [DOI] [PubMed] [Google Scholar]
- 10.Auberger P, Falquerho L, Contreres JO, et al. Characterization of a natural inhibitor of the insulin receptor tyrosine kinase: cDNA cloning, purification, and anti-mitogenic activity. Cell 1989;58:631–640 [DOI] [PubMed] [Google Scholar]
- 11.Rauth G, Pöschke O, Fink E, et al. The nucleotide and partial amino acid sequences of rat fetuin. Identity with the natural tyrosine kinase inhibitor of the rat insulin receptor. Eur J Biochem 1992;204:523–529 [DOI] [PubMed] [Google Scholar]
- 12.Mathews ST, Rakhade S, Zhou X, Parker GC, Coscina DV, Grunberger G. Fetuin-null mice are protected against obesity and insulin resistance associated with aging. Biochem Biophys Res Commun 2006;350:437–443 [DOI] [PubMed] [Google Scholar]
- 13.Mathews ST, Singh GP, Ranalletta M, et al. Improved insulin sensitivity and resistance to weight gain in mice null for the Ahsg gene. Diabetes 2002;51:2450–2458 [DOI] [PubMed] [Google Scholar]
- 14.Ou HY, Yang YC, Wu HT, Wu JS, Lu FH, Chang CJ. Serum fetuin-A concentrations are elevated in subjects with impaired glucose tolerance and newly diagnosed type 2 diabetes. Clin Endocrinol (Oxf) 2011;75:450–455 [DOI] [PubMed] [Google Scholar]
- 15.Song A, Xu M, Bi Y, et al. Serum fetuin-A associates with type 2 diabetes and insulin resistance in Chinese adults. PLoS One 2011;6:e19228. [DOI] [PMC free article] [PubMed] [Google Scholar]
- 16.Ix JH, Wassel CL, Kanaya AM, et al. Health ABC Study Fetuin-A and incident diabetes mellitus in older persons. JAMA 2008;300:182–188 [DOI] [PMC free article] [PubMed] [Google Scholar]
- 17.Stefan N, Fritsche A, Weikert C, et al. Plasma fetuin-A levels and the risk of type 2 diabetes. Diabetes 2008;57:2762–2767 [DOI] [PMC free article] [PubMed] [Google Scholar]
- 18.Ix JH, Biggs ML, Mukamal KJ, et al. Association of fetuin-a with incident diabetes mellitus in community-living older adults: the cardiovascular health study. Circulation 2012;125:2316–2322 [DOI] [PMC free article] [PubMed] [Google Scholar]
- 19.Fraser A, Harris R, Sattar N, Ebrahim S, Davey Smith G, Lawlor DA. Alanine aminotransferase, gamma-glutamyltransferase, and incident diabetes: the British Women’s Heart and Health Study and meta-analysis. Diabetes Care 2009;32:741–750 [DOI] [PMC free article] [PubMed] [Google Scholar]
- 20.Stefan N, Hennige AM, Staiger H, et al. Alpha2-Heremans-Schmid glycoprotein/fetuin-A is associated with insulin resistance and fat accumulation in the liver in humans. Diabetes Care 2006;29:853–857 [DOI] [PubMed] [Google Scholar]
- 21.Angulo P. Nonalcoholic fatty liver disease. N Engl J Med 2002;346:1221–1231 [DOI] [PubMed] [Google Scholar]
- 22.Prentice RL, Breslow NE. Retrospective studies and failure time models. Biometrika 1978;65:153–158 [Google Scholar]
- 23.Manson JE, Rimm EB, Stampfer MJ, et al. Physical activity and incidence of non-insulin-dependent diabetes mellitus in women. Lancet 1991;338:774–778 [DOI] [PubMed] [Google Scholar]
- 24.Field AE, Coakley EH, Must A, et al. Impact of overweight on the risk of developing common chronic diseases during a 10-year period. Arch Intern Med 2001;161:1581–1586 [DOI] [PubMed] [Google Scholar]
- 25.Willett WC, Sampson L, Stampfer MJ, et al. Reproducibility and validity of a semiquantitative food frequency questionnaire. Am J Epidemiol 1985;122:51–65 [DOI] [PubMed] [Google Scholar]
- 26.Colditz GA, Martin P, Stampfer MJ, et al. Validation of questionnaire information on risk factors and disease outcomes in a prospective cohort study of women. Am J Epidemiol 1986;123:894–900 [DOI] [PubMed] [Google Scholar]
- 27.Rimm EB, Stampfer MJ, Colditz GA, Chute CG, Litin LB, Willett WC. Validity of self-reported waist and hip circumferences in men and women. Epidemiology 1990;1:466–473 [DOI] [PubMed] [Google Scholar]
- 28.Willett W, Stampfer MJ, Bain C, et al. Cigarette smoking, relative weight, and menopause. Am J Epidemiol 1983;117:651–658 [DOI] [PubMed] [Google Scholar]
- 29.McCullough ML, Feskanich D, Stampfer MJ, et al. Diet quality and major chronic disease risk in men and women: moving toward improved dietary guidance. Am J Clin Nutr 2002;76:1261–1271 [DOI] [PubMed] [Google Scholar]
- 30.Lin DY, Fleming TR, De Gruttola V. Estimating the proportion of treatment effect explained by a surrogate marker. Stat Med 1997;16:1515–1527 [DOI] [PubMed] [Google Scholar]
- 31.Mathews ST, Srinivas PR, Leon MA, Grunberger G. Bovine fetuin is an inhibitor of insulin receptor tyrosine kinase. Life Sci 1997;61:1583–1592 [DOI] [PubMed] [Google Scholar]
- 32.Mori K, Emoto M, Yokoyama H, et al. Association of serum fetuin-A with insulin resistance in type 2 diabetic and nondiabetic subjects. Diabetes Care 2006;29:468. [DOI] [PubMed] [Google Scholar]
- 33.Xu Y, Xu M, Bi Y, et al. Serum fetuin-A is correlated with metabolic syndrome in middle-aged and elderly Chinese. Atherosclerosis 2011;216:180–186 [DOI] [PubMed] [Google Scholar]
- 34.Weikert C, Stefan N, Schulze MB, et al. Plasma fetuin-a levels and the risk of myocardial infarction and ischemic stroke. Circulation 2008;118:2555–2562 [DOI] [PubMed] [Google Scholar]
- 35.Roos M, von Eynatten M, Heemann U, Rothenbacher D, Brenner H, Breitling LP. Serum fetuin-A, cardiovascular risk factors, and six-year follow-up outcome in patients with coronary heart disease. Am J Cardiol 2010;105:1666–1672 [DOI] [PubMed] [Google Scholar]
- 36.Ix JH, Shlipak MG, Brandenburg VM, Ali S, Ketteler M, Whooley MA. Association between human fetuin-A and the metabolic syndrome: data from the Heart and Soul Study. Circulation 2006;113:1760–1767 [DOI] [PMC free article] [PubMed] [Google Scholar]
- 37.Kotsopoulos J, Tworoger SS, Campos H, et al. Reproducibility of plasma and urine biomarkers among premenopausal and postmenopausal women from the Nurses’ Health Studies. Cancer Epidemiol Biomarkers Prev 2010;19:938–946 [DOI] [PMC free article] [PubMed] [Google Scholar]
- 38.Rothman KJ, Greenland S. Modern Epidemiology. Philadelphia, Lippincott Williams & Wilkins, 1998 [Google Scholar]
- 39.Jahnen-Dechent W, Heiss A, Schäfer C, Ketteler M. Fetuin-A regulation of calcified matrix metabolism. Circ Res 2011;108:1494–1509 [DOI] [PubMed] [Google Scholar]