


Abstract
Methylation of a CpG island is a faithful marker of silencing of its associated gene. Different approaches report the methylation status of a CpG island based on the determination of one or a few CpG sites by assuming the homogeneity of methylation along the element. This strategy is frequently applied in both locus-specific and genome-wide studies, but often without a validation of the representativeness of the interrogated CpG site compared with the whole element. We have evaluated the predictive informativeness of the HpaII sites located in CpG islands using data from high-resolution methylome maps, which offer the possibility to assess the methylation homogeneity of each CpG island and to determine the reporter accuracy of single sites as surrogate markers. An excellent correlation was observed between the HpaII and CpG island methylation levels (r > 0.93). At the qualitative level, the predictive sensitivity of HpaII was >95% with >92% specificity for methylated CpG islands and >90% sensitivity with >95% specificity for unmethylated CpG islands. This analysis provides a global validation framework for strategies based on the use of the methylation-sensitive HpaII restriction enzyme.
INTRODUCTION
Epigenetic information is encoded as a heritable combination of chemical modifications of both DNA and its packaging histones (1,2). Methylation of the cytosine base within the CpG dinucleotide is the main epigenetic modification of the DNA in mammals (3,4). Most of the human genome is CpG depleted. However, this dinucleotide can be found at close to its expected frequency in small genomic regions (200 bp to a few kb) known as CpG islands (5,6). These areas are usually ‘protected’ from methylation and are located in the proximal promoter regions of 75% of human genes (3,4,7). Methylated CpG islands are strongly and hereditably repressed (4). Therefore, DNA methylation has been considered as a mark for long-term inactivation (4,8,9). DNA methylation patterns are characteristic of developmental stages and cell differentiation and are also intrinsically associated with multiple pathologies, being cancer a prominent example (3,10–12).
The epigenomic landscape varies markedly across tissue types and between individuals (13,14). Hence, there is not a single reference map, what represents an extraordinary challenge not only for experiment design but also for data management, analysis and interpretation. A considerable effort has been made in the last years to obtain genome-scale maps of DNA methylation and other epigenetic marks in different cell types (15–17). Ambitious initiatives, i.e. the NIH Roadmap Epigenomics Mapping Consortium (www.roadmapepigenomics.org), the Human Epigenome Project (www.epigenome.org) and the Blueprint project (http://www.blueprint-epigenome.eu) are addressed to map DNA methylation, histone modifications and other chromatin features in different cell and tissue types.
A large number of methodologies have been developed for the analysis of DNA methylation at different genomic scales (reviewed in (3,11,18,19)). All data generated until now have been obtained using techniques based on one of these three principles: methylation-sensitive endonucleases, bisulfite conversion or purification of methylated DNA by affinity/specific antibodies (18). Besides direct sequencing of bisulfite converted DNA, which is probably the reference method (20), an extraordinary cornucopia of techniques has found a niche in the Epigenetics labs. This is due to the relatively homogeneous distribution of DNA methylation (or unmethylation) within definite genomic elements. Prominent examples are CpG islands and repeat sequences in which most CpG sites within the element show similar levels of DNA methylation. This uniformity allows the extrapolation of the analysis of a single site or a few sites to the whole CpG island or repeat element. In the foremost studies, this property was instrumental to reveal the global alterations of DNA methylation profiles in cancer cells (21,22). Still nowadays, the analysis of a single CpG site or a few CpG sites as surrogate indicators of the DNA methylation status of the corresponding element is the most prevalent strategy in epigenetic studies at different scales. These approaches are based on either the enzymatic digestion using specific restriction endonucleases or the bisulfite transformation and offer the advantage of high throughput, high sensitivity and relative simplicity of data analysis (18,23).
Most of the studies that use surrogate markers perform some kind of validation and make a global estimation of technique's accuracy. On the other hand, the post-hoc analysis of massive data rarely includes the recognition of bona fide and counterfeit sites which precludes the direct comparison of data generated with different approaches beyond the small subset of elements validated independently. Recent advances in sequencing methods and the development of bioinformatic tools have allowed the generation of single-base resolution maps of human methylomes (24–30). The generation of these high-resolution DNA methylation maps for different cell types, including pathological situations, is likely to represent a milestone in epigenetic studies of similar impact as the sequencing of the human genome. However, an indiscriminate application of such approaches to most DNA methylation studies is nowadays unfeasible.
Assuming that bisulfite sequencing is today's gold standard in DNA methylation analysis and using published results at the genome scale (25,26) as the reference map, we have examined the accuracy of using single CpG sites as surrogate markers for the predefined CpG islands. For pragmatic reasons we report here the analysis of the CpG within the HpaII (CCGG) restriction site, frequently used in genome-scale approaches (11,18). However, other sites may be easily analysed in the same way with our pipeline.
MATERIALS AND METHODS
DNA methylation data acquisition
Data were obtained from two studies, both whole-genome single-base resolution measurements of the methylation by high-throughput bisulfite sequencing. Together they provide data from H1 human embryonic stem cells, IMR90 fetal lung fibroblasts, ADS female adipose stem cells (ADSC) and adipocytes derived from ADSC (ADS-Adi) (25,26). These studies generated 1.16, 1.18, 1.10 and 1.13 billion reads for H1, IMR90, ADSC and ADS-Adi, respectively (ADSC and ADS-Adi reported reads were originally paired-end reads but they were uncoupled and treated as single reads in this analysis). The HpaII-CpG island methylation correlation was also analysed in cell lines: iPSC derived from ADSC (ADS-iPSC), three iPSC lines derived from foreskin fibroblasts (FF-iPSC 6.9, FF-iPSC 19.7, FF-iPSC 19.11), H9 human embryonic stem cells and iPSC derived from IMR90 fibroblasts (IMR90-iPSC) (26). All reads were aligned to the human reference sequence (NCBI build 36/hg18) using the Bowtie program (31). Reads were downloaded from http://neomorph.salk.edu/human_methylome/data.html (H1 and IMR90) and http://neomorph.salk.edu/ips_methylomes/data.html (rest of cell lines), processed to be SAM-like, transformed to the BAM format and indexed using the C++ program SAMTOOLS (32).
The genomic coordinates of the CpG islands (defined according classical criteria (5): GC content of 50% or greater, length >200 bp, and a ratio >0.6 of observed number of CpG dinucleotides to the expected number) and the human genome sequence were downloaded from the UCSC Genome Browser, version hg18 (33). Additional analyses were also performed using CpG islands annotated using experimental (34) and bioinformatic criteria (35). Only reads overlapping fully or partially with these positions were considered (Supplementary Table S1). HpaII positions and CpG islands sequences were obtained by processing the human genome with Perl scripts. Each HpaII was assigned to the corresponding CpG island using the ‘intersectBed’ function from BEDTOOLS suite (36). A scheme of the data acquisition and processing is shown in Supplementary Figure 1A.
Methylation coefficient calculation
The methylation coefficient was calculated for CpG islands (ßC) and HpaII restriction sites (ßH) using a Python script (available from the authors upon request). In the sequence reads, unmethylated cytosines are visualized as thymines (T) due to the bisulfite conversion whereas methylated cytosines remain untransformed (C). Hence, the coefficient was defined as the ratio between the number of cytosines and the total number of cytosines and thymines (no. of C / (no. of C + no. of T) (Supplementary Figure 1B). This definition is equivalent to the ß value used in methylation arrays (37) and ranges from 0 (no methylation) to 1 (fully unmethylated). The CpG dinucleotide includes two cytosines, each one on one strand, and reads can cover differently each of them (i.e. if all reads covering a CpG are 5′ to 3′, only information of one cytosine is provided). For that reason, each cytosine within a CpG dinucleotide was processed as an individual genomic position and a methylation coefficient was assigned to it. Our Python script firstly scans each CpG island sequence for CG motif. Once found, it assigns the corresponding nucleotides for that position using the python library pysam and according to reads already indexed (Supplementary Figure S1) and taking into account both Watson and Crick DNA strands. Positions with <5 reads were discarded as they were considered not informative enough. In order to use only positions with trustable methylation information, an additional filter was added: positions with <5 C + T were also discarded. With these filters we obtain the same coverage as reported in a previous analysis (23). Mean and standard deviation (SD) values were obtained for each CpG island taking into account only the valid positions. Only CpG islands with a minimum of informativeness (>25% CpG sites covered by at least 5 reads each) were considered, what resulted in a minimum of 10 693 informative CpG islands for the H1 cell line and more than 26 000 for the ADS-Adi samples (Supplementary Table S1). The total number of HpaII sites included in the analysis ranged from 32 153 for the H1 cells to more than 250 000 in ADS-Adi (Supplementary Table S1). A second analysis was also performed for all CpG islands covered with at least one informative position to check for the robustness of the reporter informativeness when limited coverage is obtained. When the informativeness restrictions were eliminated, more than 21 000 CpG islands contained at least one HpaII site covered by at least 5 reads (Supplementary Table S1). It is worth to note that the numeric differences between the pairs H1/IMR90 and ADSC/ADS-Adi are caused by the different read coverage between the two studies. Scripts are available upon request.
A number of CpG islands contained more than one HpaII site in the analysed sequence (Supplementary Table S1). In these cases, the mean methylation value of all the HpaII sites was calculated. The reporter value of individual and mean ßH was calculated as the difference with the respective CpG island methylation value.
A randomized set of data was generated to evaluate possible biases due to the bimodal distribution of methylation. A virtual catalog of CpG islands matching the same size and coverage of the ones included in the study was generated and the valid CpG sites methylation coefficient values were randomly distributed along the CpG islands and used to calculate the corresponding ßC. Hypothetical HpaII sites were randomly chosen matching the actual distribution. The simulation was done with H1 and IMR90 datasets.
Data analysis
The methylation value for the CpG island and HpaII sites together with structural and descriptive information like genomic coordinates or O/E ratio was stored in a mySQL Database to allow rapid retrieval and the easy establishment of relationships (Supplementary Figure S1). Scripts are available upon request. Graphs and derived calculations were generated using the statistical software R. The jitter mode was used in scatter plots with large datasets to improve dot visualization. The complete analysis was performed with the subset of CpG islands with high coverage (Supplementary Table S1) and all the CpG islands represented by at least one sequence read. Most analyses produced identical or very similar results when the filtered (high coverage) or the unfiltered sets were used. For simplicity, only data generated using the filtered set are shown here, except for those cases in which different distributions were observed (Supplementary Figure S2).
RESULTS
Characterization of CpG island DNA methylation internal heterogeneity
The ßC showed a bimodal distribution with most values near 0 (fully unmethylated) or 1 (fully methylated) with some intermediate values (Supplementary Figure S2), and confirming the enrichment for methylated CpG islands in the H1 cells as compared with the other cell lines as reported (25). Interestingly, this difference disappears when all CpG islands with at least one sequence read were included in the analysis (Supplementary Figure S2). This indicates a methylation dependent bias in the coverage of CpG islands in the H1 sample as methylated CpG islands are better covered than unmethylated ones.
CpG island methylation heterogeneity was represented as the SD of the methylation coefficient among the CpG dinucleotides contained in a CpG island (Figure 1). As a whole, the greatest variability was observed for a small population of CpG islands with intermediate methylation values indicating alternative methylation status of individual CpG positions rather than a homogeneous intermediate methylation level of the CpG sites. Next, we explored the distribution of variability according to the methylation levels. As expected, methylated CpG islands exhibited the lowest levels of internal variability (Supplementary Figure S3). Surprisingly, unmethylated CpG islands exhibited high homogeneity in H1 cells but a broader distribution in the rest of samples, indicating a more relaxed methylation profile. Intermediately methylated CpG islands exhibited higher levels of internal variability, but once again, H1 cells showed less variability (Supplementary Figure S3). Together, these results indicate a high homogeneity in the methylation profiles of methylated CpG islands. Highly unmethylated and, especially, intermediately methylated CpG islands exhibit different levels of heterogeneity, which might suggest that, for a small number of CpG islands, individual CpG sites may not be representative of the global profile.
Figure 1.

Homogeneity of CpG methylation in CpG islands. The mean of all informative CpG sites located inside each CpG island (CpG island methylation coefficient, ßC) is plotted against the SD for four of the cell lines analysed in this study. Vertical dash lines delimit graph areas containing unmethylated (ßC mean <0.25) and methylated (ßC mean >0.75) CpG islands. The numbers of points represented in each area of the graph and the distribution histograms of both axes are shown. Illustrative DNA methylation profiles of CpG islands represented in each area are displayed using lollipop diagrams, in which empty dots represent unmethylated CpG sites, whereas gray-filled dots represent partially methylated sites and black-filled dots fully methylated sites. Only CpG islands with high coverage are displayed.
HpaII site DNA methylation as a proxy of CpG island methylation
To evaluate the predictive value of individual CpG sites contained within a CpG island, the HpaII restriction site was selected (CCGG) as this enzyme is used by multiple locus-specific and genome-scale techniques. A total of 32 153, 77 417, 249 053 and 251 516 HpaII sites located inside the preselected CpG islands (Supplementary Table S1) were informative in H1, IMR90, ADSC and ADS-Adi cells, respectively. The symmetrical DNA methylation of HpaII sites was confirmed by comparing the methylation coefficient of both strands calculated separately (data not shown). Only HpaII sites with five or more informative reads in at least one strand were considered to have high coverage and included in the analysis.
At global scale, an excellent correlation existed between the ßH and that of its corresponding CpG island (H1, r = 0.96, P < 10−15; IMR90, r = 0.93, P < 10−15; ADSC, r = 0.94, P < 10−15; ADS-Adi, r = 0.94, P < 10−15) (Figure 2). For the rest of cell lines a high correlation was also observed (r > 0.94, Supplementary Figure S4). Further analysis of the data revealed that, in methylated CpG islands, HpaII sites tend to be hypermethylated (differential methylation coefficient <0) as compared with the global methylation coefficient of the respective CpG island in all the cell lines analysed (Figure 3). In unmethylated and intermediately methylated CpG islands no biases were observed.
Figure 2.

Correlation plots for the methylation coefficient between the HpaII and the corresponding CpG island for H1, IMR90, ADS-Adi and ADSC samples. Dash lines delimit areas with differences >0.25 between the HpaII site and the corresponding CpG island. The numbers of points represented in each area of the graph and the distribution histograms of both axes are shown. Upper panels show correlation for individual HpaII sites with the respective CpG island, lower panels depict the same correlations but comparing the mean of all HpaII sites in any given CpG island. The number of informative CpG islands for each cell line is shown in Supplementary Table S1. Plots representing additional samples and alternative CpG island definitions are shown in Supplementary Figures S4 and S5, respectively.
Figure 3.
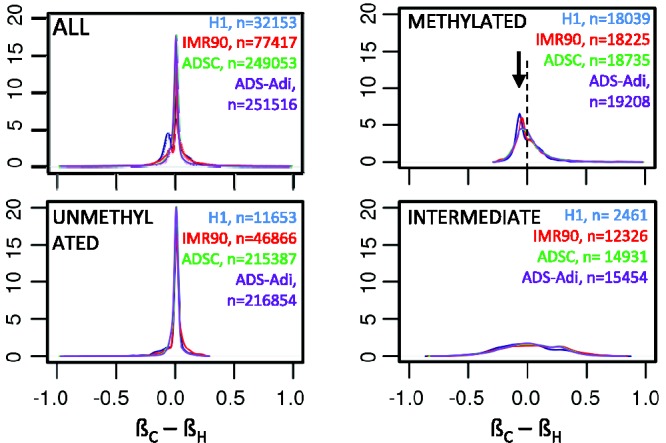
Density plot of the difference between the CpG island methylation coefficient and the respective HpaII methylation coefficient. A bimodal distribution was observed in H1 cells (blue) suggesting that a subpopulation of HpaII sites tend to be hypermethylated as compared with the referenced CpG island. Further exploration of the distribution according to the methylation state of the CpG island (METHYLATED, UNMETHYLATED and INTERMEDIATE) revealed a slight hypermethylation of the HpaII site (as compared with the respective CpG island) in methylated CpG islands (METHYLATED, see arrowhead).
We have applied this analysis to the CpG islands annotated in the UCSC genome browser, as it represents a referential source of genomic information. Nevertheless, other studies have proposed new methods and criteria to define CpG islands. We have considered two of these studies, one based on the experimental capture of CpG islands (34) and the other on the application of hidden Markov models (35). In both cases, the high correlation was maintained (Supplementary Figure S5). Noteworthy, CpG islands identified experimentally (34) but not annotated in the UCSC showed a similar correlation even the proportion of methylated CpG islands was higher in the newly identified CpG islands than those overlapping with the classical definition (Supplementary Figure S5).
As most studies on DNA methylation report data as binary marks (methylated/unmethylated), a qualitative evaluation of the predictive value of HpaII sites was made. A Receiver Operating Characteristic (ROC) curve analysis was performed to ascertain the optimal cutoff points and accuracy (Supplementary Figure S6). In all cases the area under the curve was above 0.95. The ßH cutoff point for the methylated CpG islands (ßC > 0.75) ranged from ≥0.40 to ≥0.67 (Supplementary Figure S6). The ßH cutoff point for the unmethylated CpG islands (ßC < 0.25) ranged from <0.34 to <0.12. Sensitivity and specificity were ≥90% in all cases (Supplementary Figure S6). An additional evaluation was performed in which matching or unmatching scores were set when the absolute difference between the two coefficients (|ßC – ßH|) was over 0.25. Under this arbitrary criterion, 5.2% (1169 out of 32 153), 8.3% (6455 out of 77 417), 3.13% (7802 out of 249 053) and 3.01% (7575 out of 251 516) of the HpaII sites showed discordant results for H1, IMR90, ADSC and ADS-Adi cells, respectively (Figure 2). When the absolute difference value determining discordance was set to >0.5, the proportion of unmatching data was reduced to 0.9% (300 out of 32 153), 1.3% (1034 out of 77 417), 0.52% (1288 out of 249 053) and 0.50% (1249 out of 251 516), respectively.
Besides the low proportion of discordant sites, a high recurrence was observed, especially in the samples with high coverage (Supplementary Figure S7). For instance, the comparison of 3 samples showed an overlapping of 42% for 2 or more samples and of 16% for the 3 samples (absolute difference >0.25). This represents an extraordinary enrichment, as the total number of informative HpaII sites was above 250 000 and the number of discordant sites per sample is about 3%, which implies that if discordance was randomly distributed, we would expect about 7 HpaII sites to discordant in the 3 samples, in front of the 2268 observed.
A randomization of CpG sites among all CpG islands (see Materials and Methods) showed no correlation between the hypothetical HpaII sites and the corresponding CpG island (r = 0.30 and r = 0.22 with data from H1 and IMR90, respectively), demonstrating that the observed correlation is not explained by the bimodal distribution of DNA methylation levels (Suppementary Figure S8).
In those CpG islands with more than one informative HpaII site, the accuracy in the prediction of ßC was improved by using the average of all the HpaII sites instead of a single one. As expected, mean ßH exhibited a better correlation with CpG island methylation (r > 0.98, Figure 2 lower panels) and the difference between actual ßC and individual ßH was dramatically reduced when the mean HpaII methylation was used (Figure 4). At the qualitative level the discordant points were reduced to 1.8, 2.7, 0.95 and 0.89% in H1, IMR90, ADSC and ADS-Adi cells, respectively (discordant points are those with differences in the methylation coefficient above 0.25). These figures were 0.2, 0.1, 0.05 and 0.04% when the difference was set to >0.5.
Figure 4.

Improvement in the predictive value of HpaII methylation coefficient when using the mean methylation of all HpaII sites within a CpG island. The difference between the CpG island and the HpaII site methylation (X axis) exhibits a wider distribution as compared with the use of the mean of all HpaII sites (Y axis) contained in the CpG island (see Supplementary Table S1 for the distribution of HpaII in the CpG islands analysed in this study).
As a whole, these results indicate that measurement of DNA methylation in HpaII sites (individually or pooled) is a good surrogate of the methylation state of the CpG island, especially when more than one site is used per CpG island.
Features of discordant sites
To get insights into the putative determinants of the atypical methylation in discordant HpaII sites (those points with an absolute difference between the ßC and the ßH > 0.25) we explored some genomic features (distance from the HpaII to the nearest extreme of the CpG island, CpG island length, total number of CpG positions in the CpG island and Observed versus Expected CG ratio of the CpG island) of these sites separately for hypermethylated and hypomethylated HpaII sites as compared with the respective CpG island (Supplementary Figure S9). No major differences were observed in the distribution of these features, with the exception of a slight increase of discordant sites (both hypo and hypermethylated) in larger CpG islands (Supplementary Figure S9), especially in H1 cells.
Finally, we analysed the possible occurrence of single-nucleotide polymorphisms (SNPs) affecting the CpG dinucleotide in the HpaII site that could explain some discrepancies. SNP data were obtained from the dbSNP build 135 at ftp.ncbi.nih.gov/snp. About 3% of all HpaII sites may contain polymorphisms affecting the detection of methylation. Discordant HpaII sites exhibited a highly significant enrichment of SNPs (up to 9%) as compared with concordant sites (Supplementary Table S2), which suggests that a fraction of the discordances may be due to genetic variation.
DISCUSSION
Bisulfite sequencing is considered the gold standard in DNA methylation analysis but it is a cumbersome procedure. The reading of electropherograms is an intricate task not free of subjective interpretations and technical biases (38,39). Hence, the use of alternative approaches relying on the determination of one or a few CpG sites has been a common detour in a large number of studies reporting differential methylation of CpG islands. Methylation-specific PCR (MSP) is probably the most employed alternative method in targeted studies whereas in genome-wide studies, methylation-sensitive restriction enzymes and specific probes for the methylated/unmethylated sequence are frequently used (11,18). Each method has specific advantages and disadvantages and can be more or less suitable depending on the application. The features of the different methods and their performance in relation to different parameters (i.e. amount of material required, resolution, quantitativeness, genomic coverage, computational cost, etc.) have been addressed in detail elsewhere (11,18,23,40–44).
In the last couple of years, a few studies have performed whole-genome shotgun bisulfite sequencing (WGSBS) of a reduced number of human samples (24–30) providing an excellent framework to inquire the appropriateness of other reduced complexity approaches from a theoretical (23) and a practical (44,45) point of view. Here we have analysed the concordance of HpaII site methylation with that of the inclusive CpG island using data from two WGSBS studies in human samples (25,26). The choice of HpaII was obvious as it is present in 94% of CpG islands in the human genome and together with SmaI (CCCGGG), that includes the HpaII site (CCGG), is the most widely used methylation-sensitive restriction enzyme for DNA methylation studies (18,45,46). Moreover, we cannot elude historical reasons as this site was instrumental in the discovery and initial characterization of CpG islands originally recognized as HpaII Tiny Fragment (HTF) islands (47,48).
In our analysis of Lister data, the methylation of HpaII sites embedded in CpG islands appears as an excellent reporter of the overall methylation of the CpG island, in agreement with other studies using different strategies (45). Beyond the quantitative correlation, it is important to note that at the qualitative level (the most usual way to report DNA methylation states), HpaII exhibited a very high predictive value that was extremely accurate in CpG islands containing two or more HpaII sites. The high correlation appears to be independent of the global methylation levels, that were quite different among samples, and tissue type. Moreover it is preserved in CpG islands defined by alternative criteria (34,35) and not included in the list of the UCSC genome browser (Supplementary Figure S5). Noteworthy, our analysis also shows that a higher proportion of the CpG islands defined by alternative criteria are methylated as compared with the annotated in UCSC genome browser (Supplementary Figure S5, vertical histograms). This is consistent with the enrichment of differentially methylated regions (DMRs) in these CpG islands (35,49). Moreover, most of DMRs in colon cancer cells (50) overlap with CpG islands defined using hidden Markov models (35), which expands the applicability of this approach.
A limitation in the use of HpaII is that not all CpG islands are represented. In the human genome, 1718 out of 28 226 (6.1%) human CpG islands do not contain a HpaII site. Nevertheless, achieving a similar coverage by WGSBS represents an extraordinary challenge as the one faced in Lister et al. (25,26), that limits the application of this kind of approach to reduced sets of samples. Other biases as base composition and size of the fragments should be also considered in the massive application of approaches based on HpaII, but these issues have been already addressed in other studies that have demonstrated that they have a minimal impact on the results (45). When we analysed different features of the CpG islands, no major bias that could affect the representativeness of the HpaII was observed, maybe with the exception of the H1 cells, in which discordant sites tended to be more frequent in longer CpG islands with a high number of CpGs (Supplementary Figure S9). This bias was not associated with the position of the HpaII site within the CpG island (near or far from the edge). We may speculate that many of those discrepancies could be due to the relative abundance of 5-hydroxymethylcytosine (5hmC) in the promoter regions of developmentally regulated genes in embryonic stem cells (51). 5hmC, that cannot be distinguished from methylated cytosine by bisulfite sequencing, is considered to be a transitional state in active demethylation (reviewed in (52)) and hence, it is more likely to confer a heterogeneous methylation profile to the CpG island. Noteworthy, the methylation level of the HpaII site appears to exaggerate the methylation state of the CpG island in methylated CpG islands (Figure 3), whereas in unmethylated CpG islands no bias was observed. This subtle overestimation of methylation is no longer observed when the mean of all HpaII sites is used (data not shown).
The procedure used by us is not limited to strategies based on restriction enzymes but it may be also applied for the design of reduced complexity strategies. In example, information about the representativeness of each CpG site in regard to the respective genomic element may help in the design and selection of specific probes to analyse DNA methylation using hybridization microarrays with bisulfite transformed DNA (i.e. the Infinium platform from Illumina).
In this report we have limited the analysis to CpG islands as they constitute distinct genomic elements with an important and definite functional role in gene regulation. On the other hand, HpaII sites are also frequent outside CpG islands, implying that other genomic elements may be also analysed using similar strategies provided they exhibit homogeneous methylation profiles. One example could be CpG island shores. Currently, CpG island shores are defined as regions within 2000 bp but not inside CpG island (50). In cell differentiation and cancer the methylation profiles of CpG island shores appear to be more plastic than in CpG islands (49,50), becoming a preferential target of genome-wide studies. The availability of new methylomes for different cell types should allow the evaluation of new surrogate markers amenable for other genomic elements beyond CpG islands. In turn, homogeneity of DNA methylation profiles along genomic regions may contribute to define previously unrecognized epigenetic domains as putative functional elements. Cancer cells may represent a preferential target for this type of studies, but the pervasive cell heterogeneity of most tumors involves an additional level of difficulty in the analysis and interpretation of partial methylation. In this case, concordance of CpG methylation in CpG sites within the same read may coexists with methylation heterogeneity between reads, what most probably should be interpreted as an indicator of cell heterogeneity.
In summary, our analysis provides a global validation of strategies based on the use of the methylation-sensitive restriction enzyme HpaII. This validation can be extended to other similar reduced complexity approaches. Besides the high informativeness and coverage offering these alternative approaches, their principal advantage is the drastic reduction in costs not only in expenses associated with data generation (wet lab experiments) but also in computational analysis (18,53–55). The systematic application of reduced complexity methods in combination with microarrays or next-generation sequencing in studies that are not intended to obtain full methylomes will thrust the generation of epigenomic maps with an excellent benefit-cost ratio.
SUPPLEMENTARY DATA
Supplementary Data are available at NAR Online: Supplementary Tables 1 and 2 and Supplementary Figures 1–9.
FUNDING
PFIS fellowship from Fondo de Investigación Sanitaria [FIS to V.B.]; Spanish Ministry of Science and Innovation [SAF2008/1409, SAF2011/23638 and CSD2006/49]; Generalitat de Catalunya [2009 SGR 1356]. Funding for open access charge: Spanish Ministry of Science and Innovation [SAF2011/23638].
Conflict of interest statement. None declared.
Supplementary Material
ACKNOWLEDGEMENTS
We thank Mireia Jordà, Sergi Lois and Anna Díez for helpful discussions and advice.
REFERENCES
- 1.Bernstein BE, Meissner A, Lander ES. The mammalian epigenome. Cell. 2007;128:669–681. doi: 10.1016/j.cell.2007.01.033. [DOI] [PubMed] [Google Scholar]
- 2.Kouzarides T. Chromatin modifications and their function. Cell. 2007;128:693–705. doi: 10.1016/j.cell.2007.02.005. [DOI] [PubMed] [Google Scholar]
- 3.Suzuki MM, Bird A. DNA methylation landscapes: provocative insights from epigenomics. Nat. Rev. Genet. 2008;9:465–476. doi: 10.1038/nrg2341. [DOI] [PubMed] [Google Scholar]
- 4.Goll MG, Bestor TH. Eukaryotic cytosine methyltransferases. Annu. Rev. Biochem. 2005;74:481–514. doi: 10.1146/annurev.biochem.74.010904.153721. [DOI] [PubMed] [Google Scholar]
- 5.Gardiner-Garden M, Frommer M. CpG islands in vertebrate genomes. J. Mol. Biol. 1987;196:261–282. doi: 10.1016/0022-2836(87)90689-9. [DOI] [PubMed] [Google Scholar]
- 6.Takai D, Jones PA. Comprehensive analysis of CpG islands in human chromosomes 21 and 22. Proc. Natl Acad. Sci. USA. 2002;99:3740–3745. doi: 10.1073/pnas.052410099. [DOI] [PMC free article] [PubMed] [Google Scholar]
- 7.Fazzari MJ, Greally JM. Epigenomics: beyond CpG islands. Nat. Rev. Genet. 2004;5:446–455. doi: 10.1038/nrg1349. [DOI] [PubMed] [Google Scholar]
- 8.Jaenisch R, Bird A. Epigenetic regulation of gene expression: how the genome integrates intrinsic and environmental signals. Nat. Genet. 2003;33:245–254. doi: 10.1038/ng1089. [DOI] [PubMed] [Google Scholar]
- 9.Yoder JA, Walsh CP, Bestor TH. Cytosine methylation and the ecology of intragenomic parasites. Trends Genet. 1997;13:335–340. doi: 10.1016/s0168-9525(97)01181-5. [DOI] [PubMed] [Google Scholar]
- 10.Feinberg AP, Tycko B. The history of cancer epigenetics. Nat. Rev. Cancer. 2004;4:143–153. doi: 10.1038/nrc1279. [DOI] [PubMed] [Google Scholar]
- 11.Esteller M. Cancer epigenomics: DNA methylomes and histone-modification maps. Nat. Rev. Genet. 2007;8:286–298. doi: 10.1038/nrg2005. [DOI] [PubMed] [Google Scholar]
- 12.Jones PA, Baylin SB. The epigenomics of cancer. Cell. 2007;128:683–692. doi: 10.1016/j.cell.2007.01.029. [DOI] [PMC free article] [PubMed] [Google Scholar]
- 13.Bernstein BE, Stamatoyannopoulos JA, Costello JF, Ren B, Milosavljevic A, Meissner A, Kellis M, Marra MA, Beaudet AL, Ecker JR, et al. The NIH roadmap epigenomics mapping consortium. Nat. Biotechnol. 2010;28:1045–1048. doi: 10.1038/nbt1010-1045. [DOI] [PMC free article] [PubMed] [Google Scholar]
- 14.Feinberg AP. Phenotypic plasticity and the epigenetics of human disease. Nature. 2007;447:433–440. doi: 10.1038/nature05919. [DOI] [PubMed] [Google Scholar]
- 15.Milosavljevic A. Emerging patterns of epigenomic variation. Trends Genet. 2011;27:242–250. doi: 10.1016/j.tig.2011.03.001. [DOI] [PMC free article] [PubMed] [Google Scholar]
- 16.Beck S, Rakyan VK. The methylome: approaches for global DNA methylation profiling. Trends Genet. 2008;24:231–237. doi: 10.1016/j.tig.2008.01.006. [DOI] [PubMed] [Google Scholar]
- 17.Weber M, Schubeler D. Genomic patterns of DNA methylation: targets and function of an epigenetic mark. Curr. Opin. Cell Biol. 2007;19:273–280. doi: 10.1016/j.ceb.2007.04.011. [DOI] [PubMed] [Google Scholar]
- 18.Laird PW. Principles and challenges of genome-wide DNA methylation analysis. Nat. Rev. Genet. 2010;11:191–203. doi: 10.1038/nrg2732. [DOI] [PubMed] [Google Scholar]
- 19.Jorda M, Peinado MA. Methods for DNA methylation analysis and applications in colon cancer. Mutat. Res. 2010;693:84–93. doi: 10.1016/j.mrfmmm.2010.06.010. [DOI] [PubMed] [Google Scholar]
- 20.Clark SJ, Statham A, Stirzaker C, Molloy PL, Frommer M. DNA methylation: bisulphite modification and analysis. Nat. Protoc. 2006;1:2353–2364. doi: 10.1038/nprot.2006.324. [DOI] [PubMed] [Google Scholar]
- 21.Gama-Sosa MA, Wang RY, Kuo KC, Gehrke CW, Ehrlich M. The 5-methylcytosine content of highly repeated sequences in human DNA. Nucleic Acids Res. 1983;11:3087–3095. doi: 10.1093/nar/11.10.3087. [DOI] [PMC free article] [PubMed] [Google Scholar]
- 22.Feinberg AP, Vogelstein B. Hypomethylation distinguishes genes of some human cancers from their normal counterparts. Nature. 1983;301:89–92. doi: 10.1038/301089a0. [DOI] [PubMed] [Google Scholar]
- 23.Harris RA, Wang T, Coarfa C, Nagarajan RP, Hong C, Downey SL, Johnson BE, Fouse SD, Delaney A, Zhao Y, et al. Comparison of sequencing-based methods to profile DNA methylation and identification of monoallelic epigenetic modifications. Nat. Biotechnol. 2010;28:1097–1105. doi: 10.1038/nbt.1682. [DOI] [PMC free article] [PubMed] [Google Scholar]
- 24.Laurent L, Wong E, Li G, Huynh T, Tsirigos A, Ong CT, Low HM, Kin Sung KW, Rigoutsos I, Loring J, et al. Dynamic changes in the human methylome during differentiation. Genome Res. 2010;20:320–331. doi: 10.1101/gr.101907.109. [DOI] [PMC free article] [PubMed] [Google Scholar]
- 25.Lister R, Pelizzola M, Dowen RH, Hawkins RD, Hon G, Tonti-Filippini J, Nery JR, Lee L, Ye Z, Ngo Q-M, et al. Human DNA methylomes at base resolution show widespread epigenomic differences. Nature. 2009;462:315–322. doi: 10.1038/nature08514. [DOI] [PMC free article] [PubMed] [Google Scholar]
- 26.Lister R, Pelizzola M, Kida YS, Hawkins RD, Nery JR, Hon G, Antosiewicz-Bourget J, O'Malley R, Castanon R, Klugman S, et al. Hotspots of aberrant epigenomic reprogramming in human induced pluripotent stem cells. Nature. 2011;471:68–73. doi: 10.1038/nature09798. [DOI] [PMC free article] [PubMed] [Google Scholar]
- 27.Hansen KD, Timp W, Bravo HC, Sabunciyan S, Langmead B, McDonald OG, Wen B, Wu H, Liu Y, Diep D, et al. Increased methylation variation in epigenetic domains across cancer types. Nat. Genet. 2011;43:768–775. doi: 10.1038/ng.865. [DOI] [PMC free article] [PubMed] [Google Scholar]
- 28.Li Y, Zhu J, Tian G, Li N, Li Q, Ye M, Zheng H, Yu J, Wu H, Sun J, et al. The DNA methylome of human peripheral blood mononuclear cells. PLoS Biol. 2010;8:e1000533. doi: 10.1371/journal.pbio.1000533. [DOI] [PMC free article] [PubMed] [Google Scholar]
- 29.Heyn H, Vidal E, Sayols S, Sanchez-Mut JV, Moran S, Medina I, Sandoval J, Simo-Riudalbas L, Szczesna K, Huertas D, et al. Whole-genome bisulfite DNA sequencing of a DNMT3B mutant patient. Epigenetics. 2012;7:542–550. doi: 10.4161/epi.20523. [DOI] [PMC free article] [PubMed] [Google Scholar]
- 30.Heyn H, Li N, Ferreira HJ, Moran S, Pisano DG, Gomez A, Diez J, Sanchez-Mut JV, Setien F, Carmona FJ, et al. Distinct DNA methylomes of newborns and centenarians. Proc. Natl Acad. Sci. USA. 2012;109:10522–10527. doi: 10.1073/pnas.1120658109. [DOI] [PMC free article] [PubMed] [Google Scholar]
- 31.Langmead B, Trapnell C, Pop M, Salzberg SL. Ultrafast and memory-efficient alignment of short DNA sequences to the human genome. Genome Biol. 2009;10:R25. doi: 10.1186/gb-2009-10-3-r25. [DOI] [PMC free article] [PubMed] [Google Scholar]
- 32.Li H, Handsaker B, Wysoker A, Fennell T, Ruan J, Homer N, Marth G, Abecasis G, Durbin R. The Sequence Alignment/Map format and SAMtools. Bioinformatics. 2009;25:2078–2079. doi: 10.1093/bioinformatics/btp352. [DOI] [PMC free article] [PubMed] [Google Scholar]
- 33.Dreszer TR, Karolchik D, Zweig AS, Hinrichs AS, Raney BJ, Kuhn RM, Meyer LR, Wong M, Sloan CA, Rosenbloom KR, et al. The UCSC Genome Browser database: extensions and updates 2011. Nucleic Acids Res. 2012;40:D918–D923. doi: 10.1093/nar/gkr1055. [DOI] [PMC free article] [PubMed] [Google Scholar]
- 34.Illingworth RS, Gruenewald-Schneider U, Webb S, Kerr AR, James KD, Turner DJ, Smith C, Harrison DJ, Andrews R, Bird AP. Orphan CpG islands identify numerous conserved promoters in the mammalian genome. PLoS Genet. 2010;6:e1001134. doi: 10.1371/journal.pgen.1001134. [DOI] [PMC free article] [PubMed] [Google Scholar]
- 35.Wu H, Caffo B, Jaffee HA, Irizarry RA, Feinberg AP. Redefining CpG islands using hidden Markov models. Biostatistics. 2010;11:499–514. doi: 10.1093/biostatistics/kxq005. [DOI] [PMC free article] [PubMed] [Google Scholar]
- 36.Quinlan AR, Hall IM. BEDTools: a flexible suite of utilities for comparing genomic features. Bioinformatics. 2010;26:841–842. doi: 10.1093/bioinformatics/btq033. [DOI] [PMC free article] [PubMed] [Google Scholar]
- 37.Du P, Zhang X, Huang CC, Jafari N, Kibbe WA, Hou L, Lin SM. Comparison of Beta-value and M-value methods for quantifying methylation levels by microarray analysis. BMC Bioinformatics. 2010;11:587. doi: 10.1186/1471-2105-11-587. [DOI] [PMC free article] [PubMed] [Google Scholar]
- 38.Warnecke PM, Stirzaker C, Melki JR, Millar DS, Paul CL, Clark SJ. Detection and measurement of PCR bias in quantitative methylation analysis of bisulphite-treated DNA. Nucleic Acids Res. 1997;25:4422–4426. doi: 10.1093/nar/25.21.4422. [DOI] [PMC free article] [PubMed] [Google Scholar]
- 39.Reins J, Mossner M, Richter L, Kmetsch A, Thiel E, Haase D, Hofmann WK. [Letter to the editor]: whole-genome amplification of sodium bisulfite-converted DNA can substantially impact quantitative methylation analysis using pyrosequencing. Biotechniques. 2011;50:161–164. doi: 10.2144/000113612. [DOI] [PubMed] [Google Scholar]
- 40.Pelizzola M, Ecker JR. The DNA methylome. FEBS Lett. 2011;585:1994–2000. doi: 10.1016/j.febslet.2010.10.061. [DOI] [PMC free article] [PubMed] [Google Scholar]
- 41.Nair SS, Coolen MW, Stirzaker C, Song JZ, Statham AL, Strbenac D, Robinson MW, Clark SJ. Comparison of methyl-DNA immunoprecipitation (MeDIP) and methyl-CpG binding domain (MBD) protein capture for genome-wide DNA methylation analysis reveal CpG sequence coverage bias. Epigenetics. 2011;6:34–44. doi: 10.4161/epi.6.1.13313. [DOI] [PubMed] [Google Scholar]
- 42.Robinson MD, Statham AL, Speed TP, Clark SJ. Protocol matters: which methylome are you actually studying? Epigenomics. 2010;2:587–598. doi: 10.2217/epi.10.36. [DOI] [PMC free article] [PubMed] [Google Scholar]
- 43.Bock C, Tomazou EM, Brinkman AB, Müller F, Simmer F, Gu H, Jäger N, Gnirke A, Stunnenberg HG, Meissner A. Quantitative comparison of genome-wide DNA methylation mapping technologies. Nat. Biotechnol. 2010;28:1106–1114. doi: 10.1038/nbt.1681. [DOI] [PMC free article] [PubMed] [Google Scholar]
- 44.Rajendram R, Ferreira JC, Grafodatskaya D, Choufani S, Chiang T, Pu S, Butcher DT, Wodak SJ, Weksberg R. Assessment of methylation level prediction accuracy in methyl-DNA immunoprecipitation and sodium bisulfite based microarray platforms. Epigenetics. 2011;6:410–415. doi: 10.4161/epi.6.4.14763. [DOI] [PubMed] [Google Scholar]
- 45.Suzuki M, Jing Q, Lia D, Pascual M, McLellan A, Greally JM. Optimized design and data analysis of tag-based cytosine methylation assays. Genome Biol. 2010;11:R36. doi: 10.1186/gb-2010-11-4-r36. [DOI] [PMC free article] [PubMed] [Google Scholar]
- 46.Gupta R, Nagarajan A, Wajapeyee N. Advances in genome-wide DNA methylation analysis. Biotechniques. 2010;49:iii–xi. doi: 10.2144/000113493. [DOI] [PMC free article] [PubMed] [Google Scholar]
- 47.Bird AP. CpG-rich islands and the function of DNA methylation. Nature. 1986;321:209–213. doi: 10.1038/321209a0. [DOI] [PubMed] [Google Scholar]
- 48.Bird A. On the track of DNA methylation: an interview with Adrian Bird by Jane Gitschier. PLoS Genet. 2009;5:e1000667. doi: 10.1371/journal.pgen.1000667. [DOI] [PMC free article] [PubMed] [Google Scholar]
- 49.Doi A, Park IH, Wen B, Murakami P, Aryee MJ, Irizarry R, Herb B, Ladd-Acosta C, Rho J, Loewer S, et al. Differential methylation of tissue- and cancer-specific CpG island shores distinguishes human induced pluripotent stem cells, embryonic stem cells and fibroblasts. Nat. Genet. 2009;41:1350–1353. doi: 10.1038/ng.471. [DOI] [PMC free article] [PubMed] [Google Scholar]
- 50.Pastor WA, Pape UJ, Huang Y, Henderson HR, Lister R, Ko M, McLoughlin EM, Brudno Y, Mahapatra S, Kapranov P, et al. Genome-wide mapping of 5-hydroxymethylcytosine in embryonic stem cells. Nature. 2011;473:394–397. doi: 10.1038/nature10102. [DOI] [PMC free article] [PubMed] [Google Scholar]
- 51.Williams K, Christensen J, Helin K. DNA methylation: TET proteins-guardians of CpG islands? EMBO Rep. 2012;13:28–35. doi: 10.1038/embor.2011.233. [DOI] [PMC free article] [PubMed] [Google Scholar]
- 52.Irizarry RA, Ladd-Acosta C, Wen B, Wu Z, Montano C, Onyango P, Cui H, Gabo K, Rongione M, Webster M, et al. The human colon cancer methylome shows similar hypo- and hypermethylation at conserved tissue-specific CpG island shores. Nat. Genet. 2009;41:178–186. doi: 10.1038/ng.298. [DOI] [PMC free article] [PubMed] [Google Scholar]
- 53.Singer M, Boffelli D, Dhahbi J, Schonhuth A, Schroth GP, Martin DI, Pachter L. MetMap enables genome-scale Methyltyping for determining methylation states in populations. PLoS Comput. Biol. 2010;6:e1000888. doi: 10.1371/journal.pcbi.1000888. [DOI] [PMC free article] [PubMed] [Google Scholar]
- 54.Krueger F, Kreck B, Franke A, Andrews SR. DNA methylome analysis using short bisulfite sequencing data. Nat. Methods. 2012;9:145–151. doi: 10.1038/nmeth.1828. [DOI] [PubMed] [Google Scholar]
- 55.Martin DI, Singer M, Dhahbi J, Mao G, Zhang L, Schroth GP, Pachter L, Boffelli D. Phyloepigenomic comparison of great apes reveals a correlation between somatic and germline methylation states. Genome Res. 2011;21:2049–2057. doi: 10.1101/gr.122721.111. [DOI] [PMC free article] [PubMed] [Google Scholar]
Associated Data
This section collects any data citations, data availability statements, or supplementary materials included in this article.