

Abstract
The study of cell-population heterogeneity in a range of biological systems, from viruses to bacterial isolates to tumor samples, has been transformed by recent advances in sequencing throughput. While the high-coverage afforded can be used, in principle, to identify very rare variants in a population, existing ad hoc approaches frequently fail to distinguish true variants from sequencing errors. We report a method (LoFreq) that models sequencing run-specific error rates to accurately call variants occurring in <0.05% of a population. Using simulated and real datasets (viral, bacterial and human), we show that LoFreq has near-perfect specificity, with significantly improved sensitivity compared with existing methods and can efficiently analyze deep Illumina sequencing datasets without resorting to approximations or heuristics. We also present experimental validation for LoFreq on two different platforms (Fluidigm and Sequenom) and its application to call rare somatic variants from exome sequencing datasets for gastric cancer. Source code and executables for LoFreq are freely available at http://sourceforge.net/projects/lofreq/.
INTRODUCTION
Recent advances in sequencing technologies have enabled more widespread study of heterogeneity and sub-populations in a cell population, and a migration away from a ‘consensus sequence’ view of their evolution. Such a ‘population perspective’ has applications in a range of biological systems, from the characterization of viral quasi species and intra-host variation (1,2), to bacterial sub-populations (3–5), to sub-clonal evolution in cancer (6–8). Precise characterization of population structure (and rare sub-populations) in these studies is fundamental to the analysis of population evolution and dynamics as a function of host response or drug exposure. Several recent cancer sequencing studies have further emphasized the functional role of rare sub-populations and variants in aspects such as tumor growth, drug resistance and metastasis (9,10) and the need for computational tools to study them.
In principle, the high throughput of massively parallel sequencing allows for sampling of even rare sub-populations. Sequencing errors, however, complicate the determination of true variations in the population. Sequencing error rates are known to be highly variable and differ significantly between technologies, runs, lanes, multiplexes, genomic location as well as substitution types (11–13). While approaches to correct for these have been studied, the majority of variant-calling methods have focused on low-coverage human re-sequencing data and diploid calls (14–16) with discrete frequencies of interest (i.e. 0, 0.5 and 1; a related set of methods are those tailored for calling diploid genotypes in pooled sequencing data (17–20) and are not generally applicable).
Studies of RNA viruses have provided the exceptions to this rule (21–24). RNA viruses have high mutation rates (due to poor or missing proof-reading capability of the viral RNA-dependent DNA polymerase) and high replication rates, and the resulting intra-host variations have implications for drug treatment strategies (25) and the genetic monitoring of live vaccines (26). The methods used in these studies though rely on ad hoc trimming, filtering and thresholds to call variants, limiting their sensitivity and widespread applicability (needing manual adjustment per sample or sequencing run). Recent model-based approaches such as Breseq (27,28) and SNVer (29) are potentially more sensitive and generic, but rely on simple binomial models and are not tailored to accommodate biases in error rates. A more sophisticated approach, that relies on phasing to reduce the effect of sequencing errors and is tailored to 454 sequencing has recently been applied to viral datasets (30). This method is, however, not directly applicable to other technologies and cannot be run on large genomes or sequencing datasets.
In emerging clinical applications that use sequencing to monitor the genomic state of cells, the ability to detect rare variants in a population and to do so at the edge of detection limits is an important unfulfilled capability. On the one hand, increased sensitivity in variant callers can make it possible to monitor rare but important sub-populations (e.g. cancer stem cell mutations) and on the other hand, sensitivity is essential for early detection of say a drug-resistant sub-population (e.g. with antiretroviral drugs for HIV). In such settings, ad hoc approaches lack the desired adaptability and robustness and may suffer from an artificial cap in the sensitivity of variant detection. Precise modeling of sequencing errors is essential to push sensitivity limits and it is this need that we seek to address.
In this work, we present a sensitive and robust approach for calling single-nucleotide variants (SNVs) from high-coverage sequencing datasets, based on a formal model for biases in sequencing error rates. We show that rigorous statistical testing can be done efficiently under this model, without resorting to approximations, thus allowing for the exact analysis of large genomes and high-coverage datasets. The resulting method, LoFreq, adapts automatically to sequencing run and position-specific sequencing biases and can call SNVs at a frequency lower than the average sequencing error rate in a dataset. LoFreq’s robustness, sensitivity and specificity were validated using several simulated and real datasets (viral, bacterial and human) and on two experimental platforms (Fluidigm and Sequenom). Our results from applying LoFreq to call rare somatic SNVs (in exome sequencing datasets for gastric cancer) and for studying dengue virus quasi species before and after treatment in a clinical study (of a nucleoside-analog drug Balapiravir) further highlight the robustness and versatility of this approach.
MATERIALS AND METHODS
Sequencing data
All dengue virus samples were sequenced in the Genome Institute of Singapore, as described below. For a description of the clinical samples, see Nguyet et al. (31). Sequencing data for an Escherichia coli str. K-12 substr. MG1655 clone were downloaded from the Sequence Read Archive (SRA submission ERA000206; 2 × 100 bp reads). Mapped whole-genome and exome sequencing data for gastric cancer were taken from Zang et al. (32).
Sequencing of dengue virus samples
Library construction
A single RT-primer was designed to bind specifically to the 3′-end of dengue viruse genomes. For complementary DNA (cDNA) synthesis, the RevertAid™ Premium First Strand cDNA Synthesis Kit (Fermentas, St. Leon-Rot, Germany) was used. Primer pairs were designed to generate multiple overlapping polymerase chain reaction (PCR) fragments, roughly 2 kb in size. PCR was performed using the PfuUltra™ II Fusion HS DNA Polymerase (Stratagene, La Jolla, CA, USA) according to the manufacturer’s instructions. The fragments were gel extracted from 1% agarose gel prepared in 1× TBE buffer and the concentrations were measured using the NanoDrop ND 1000 Spectrophotometer (Thermo Fisher Scientific, Waltham, MA, USA). Equal concentration of DNA products of each sample was combined and fragmented into a peak size range of 100–300 bp using the Covaris S2 (Covaris, Woburn, MA, USA) (shearing conditions—duty cycle: 20%; intensity: 5; cycles per burst: 200 and time: 110 s). After fragmentation, the samples were purified using the Qiagen PCR purification kit (Qiagen, Valencia, CA, USA). Fragmented products were quality-checked (2100 Bioanalyzer with a DNA 1000 Chip, Agilent Technologies, Santa Clara, CA, USA). For library preparation, the NEBNext DNA Sample Prep Master Mix 1 kit (New England Biolabs) was used. The DNA samples underwent end-repair, A-tailing and ligation of adapters according to the manufacturer’s instructions. After quality check of the ligated product on the Bioanalyzer, fragments in the range 200–400 bp were extracted from 2% agarose gel prepared in 1× TAE buffer, cleaned using the Qiagen Gel extraction kit (Qiagen) and quality-checked again. Finally, using the Multiplexing Sample Preparation Oligonucleotide Kit (Illumina, San Diego, CA, USA), samples underwent 16 PCR cycles to incorporate indices and were quality-checked again using the Bioanalyzer and the LightCycler 480 SYBR Green I Master mix (Roche Applied Science, Indianapolis, IN, USA) in a LightCycler® 480 II real-time thermal cycler (Roche Applied Science) according to the manufacturer’s instructions.
Multiplex replicates
To study consistency and reproducibility, six library replicates of DENV2 TSV01 viruses were created. The viruses were grown in c6/36 cells and RNA was extracted using the QIAamp Viral RNA Mini Kit (Qiagen). The extracted RNA underwent library preparation as described above. In the final PCR step, the sample was divided into six reactions, which were indexed and multiplexed accordingly.
Sequencing
Dengue virus samples were sequenced in the Genome Institute of Singapore on an Illumina GA-II sequencer to obtain 35 bp reads. Base calling was done with CASAVA 1.7 and reads that did not pass Illumina’s chastity filter (CASAVA 1.7 user guide) were removed.
Experimental validation
Fluidigm digital array
DENV2 NGC cDNA was used to construct two sets of libraries in parallel (PCR duplicates) and sequenced on an Illumina Genome Analyzer II to obtain 2 × 75 bp paired-end reads. SNVs were called on both replicates using LoFreq, SNVer and Breseq and 12 low-frequency SNVs were selected from the union (found in both replicates, frequency ≤5%, discordant calls between methods, >50 bp away from PCR fragment ends) for validation on the Fluidigm Digital Array™ (Fluidigm, San Francisco, CA, USA). cDNA quantification was performed on a Tecan GENios microplate detection device (Tecan Inc., Research Triangle Park, NC, USA) and the sample was diluted accordingly. Taqman assays were designed based on the positions of the 12 SNVs. The main components in the sample preparation pre-mix include the TaqMan® Gene Expression Master Mix (Applied Biosystems, Life Technologies, Foster City, CA, USA), 20× GE sample loading reagent (Fluidigm) and 20× gene-specific assays (Applied Biosystems). The diluted cDNA and pre-mix were transferred into the primed chip and loaded using an Integrated Fluidic Circuit Controller MX (Fluidigm) following manufacturer’s instructions. The chip was then run on the The BioMark™ System (Fluidigm) using the Data Collection Software. Data were extracted and analyzed using the Digital PCR Analysis Software (Fluidigm). SNV frequencies were determined in quadruplicates.
Sequenom MassArray
We attempted to detect sequence variants within the pool of dengue virus genomes using the Sequenom MassArray iPLEX primer extension platform (Sequenom, San Diego, CA, USA). Note that this approach is not expected to be as sensitive as digital PCR and correspondingly we only used it to measure the Type II error rate. Assays for the sequence variants were designed in multiplex and the genotyping step comprises an initial PCR reaction to amplify the viral genomic region of interest followed by primer extension based on viral genotype status. The size of the extended products thus represents viral genotype status and was then resolved by mass spectrometry time of flight. In total, 18 clinical samples and 4 cell-culture samples (all DENV2) were assayed in two replicates at 79 and 13 positions, respectively (1474 primer/sample combinations). Moderate and sample-specific calls were then compared with sequencing-based LoFreq calls to assess concordance.
Simulated datasets
Simulated sequencing
We generated 10 mutants of the DENV2 Refseq sequence NC_001474.2, by randomly mutating 0.1% of the positions (without replacement), and thus obtained a list of true-positive SNVs. From the haplotype sequences, we simulated 35 bp reads using Metasim (33), with error rates derived from average quality per read position for the clinical DENV2 samples. For each coverage level (50×, 100×, 500×, 1000×, 5000× and 10 000×), 10 replicates were simulated. The quality values were added to the simulated fasta file to produce a FastQ file with base-call qualities. The abundance of the haplotypes (Metasim’s taxonomy profile) was set according to a geometric series (multiplicative factor of 2) resulting in haplotype and corresponding SNV frequencies ranging from a lower bound of 0.1–50%.
Simulated population
From the clinical DENV2 samples, we took the six datasets with highest coverage and used the most sensitive SNV-calling module (LoFreq-NQ; see below) to call variants. Reads supporting any called variants were removed to make the datasets appear ‘clonal’ while retaining sequencing errors. The consensus genome for each of the six datasets was then aligned to Genbank sequence EU660415 (which was also used for read mapping) to determine true-positive SNVs. The six datasets were then randomly sub-sampled and pooled according to a geometric series, leading to a range of haplotype/SNV frequencies (∼1–50%) and total coverage of ∼100×.
Detection limit test
To test the detection limits of the various methods, we artificially created short alignments with various coverage values and controlled counts of non-reference bases (i.e. SNVs to be detected), where each base was assigned the same uniform quality. For each given quality/coverage combination, we recorded the minimum number of non-reference bases needed to call a SNV. Breseq did not make any calls for this dataset and we suspect that this is because it is based on a likelihood ratio test using background frequencies from the whole alignment, and these were not meaningful for this artificial and short dataset.
SNV calling with LoFreq
Modeling sequencing error
Given an alignment of reads to a consensus reference, LoFreq treats each base in a column as arising from a Bernoulli trial (success = reference/consensus base; failure = variant base). Each trial is assumed to be independent with an associated sequencing error probability that can be derived from a Phred-scaled quality value (Q) for the base (P = 10 exp (−Q/10)). The number of variant bases (K) in a column of N bases is then given by a Poisson–binomial distribution—a generalization of the binomial distribution, where each Bernoulli trial can have a distinct success probability. To compute exact P-values under this null model, we employed the following recursion formula that is easy to derive from first principles:
| (1) |
where Prn(X=k) is the probability of observing k variants in the first n bases and Pn is the error probability for the nth base. The P-value is then given by ∑k≥K PrN (X=k), i.e. the sum of the tail of the probability mass function (pmf) for n=N.
Runtime optimization
While a naive recursion based on Equation (1) can take time exponential in N, a dynamic programming approach to save intermediate results allows for the computation of the pmf in O(N2) time. As N can be large in practice, we aimed to reduce runtime by limiting computation to the portions of intermediate pmfs that affect the final P-value. In particular, it is easy to show that Prn(X=k)=0 for k>n and that entries for n>N − K, k<K − N + n do not affect the final P-value. Also, for a given threshold (t) on the P-value, if ∑k≥K Prn(X=k)>t for any n, then the P-value will also be greater than t (as shown below) allowing for computation to terminate prematurely for most columns in an alignment (the non-variant columns). Finally, a key refinement in LoFreq is based on the following recursion:
| (2) |
where Sn = ∑k≥K Prn(X = k). This recursion can be derived directly from Equation (1) and allows LoFreq to only compute the pmf for k < K, in addition to keeping track of Sn using Equation (2). Thus, the worst-case runtime for LoFreq is reduced to O(KN)—a significant gain when most columns have few variant bases. Note that to maintain numerical precision, all arithmetic in LoFreq is done in log-space where we compute log(a) + log(b), a > b, using the formula log(a) + log(1+exp(log(b) − log(a))).
Sequencing quality
Where available, LoFreq takes in Phred-scaled quality values provided by the sequencing instrument as input to its model. Quality calibration, as described in (15) can also be used to further refine these values and reduce bias. For variant bases, a user-defined threshold T (default Q20 or 1% error rate) was used to conservatively remove bases with quality below the threshold and variant bases were assigned a quality of T. In the absence of user-provided quality values, LoFreq models error rates for all 12 possible base substitution classes (PX>Y, X ≠ Y) and estimates them using an Expectation–Maximization (EM) approach (34). For this, each column (C) was assumed to come from one of two models, either a reference base with a 12-parameter model for sequencing error (R) or a variant column (V, i.e. ZC ∈ {R,V}). During the training phase, error probabilities for all substitution classes are learnt directly from the data: the expectation step calls SNVs using a binomial test (Bonferroni-corrected P-value < 0.05) with the current error probabilities and the maximization step updates the error probabilities based on base counts in columns in which the respective substitution class was not called a SNV (i.e. 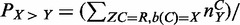
 , where b(C) is the reference base in column C and nCY is the number of Y bases seen in column C; this assignment can be shown to maximize the likelihood function). The maximization and expectation steps are iterated until error probabilities converge (<10−9). For final SNV calling, the expectation step was used with the converged error probabilities. This EM-based approach (LoFreq-NQ) is faster and more sensitive (but has higher false-positive rates; data not shown) and can be employed when quality values are missing or unreliable.
Calling somatic/sample-specific variants
In order to identify sample-specific variants (say somatic in A when compared with tissue B), LoFreq employs the following approach: (1) variants called in Sample A are then tested in B and (2) variants that are not called in B by LoFreq are further tested to see if this could be because of inadequate read coverage in B (using a binomial test with SNV frequency from A). Variants that pass this test are then reported as being specific to/somatic in A.
Flagging strand bias
Analogous to the tests in other methods (14,27,29), LoFreq allows the user to identify variant positions marked by a significant bias in the strand from which the supporting reads are derived. It does so by doing a two-tailed Fisher’s exact test of the hypothesis that variant-base forward and reverse strand counts come from the same distribution as the consensus base. A user can then choose to ignore variants with high strand bias (low P-value; Holm–Bonferroni corrected for multiple-hypothesis testing).
Dengue data analysis
For mapping of DENV2 cell-culture sequencing reads, we used RefSeq sequence NC_001474. Reads of the clinical DENV1 and DENV2 samples were mapped against Genbank sequences FJ410275 and EU660415, respectively. Reads were uniquely mapped using RazerS version 1.0 (35) against the respective reference, with the recognition rate set to 100%, allowing no indels. A two-step mapping approach (following the recipe in Nguyet et al. (31)) was used in which a consensus was derived from the initial mapping, which was then used as reference in a second step. For this, we gradually lowered RazerS’ identity thresholds in 2% steps from the default of 92%. Updated mappings were kept if the number of newly mapped reads increased by at least 1%. Base-quality values were recalibrated using GATK (15) Version 1.0.5336 and QualityScore, Cycle and Dinucleotide covariates (except for the simulated sequences). For this, sites showing a variation of at least 1% variation were marked as ‘known’ variations. Primer positions with coverage spikes were excluded from SNV calling and reads mapping there were excluded during quality recalibration.
Shift in mutation frequencies
To compare the frequency of C > N mutations in the placebo group versus the drug group, for each paired sample (Table 3) we called SNVs in pre- and post-dose samples using LoFreq. We then subtracted the sum of SNV frequencies from pre-dose samples from the sum for post-dose samples and normalized by the time difference and the number of cytosine bases in the consensus sequence. The resulting numbers (a measure of average mutation rate) were compared for drug and placebo group pairs using the Mann–Whitney test.
Table 3.
Distribution of clinical dengue virus sequencing datasets
| Drug | Placebo | Total | |
|---|---|---|---|
| DENV1 | 8 (19) | 11 (22) | 19 (41) |
| DENV2 | 5 (11) | 2 (4) | 7 (15) |
| DENV3 | 2 (5) | 2 (4) | 4 (9) |
| Total | 15 (35) | 15 (30) | 30 (65) |
The samples analyzed here were collected as part of a drug-trial study for the nucleoside-analog Balapiravir (31). Numbers in parentheses report the total number of samples sequenced, while un-parenthesized numbers report the number of pairs (a pre- and a post-dose sample) that were sequenced.
Hotspots and cold-spots
For identifying mutational hotspots, we used a scanning window approach to scan the dengue virus genome for each sample (window size of 20 and an overlap of five nucleotides) to look for an excess of SNVs in a window compared with the genome-wide average (binomial test; Bonferroni-corrected P-value < 0.05). For cold-spots, we pooled SNVs from all samples and scanned for windows (minimum size of 40) with a depletion of SNVs (binomial test; Bonferroni-corrected P-value < 0.05).
Escherichia coli data analysis
Simulated reads were generated using Metasim (RefSeq entry NC_000913 as reference) with error rates and number of reads set to those observed from the real dataset. Reads from the simulated and real datasets were uniquely mapped against RefSeq entry NC_000913 using BWA (36), which resulted in an average coverage of ∼560×. Quality recalibration was performed for the real dataset in the same way as was done for the dengue data. The real dataset was assumed to be genetically clonal with no true rare SNVs to be detected.
Gastric cancer data analysis
Mitochondrial heteroplasmy
Reads mapping against the mitochondrial genome were extracted from the hg18-mapped BAM files and stringently remapped (BWA unique) against the Cambridge reference (37) to allow for easy comparison with Mitomap entries. This was followed by quality recalibration (as was done for the dengue data) and SNV calling using LoFreq.
Whole-genome sequencing data
For the analysis of the whole-genome sequencing data, we applied the same filtering rules for samtools (Version 0.1.18; (14)) and LoFreq to allow for a fair comparison. Specifically, we set the coverage cap to 10 000, removed any bases with a quality <13 (samtools default corresponding to an error rate of 5%), removed predicted SNVs with a quality <40 (0.01% error rate) and removed SNVs if more than three are present in a window of 20 bp, to reduce indel-associated artifacts. No extra strand-bias filter was applied. SNP calls for validation were obtained using data from a Illumina Human610-Quadv1 array (32). Positive predictive value (PPV) was computed as the fraction of samtools or LoFreq calls at array positions that were concordant with the SNP array and sensitivity was measured as the fraction of genotyped positions that were correctly called by the variant callers.
Exome sequencing data
Somatic SNVs were called with LoFreq and compared with the calls made using a samtools-based pipeline (32). Specifically, a somatic variant was reported for a variant call unique to the tumor, where the normal genotype called by samtools was different and where less than two reads of the variant genotype were seen in the normal sample. P-values for somatic SNV calls produced by LoFreq were Bonferroni corrected and if more than three SNPs where present in a window of 20 bp, they were removed to reduce indel-associated artifacts (this was done for the samtools calls as well).
Parameters for SNV calling
Goto et al. and Wright et al.
In order to enable comparisons with the methods described in these publications—which were chosen as representatives for non-model-based algorithms—we re-implemented them and these are now available as part of the LoFreq package.
SNVer
We used SNVer Version 0.3.1, which automatically determines error rates, whereas the original version needed a fixed, user-defined sequencing error threshold (29). The SNVerIndividual.jar module was used for SNV calling. The number of haploids was set to 1 and the alt/ref ratio threshold was set to 0.0 to switch off filtering of variants with frequencies below the default of 25%.
Breseq
We used Breseq Version 0.18 (27,28) and switched on its ‘polymorphism-prediction’ function for calling variants. Note that Breseq is an end-to-end protocol for the analysis of microbial short-read data with many more features, but here we only used its ability to predict substitutions. We ran the full Breseq pipeline (SSAHA2 Version 2.5.5 for mapping), starting from the unmapped reads and parsed SNVs from the final html output. Where it made sense to use Breseq’s stand-alone variant caller (e.g. in the runtime comparison), we used this version and denote it as ‘Breseq*’.
LoFreq
LoFreq takes a samtools pileup as input (samtools mpileup; Version 0.1.18). By default samtools applies a coverage cap and we set this to be sufficiently high to avoid filtering reads in a sample (-d 100000). Whenever indels were not allowed for read mapping, we switched off samtools BAQ computation (-B). SNVs were called with a Bonferroni-corrected P-value threshold of 0.05 and the same threshold was applied for calling somatic variants with the binomial test. Unless stated otherwise, we removed variant positions with a significant strand bias (Holm–Bonferroni-corrected P-value < 0.05) from LoFreq predictions.
Availability of datasets
All simulated and sequencing datasets generated in this study can be downloaded from http://collaborations.gis.a-star.edu.sg/∼wilma/lofreq_paper_data/ and sequencing data will be available soon from the Sequence Read Archive.
RESULTS
Sensitivity/specificity tradeoffs and detection limits
To benchmark LoFreq against existing methods (SNVer, Breseq, Goto et al. (38) and Wright et al. (23)), we constructed several in silico datasets with varying characteristics. In particular, we constructed datasets with simulated reads mimicking the characteristics of the dengue virus sequencing datasets in this study (see ‘Materials and Methods’ section) and designed to contain 10 haplotypes with the rarest being represented at a frequency of 0.1%. These datasets allowed us to investigate the performance of the various methods as a function of sequencing coverage (from 50× to 10 000×). Overall, the heuristic approaches performed poorly in terms of sensitivity (Goto et al.) or PPV (Wright et al.), while all the model-based approaches (SNVer, Breseq and LoFreq) had perfect PPV and therefore perfect specificity (Table 1). LoFreq was also the most sensitive method with perfect specificity and called 96% of variants at 0.2% frequency with 10 000× coverage (compared with 0 and 8% for SNVer and Breseq, respectively). As expected, with lower coverage, sensitivity fell for all methods but LoFreq continued to improve on results from SNVer and Breseq. These results highlight the utility of the quality-aware approach in LoFreq for being able to exploit information present in high-coverage sequencing datasets to call variants with high sensitivity and specificity.
Table 1.
Performance of variant callers as a function of coverage
| Coverage | Goto et al. | Wright et al. | Breseq* | SNVer | LoFreq | |
|---|---|---|---|---|---|---|
| 50× | Sensitivity | 61 | 71 | 56 | 58 | 60 |
| PPV | 100 | 50 | 100 | 100 | 100 | |
| 100× | Sensitivity | 64 | 76 | 59 | 62 | 64 |
| PPV | 100 | 33 | 100 | 100 | 100 | |
| 500× | Sensitivity | 66 | 90 | 66 | 67 | 73 |
| PPV | 100 | 9 | 100 | 100 | 100 | |
| 1000× | Sensitivity | 67 | 95 | 68 | 70 | 77 |
| PPV | 100 | 5 | 100 | 100 | 100 | |
| 5000× | Sensitivity | 67 | 100 | 76 | 74 | 87 |
| PPV | 100 | 1 | 100 | 100 | 100 | |
| 10 000× | Sensitivity | 67 | 100 | 78 | 77 | 94 |
| PPV | 100 | 2 | 100 | 100 | 100 |
Sensitivity and PPV are reported as an average of 10 replicates. Sensitivity was measured as the fraction of true SNVs that were correctly called and PPV was measured as the fraction of SNV calls that were correct. In all cases, standard deviation was <2%. We present results for Breseq’s stand-alone variant caller (indicated with Breseq*) in this comparison as the Breseq pipeline unexpectedly performed poorly on this dataset.
In order to more closely mimic the biases in sequencing read coverage and base qualities, we also created ‘simulated population’ datasets using real sequencing data (see ‘Materials and Methods’ section). As before SNVer, Breseq and LoFreq had perfect specificity, but LoFreq consistently detects the highest number of true SNVs in all frequency ranges (Figure 1a). A striking aspect of these results is that even for SNVs with frequency >10%, LoFreq finds >40 variants that are missed by SNVer and Breseq, providing a 10–20% boost in sensitivity in this range (Figure 1a). In fact, predictions made by Breseq and SNVer were found to be essentially a subset of LoFreq’s prediction (Figure 1b) with LoFreq increasing overall sensitivity by 25 and 71% compared with SNVer and Breseq, respectively.
Figure 1.

In silico and experimental validation. (a) Sensitivity as a function of SNV frequency for LoFreq, SNVer and Breseq on a simulated viral population (see ‘Materials and Methods’ section). (b) Venn diagram showing the overlap of SNV predictions on the simulated population. (c) Detection limits for LoFreq and SNVer as a function of sequencing quality and coverage. Note that SNVer results are unaffected by varying quality values. (d) Validation results for rare variants on a Fluidigm Digital Array. Standard deviations are shown as boxes with error-bars. Note that three assays failed (reporting a non-sense frequency of 50%) and are not shown here.
The detection limits of rare variant-calling methods have not been systematically assessed before and the general assumption has been that variants at a frequency lower than the average error rate in a dataset are likely to be undetectable (23). To study this aspect further, we evaluated the methods on datasets with controlled coverage values and counts for non-reference bases (see ‘Materials and Methods’ section). Our results show that LoFreq successfully exploits high-coverage (10 000×) and high-quality (Q40) sequencing data and calls variants with frequency as low as 0.05% under these conditions (Figure 1c). In contrast, the model-based approach in SNVer had a substantially higher detection limit (1%) that was unaffected by the quality of the data (Figure 1c). LoFreq’s ability to automatically tune its stringency thus allows it to adjust to local variations in sequencing quality and maximize its power to detect variants.
Robustness and false-positive rates
We further evaluated LoFreq and other variant-calling methods on several large sequencing datasets (viral, bacterial and human). In particular, we applied the methods to six technical replicates of DENV2 cell-culture isolates to measure the robustness and reproducibility of their results (see ‘Materials and Methods’ section). In this analysis, all methods did well in terms of reproducibility (% of SNVs called in at least two replicates) but LoFreq was the most sensitive among them, calling twice as many variants on average compared with SNVer (Table 2). For robustness, LoFreq results on the pooled data were nearly a superset of the individual calls (Supplementary Figure S1) and were as robust as the calls for SNVer (Table 2). The analysis here suggests that sensitivity is the major limiting factor for variant callers. In addition, the presence of SNVs seen in two or more replicates, but not in all six replicates (Supplementary Figure S1), suggests that sequencing coverage may be a bottleneck to fully capture true variants in the population.
Table 2.
Reproducibility and robustness of variant callers
| Reproducibility | Robustness | Average number of SNVs | |
|---|---|---|---|
| Breseq | 90.6 | 90.6 | 40.3 |
| SNVer | 99.4 | 97.1 | 27.7 |
| LoFreq | 95.7 | 96.5 | 57.5 |
Results were computed from dengue virus sequencing data for six TSV01 DENV2 replicates (see ‘Materials and Methods’ section). Reproducibility was computed as the percentage of SNVs in the replicate datasets that were seen in another replicate and robustness was computed as the percentage of SNVs in the replicates that were seen in the pooled dataset (obtained by combining the replicates; reproducible SNVs were included in the pooled calls).
Our results from simulated and real datasets suggest that LoFreq is a conservative as well as an ultra-sensitive variant caller. To characterize the false-positive rates for LoFreq further, we analyzed simulated as well as real data for an E. coli clone (560× coverage; see ‘Materials and Methods’ section). With over 4.6 million positions, the E. coli genome provides a larger test case and with simulated reads, LoFreq reported no false-positive calls. From the sequencing data, Breseq, LoFreq and SNVer reported 79, 2 and 0, potentially false-positive variants, respectively. It is possible that some of these SNVs are in fact real as it is known that ‘clonal’ bacterial populations evolve under laboratory conditions (27), maintaining variation even in equilibrium conditions in chemostats (39,40). Nevertheless, our results suggest that all three methods are conservative and that LoFreq has low false-positive rates (<0.00005% in this dataset).
While LoFreq was designed with applications to high-coverage sequencing of viral or bacterial genomes in mind, it is generic and fast enough to be applied to large genomes and low-coverage datasets as well. To highlight this, we analyzed whole-genome sequencing data for two gastric adenocarcinoma samples (∼30× coverage; (32)) with LoFreq and compared results with those from a commonly used genotype caller on human re-sequencing datasets, samtools (14) (using SNP quality threshold of 40 and identical filtering rules; see ‘Materials and Methods’ section). Interestingly, we found that LoFreq’s predictions were an almost perfect superset of those made by samtools (>99.7% of samtools predictions are shared with LoFreq), while >14% of LoFreq’s predictions were unique to it. Overall, LoFreq had similar precision as samtools (PPV = 99.8% for both methods and datasets), but higher sensitivity (∼99% versus ∼95% on both datasets) as measured on a SNP array (see ‘Materials and Methods’ section). These results provide the basis for applying LoFreq to sensitively and accurately call somatic variants from paired tumor/normal sequencing datasets (as discussed later) and note that this comparison is not meant to suggest that LoFreq can be used a genotype caller, as is the case for samtools.
Runtime efficiency
Similar to other variant callers, LoFreq’s runtime scales linearly with the size of the genome. Runtime increases as a function of the depth of coverage was similar between LoFreq and the fastest ad hoc methods (Goto et al. (38) and Wright et al. (23); the runtime here is dominated by the time to parse the data), with LoFreq being faster than Breseq (factor of 2) and more than an order of magnitude faster than SNVer at 10 000× coverage on the dengue virus genome (Supplementary Figure S2). Also, when compared with a naive version for computing exact P-values (see ‘Materials and Methods’ section), LoFreq’s pruned-dynamic-programming approach is also an order of magnitude faster (Supplementary Figure S2). On a single processor, the runtime for LoFreq was roughly 1 min on a dataset with 3700× coverage of the dengue virus genome (size = 10.7 kb), 1 h for 600× coverage of the E. coli genome (size = 4.6 Mbp) and 1 h and 20 min for 100× coverage of the human exome (size = 33 Mbp). Note that a parallel implementation of LoFreq is straightforward and would provide further runtime improvements for large genomes.
Experimental validation
Validation of low-frequency SNVs reported by variant callers is a challenging task and one that has not been attempted before in published methods (21–24,27,29). The recent availability of micro-fluidic digital PCR systems has made this more accessible but significant cost limitations and technical challenges remain for large-scale validation. As a proof-of-principle, we designed an experiment on the Fluidigm Digital Array™ (Fluidigm) based on 12 randomly chosen SNVs with discordant calls from LoFreq, SNVer and Breseq on two replicate dengue virus sequencing datasets (see ‘Materials and Methods’ section; Supplementary Figure S3). Strikingly, LoFreq predictions were validated in all experiments (nine out of nine valid calls; Figure 1d) with the rarest SNV detected by LoFreq being just <0.5% in frequency. Also, the frequencies estimated by LoFreq were within the experimentally predicted ranges in all cases. In contrast, Breseq was correct in seven out of nine predictions while SNVer was only able to correctly call two of the higher frequency variants (Figure 1d). Despite being the most conservative variant caller on the simulated datasets, SNVer had two false-positive calls on this dataset.
As an additional validation, we designed an experiment on the Sequenom MassArray iPLEX platform for testing 92 variant positions in 18 clinical and 4 cell-culture dengue virus samples (see ‘Materials and Methods’ section). In total, 1474 variant position/sample combinations were tested in this experiment. All calls made by Sequenom MassArray were also captured in the results from LoFreq (5/5) indicating that the Type II error rate for LoFreq is likely to be low. SNVer also detected all five calls and Breseq detected four out of five calls. These results highlight the fact that LoFreq calls (and SNVer’s) are likely to be at least as sensitive as this commonly used mass-spectrometry-based gold-standard for validating SNVs.
Application: tumor heterogeneity in gastric cancer
High-coverage exome and whole-genome sequencing datasets for matched tumor and normal samples from cancer patients are increasingly being generated to characterize cancer-specific somatic mutations that could play a driving role in tumorigenesis. Despite the known heterogeneity of tumors, calling of somatic variants is often limited to those in a majority of the cells or performed using ad hoc approaches (10,32,41). In addition, since tumor samples are often contaminated with normal tissue, the ability to robustly detect somatic mutations can be critical. In particular, results from a samtools analysis of 14 exome sequencing datasets for gastric tumor/normal paired samples from Zang et al. (32) revealed an asymmetric frequency distribution for the somatic SNVs called, suggesting that sample contamination can lead to significantly reduced sensitivity even with high sequencing coverage (Supplementary Figure S4). Re-analysis of these datasets with LoFreq helped to recover the full distribution (Figure 2), revealing the value of a systematic approach to call low-frequency somatic SNVs even when the goal is to only identify heterozygous and homozygous variants in high-coverage datasets.
Figure 2.

SNV calling in the presence of tumor sample heterogeneity. Germline and somatic variant frequencies for paired tumor-normal exome sequencing datasets from a custom samtools-based pipeline (32) are compared here with those from LoFreq (see ‘Materials and Methods’ section). As shown, while germline variants are consistently distributed around 50% (as expected for heterozygous variants), somatic variants are shifted to lower frequencies, likely due to contamination in the tumor sample from normal stromal tissue. Note that while samtools-based somatic calls appear ‘clipped’ at lower frequencies, LoFreq calls are symmetrically distributed as expected.
In addition, we also extended the somatic SNV analysis to the mitochondrial genome (∼3000× coverage) of the two whole-genome sequencing datasets from Zang et al. (32) analyzed earlier. Heteroplasmic mitochondrial DNA (mtDNA) mutations (present in only a fraction of the mtDNA) are often disease related and have been associated with tumor activity and cancer etiology (42,43). In particular, we identified two low-frequency somatic SNVs (3628:A>C at 8% and 12868:G>A at 10%) in NADH dehydrogenases 1 and 5 in patient NGC0092 which were non-synonymous and not listed in Mitomap (44). Somatic mtDNA mutations have been seen in a diverse set of cancers (45) and mutations in the NADH dehydrogenases, with their role in oxidative phosphorylation in the mitochondria (46), could potentially play an important role. Analogously, we identified one somatic SNV (8300:T>C at 25%) in the tRNA (Lys) gene in patient NGC0082, a known hotspot for mtDNA mutations and with several variants associated with myopathies (including one at position 8303 (47,48)). Rare heteroplasmic variations have previously been studied with targeted re-sequencing, followed by ad hoc filtering and detection rules, which have been shown to lead to irreproducible results (38). As shown here, the use of a sensitive variant caller on low-coverage whole-genome sequencing datasets provides a new approach to study this phenomenon.
Application: quasi-species evolution in clinical dengue virus samples
The sensitivity and robustness of LoFreq allow for the characterization of subtle shifts in the viral quasi species and we highlight this capability here by analyzing dengue virus sequencing datasets from a drug-trial study for the nucleoside-analog Balapiravir (31). Since the putative mechanism of action of the drug is to lead to mutations in cytosine bases (C > N mutagen by inhibition of CMP incorporation (49)), this dataset provides an ideal test-bed for studying quasi species dynamics of the dengue virus using samples from two time points (Table 3). In particular, an important conclusion of the original study was that despite encouraging results in in vitro studies, the drug did not work as expected in vivo (31). To investigate this aspect further, we compared the frequency of C > N mutations in the placebo group versus the drug group (see ‘Materials and Methods’ section) in dengue virus serotype 1, 2 and 3 (DENV1, DENV2 and DENV3) samples using LoFreq SNV calls (see ‘Materials and Methods’ section). Our results indicate that no significant changes can be seen in this frequency for any serotype (Mann–Whitney test, P-value > 0.3), providing a molecular basis for the in vivo conclusion of this study. Despite this, we do detect other changes in viral intra-host variation, including an increase in the number of SNVs at later time points, as expected (one-sided Mann–Whitney test P-value < 0.007 for DENV1 placebo group), as well as the disappearance of a mutational hotspot in NS3 (see ‘Materials and Methods’ section) at a later time point, possibly due to adaptation to the host’s immune response (Figure 3).
Figure 3.

Mutational hotspots and cold-spots in the dengue virus genome. Circos plots (56) of mutational hotspots and cold-spots derived from clinical (a) DENV1 and (b) DENV2 samples. Outer ring: gene annotation; inner ring: average coverage (log10-scaled). The inner bars mark mutational hotspots (red) and cold-spots (blue), which were derived from intra-host variations called by LoFreq (see ‘Materials and Methods’ section). Height of hotspots indicates how often the hotspot was found (sqrt(count)), whereas the height of cold-spots is fixed. The cold-spot in prM is shared between both serotypes. The last hotspot window in NS1 for the DENV2 samples was only found in pre-dose samples (Table 3) and disappears at later time points.
We further leveraged the SNVs called with LoFreq to systematically determine mutational cold-spots and hotspot regions in DENV1 and DENV2 (Figure 3; see ‘Materials and Methods’ section). Interestingly, these features differ substantially between the two serotypes, with the exception of a shared cold-spot in the membrane glycoprotein precursor protein (prM), known to be critical for assembly and secretion of all flavivirus virions (50). This region was only recently shown to be conserved across flaviviruses (51), though this conservation cannot be readily observed from an alignment of >2900 complete dengue virus genomes available in GenBank (Supplementary Figure S5). Comparison of clinical and cell-culture samples for DENV2 also revealed a shared hotspot in the known variable region of the 3-UTR (52), which has been shown to be dispensable for replication in some host cell types (53).
The value of cold-spot and hotspot analysis for identifying functionally important residues can also be seen from a structural perspective (Figure 4). For example, when viewed on the structure of the NS5 methyltransferase (Figure 4a), a first group of cold-spots consists of contiguous residues completely enclosing the binding site of the S-adenosyl-l-methionine (SAM) molecule that serves as a methyl donor for the reaction catalyzed by NS5 for capping of viral mRNAs, while a second group of cold-spots corresponds to the carboxyl end which acts as the linker region that connects to the NS5 polymerase domain. Similarly, a representation of cold-spots on the NS5 RNA-dependent RNA polymerase domain (Figure 4b) encompasses the critical GDD catalytic triad and also most of the template tunnel through which the viral RNA substrate enters or exits during replication. Another example showing cold-spots and hotspots on the NS3 serine protease and helicase, delineating potential interaction surfaces and key resides can be found in Supplementary Figure S6. Our results here suggest that sequencing and characterizing the intra-host variation in a relatively small set of samples can be sufficient for such analysis and reveal candidate drug targets (cold-spots) as well as fast-evolving regions in the viral genome (hotspots) that can be used to estimate haplotype diversity, avoiding the computational complexity of the problem (54). The availability of a sensitive variant caller such as LoFreq thus opens up the potential for the use of this ‘quasi species footprinting’ approach (akin to phylogenetic footprinting) to reveal functionally important regions in other viral genomes as well.
Figure 4.

Structural view of hot and cold-spots in the dengue virus genome. (a) Surface representation of dengue virus NS5 methyltransferase (PDB accession number 1R6A). The nucleoside-analog ribavirin 5′-triphosphate (RTP) is shown in blue and the by-product of S-adenosyl-l-methionine (SAM) after the transfer of a methyl group, S-adenosyl-l-homocysteine (SAH), is in red, both in ball-and-stick representation. Cold-spots are colored in violet. The first group of cold-spots consists of contiguous residues which completely enclose the binding site for SAM. SAM molecules serve as a methyl donor in the reaction catalyzed by the NS5 methyltransferase, which results in the capping of viral mRNAs. The second group of cold-spots corresponds to the carboxyl end of the NS5 methyltransferase which act as the linker region that connects the domain to the NS5 polymerase domain. (b) Surface representation of dengue virus NS5 RNA-dependent RNA polymerase (PDB accession number 2J7W). The GDD catalytic triad is colored in red whereas the cold-spots identified from SNV analysis are colored in violet. Cold-spots include the dengue virus NS5 RNA-dependent RNA polymerase GDD catalytic triad and also parts of the template tunnel through which the viral RNA substrate enters and exits during replication.
DISCUSSION
The exact, quality-aware approach employed in LoFreq is a statistically rigorous way of accounting for biases in sequencing errors while calling SNVs and is, in principle, sequencing technology independent (though our work here was focused on Illumina datasets). More complex models for sequencing errors can be constructed, that say account for correlations between adjacent bases, but would be technology specific and are likely to provide modest gains in sensitivity. The sensitivity/specificity tradeoff results here suggest that while model-based approaches (SNVer, Breseq) provide an improvement over ad hoc approaches, further significant gains in sensitivity are possible (without loss in specificity) using a quality-aware approach (LoFreq). Note that as LoFreq essentially distinguishes true variants from sequencing errors, it can also serve as a quality-aware ‘error-correction’ module for designing haplotype assemblers that can accommodate high-coverage sequencing datasets (54).
Our experimental validation results confirm that the rare variants discovered by LoFreq are indeed real (with the rarest being at a frequency of 0.5%) and that LoFreq may provide a sensitivity boost on even low-coverage whole-genome sequencing datasets. Despite not relying on any approximations, LoFreq is fast and generic enough to be applied to high-coverage human whole-exome and genome sequencing datasets and thus has applications beyond the analysis of low-frequency variants in viral and microbial sequencing datasets. The ability to call rare somatic variants, in particular, can be valuable in genomic studies of tumor heterogeneity and evolution as well as in emerging applications such as in tumor monitoring by sequencing of cell-free DNA (55). LoFreq’s sensitivity can help detect subtle shifts in cell populations and thus be valuable for sequencing-based monitoring and evolutionary studies of viral, bacterial and cancer samples.
The ability to call rare variants is dictated in general by both sequencing quality and read coverage and LoFreq allows the user to exploit local variations in both parameters. More extensive simulations of the sort depicted in Figure 1c can be employed by a user to help guide experimental design when the goal is to capture SNVs at a certain frequency. LoFreq is based on calibrated quality values that are commonly generated from sequencing data and where this is not feasible, conservative quality values or an estimate of average quality values (as used in LoFreq-NQ; see ‘Materials and Methods’ section) can be employed with an accompanying loss in sensitivity and specificity, respectively.
While sequencing quality is a key for correctly calling SNVs, indel variants are more likely to be influenced by alignment quality. LoFreq’s variant-calling model could be extended to indels (and other classes of variants) if the probability of error in a variant-supporting read can be encoded in a suitably computed quality value. Also, in calling SNVs, LoFreq requires unique read mappings and high-quality alignments, similar to other variant callers. Calling rare SNVs in regions with non-unique mappings and alignment uncertainty represents a significant technical challenge and is a potential direction for future extensions to LoFreq.
SUPPLEMENTARY DATA
Supplementary Data are available at NAR Online: Supplementary Figures 1–6.
FUNDING
Funding for open access charge: Agency for Science Technology and Research (A*STAR), Singapore.
Conflict of interest statement. None declared.
Supplementary Material
ACKNOWLEDGMENTS
We thank the authors of SNVer and Breseq for help with running their programs. We also thank Drs Daniel Chin, Hans Bitter, Lore Gruenbaum, Erik Rasmussen and Tom Chu at Hoffmann-La Roche Inc. as well as the PP22799 study team for the clinical Dengue samples. Drs Swaine Chen and Shyam Prabhakar provided insightful comments and suggestions on a draft of this article. M.L.H and N.N. conceived and designed the project. P.P.K.A. conducted library preparation and sequencing of dengue samples. C.C.K., C.H.W. and P.P.K.A. designed and conducted the validation experiments. D.B. analyzed the gastric cancer datasets. G.H.T.Y. implemented LoFreq-NQ and A.W. implemented LoFreq. A.W. analyzed all other datasets. A.W. and N.N. wrote the draft manuscript. All authors contributed to the final manuscript.
REFERENCES
- 1.Eigen M. Selforganization of matter and the evolution of biological macromolecules. Die Naturwissenschaften. 1971;58:465–523. doi: 10.1007/BF00623322. [DOI] [PubMed] [Google Scholar]
- 2.Thai KTD, Henn MR, Zody MC, Tricou V, Nguyet NM, Charlebois P, Lennon NJ, Green L, de Vries PJ, Hien TT, et al. High-resolution analysis of intrahost genetic diversity in dengue virus serotype 1 infection identifies mixed infections. J. Virol. 2012;86:835–843. doi: 10.1128/JVI.05985-11. [DOI] [PMC free article] [PubMed] [Google Scholar]
- 3.Lee HH, Molla MN, Cantor CR, Collins JJ. Bacterial charity work leads to population-wide resistance. Nature. 2010;467:82–85. doi: 10.1038/nature09354. [DOI] [PMC free article] [PubMed] [Google Scholar]
- 4.Toprak E, Veres A, Michel J-B, Chait R, Hartl DL, Kishony R. Evolutionary paths to antibiotic resistance under dynamically sustained drug selection. Nat. Genet. 2012;44:101–105. doi: 10.1038/ng.1034. [DOI] [PMC free article] [PubMed] [Google Scholar]
- 5.Blaby IK, Lyons BJ, Wroclawska-Hughes E, Phillips GCF, Pyle TP, Chamberlin SG, Benner SA, Lyons TJ, Crécy-Lagard V de, Crécy E de. Experimental evolution of a facultative thermophile from a mesophilic ancestor. Appl. Environ. Microbiol. 2012;78:144–155. doi: 10.1128/AEM.05773-11. [DOI] [PMC free article] [PubMed] [Google Scholar]
- 6.Ding L, Ellis MJ, Li S, Larson DE, Chen K, Wallis JW, Harris CC, McLellan MD, Fulton RS, Fulton LL, et al. Genome remodelling in a basal-like breast cancer metastasis and xenograft. Nature. 2010;464:999–1005. doi: 10.1038/nature08989. [DOI] [PMC free article] [PubMed] [Google Scholar]
- 7.Gerlinger M, Rowan AJ, Horswell S, Larkin J, Endesfelder D, Gronroos E, Martinez P, Matthews N, Stewart A, Tarpey P, et al. Intratumor heterogeneity and branched evolution revealed by multiregion sequencing. New Eng. J. Med. 2012;366:883–892. doi: 10.1056/NEJMoa1113205. [DOI] [PMC free article] [PubMed] [Google Scholar]
- 8.Harismendy O, Schwab RB, Bao L, Olson J, Rozenzhak S, Kotsopoulos SK, Pond S, Crain B, Chee MS, Messer K, et al. Detection of low prevalence somatic mutations in solid tumors with ultra-deep targeted sequencing. Genome Biol. 2011;12:R124. doi: 10.1186/gb-2011-12-12-r124. [DOI] [PMC free article] [PubMed] [Google Scholar]
- 9.Inda M-del-M, Bonavia R, Mukasa A, Narita Y, Sah DWY, Vandenberg S, Brennan C, Johns TG, Bachoo R, Hadwiger P, et al. Tumor heterogeneity is an active process maintained by a mutant EGFR-induced cytokine circuit in glioblastoma. Genes Dev. 2010;24:1731–1745. doi: 10.1101/gad.1890510. [DOI] [PMC free article] [PubMed] [Google Scholar]
- 10.Ding L, Ley TJ, Larson DE, Miller CA, Koboldt DC, Welch JS, Ritchey JK, Young MA, Lamprecht T, McLellan MD, et al. Clonal evolution in relapsed acute myeloid leukaemia revealed by whole-genome sequencing. Nature. 2012;481:506–510. doi: 10.1038/nature10738. [DOI] [PMC free article] [PubMed] [Google Scholar]
- 11.Suzuki S, Ono N, Furusawa C, Ying B-W, Yomo T. Comparison of sequence reads obtained from three next-generation sequencing platforms. PLoS One. 2011;6:e19534. doi: 10.1371/journal.pone.0019534. [DOI] [PMC free article] [PubMed] [Google Scholar]
- 12.Minoche AE, Dohm JC, Himmelbauer H. Evaluation of genomic high-throughput sequencing data generated on Illumina HiSeq and Genome Analyzer systems. Genome Biol. 2011;12:R112. doi: 10.1186/gb-2011-12-11-r112. [DOI] [PMC free article] [PubMed] [Google Scholar]
- 13.Nakamura K, Oshima T, Morimoto T, Ikeda S, Yoshikawa H, Shiwa Y, Ishikawa S, Linak MC, Hirai A, Takahashi H, et al. Sequence-specific error profile of Illumina sequencers. Nucleic Acids Res. 2011;39:e90. doi: 10.1093/nar/gkr344. [DOI] [PMC free article] [PubMed] [Google Scholar]
- 14.Li H, Handsaker B, Wysoker A, Fennell T, Ruan J, Homer N, Marth G, Abecasis G, Durbin R. The Sequence alignment/map format and SAMtools. Bioinformatics. 2009;25:2078–2079. doi: 10.1093/bioinformatics/btp352. [DOI] [PMC free article] [PubMed] [Google Scholar]
- 15.McKenna A, Hanna M, Banks E, Sivachenko A, Cibulskis K, Kernytsky A, Garimella K, Altshuler D, Gabriel S, Daly M, et al. The Genome Analysis Toolkit: a MapReduce framework for analyzing next-generation DNA sequencing data. Genome Res. 2010;20:1297–1303. doi: 10.1101/gr.107524.110. [DOI] [PMC free article] [PubMed] [Google Scholar]
- 16.Nielsen R, Paul JS, Albrechtsen A, Song YS. Genotype and SNP calling from next-generation sequencing data. Nat. Rev. Genet. 2011;12:443–451. doi: 10.1038/nrg2986. [DOI] [PMC free article] [PubMed] [Google Scholar]
- 17.Bansal V. A statistical method for the detection of variants from next-generation resequencing of DNA pools. Bioinformatics (Oxford, England) 2010;26:i318–i324. doi: 10.1093/bioinformatics/btq214. [DOI] [PMC free article] [PubMed] [Google Scholar]
- 18.Druley TE, Vallania FLM, Wegner DJ, Varley KE, Knowles OL, Bonds JA, Robison SW, Doniger SW, Hamvas A, Cole FS, et al. Quantification of rare allelic variants from pooled genomic DNA. Nat. Methods. 2009;6:263–265. doi: 10.1038/nmeth.1307. [DOI] [PMC free article] [PubMed] [Google Scholar]
- 19.Vallania FLM, Druley TE, Ramos E, Wang J, Borecki I, Province M, Mitra RD. High-throughput discovery of rare insertions and deletions in large cohorts. Genome Res. 2010;20:1711–1718. doi: 10.1101/gr.109157.110. [DOI] [PMC free article] [PubMed] [Google Scholar]
- 20.Koboldt DC, Chen K, Wylie T, Larson DE, McLellan MD, Mardis ER, Weinstock GM, Wilson RK, Ding L. VarScan: variant detection in massively parallel sequencing of individual and pooled samples. Bioinformatics. 2009;25:2283–2285. doi: 10.1093/bioinformatics/btp373. [DOI] [PMC free article] [PubMed] [Google Scholar]
- 21.Cordey S, Junier T, Gerlach D, Gobbini F, Farinelli L, Zdobnov EM, Winther B, Tapparel C, Kaiser L. Rhinovirus genome evolution during experimental human infection. PLoS One. 2010;5:e10588. doi: 10.1371/journal.pone.0010588. [DOI] [PMC free article] [PubMed] [Google Scholar]
- 22.Eckerle LD, Becker MM, Halpin RA, Li K, Venter E, Lu X, Scherbakova S, Graham RL, Baric RS, Stockwell TB, et al. Infidelity of SARS-CoV Nsp14-exonuclease mutant virus replication is revealed by complete genome sequencing. PLoS Pathog. 2010;6:e1000896. doi: 10.1371/journal.ppat.1000896. [DOI] [PMC free article] [PubMed] [Google Scholar]
- 23.Wright CF, Morelli MJ, Thébaud G, Knowles NJ, Herzyk P, Paton DJ, Haydon DT, King DP. Beyond the consensus: dissecting within-host viral population diversity of foot-and-mouth disease virus by using next-generation genome sequencing. J. Virol. 2011;85:2266–2275. doi: 10.1128/JVI.01396-10. [DOI] [PMC free article] [PubMed] [Google Scholar]
- 24.Nasu A, Marusawa H, Ueda Y, Nishijima N, Takahashi K, Osaki Y, Yamashita Y, Inokuma T, Tamada T, Fujiwara T, et al. Genetic heterogeneity of hepatitis C virus in association with antiviral therapy determined by ultra-deep sequencing. PLoS One. 2011;6:e24907. doi: 10.1371/journal.pone.0024907. [DOI] [PMC free article] [PubMed] [Google Scholar]
- 25.Lauring AS, Andino R. Quasispecies theory and the behavior of RNA viruses. PLoS Pathog. 2010;6:e1001005. doi: 10.1371/journal.ppat.1001005. [DOI] [PMC free article] [PubMed] [Google Scholar]
- 26.Neverov A, Chumakov K. Massively parallel sequencing for monitoring genetic consistency and quality control of live viral vaccines. Proc. Natl Acad. Sci. USA. 2010;107:20063–20068. doi: 10.1073/pnas.1012537107. [DOI] [PMC free article] [PubMed] [Google Scholar]
- 27.Barrick JE, Yu DS, Yoon SH, Jeong H, Oh TK, Schneider D, Lenski RE, Kim JF. Genome evolution and adaptation in a long-term experiment with Escherichia coli. Nature. 2009;461:1243–1247. doi: 10.1038/nature08480. [DOI] [PubMed] [Google Scholar]
- 28.Barrick JE, Lenski RE. Genome-wide mutational diversity in an evolving population of Escherichia coli. Cold Spring Harb. Symp. Quant. Biol. 2009;74:119–129. doi: 10.1101/sqb.2009.74.018. [DOI] [PMC free article] [PubMed] [Google Scholar]
- 29.Wei Z, Wang W, Hu P, Lyon GJ, Hakonarson H. SNVer: a statistical tool for variant calling in analysis of pooled or individual next-generation sequencing data. Nucleic Acids Res. 2011;39:e132. doi: 10.1093/nar/gkr599. [DOI] [PMC free article] [PubMed] [Google Scholar]
- 30.Macalalad AR, Zody MC, Charlebois P, Lennon NJ, Newman RM, Malboeuf CM, Ryan EM, Boutwell CL, Power KA, Brackney DE, et al. Highly sensitive and specific detection of rare variants in mixed viral populations from massively parallel sequence data. PLoS Comput. Biol. 2012;8:e1002417. doi: 10.1371/journal.pcbi.1002417. [DOI] [PMC free article] [PubMed] [Google Scholar]
- 31.Nguyen NM, Tran CNB, Phung LK, Duong KTH, Huynh H le A, Farrar J, Nguyen QTH, Tran HT, Nguyen CVV, Merson L, et al. A randomized, double-blind placebo controlled trial of balapiravir, a polymerase inhibitor, in adult dengue patients. J. Infect. Dis. 2012 doi: 10.1093/infdis/jis470. August 30 (doi:10.1093/infdis/jis470; epub ahead of print) [DOI] [PMC free article] [PubMed] [Google Scholar]
- 32.Zang ZJ, Cutcutache I, Poon SL, Zhang SL, McPherson JR, Tao J, Rajasegaran V, Heng HL, Deng N, Gan A, et al. Exome sequencing of gastric adenocarcinoma identifies recurrent somatic mutations in cell adhesion and chromatin remodeling genes. Nat. Genet. 2012;44:570–574. doi: 10.1038/ng.2246. [DOI] [PubMed] [Google Scholar]
- 33.Richter D, Ott F, Auch A, Schmid R. MetaSim: a sequencing simulator for genomics and metagenomics. PLoS One. 2008;3:e3373. doi: 10.1371/journal.pone.0003373. [DOI] [PMC free article] [PubMed] [Google Scholar]
- 34.Dempster AP, Dempster AP, Laird NM, Rubin DB. Maximum likelihood from incomplete data via the EM algorithm. J. Roy. Stat. Soc. B. 1977;39:1–38. [Google Scholar]
- 35.Weese D, Emde A-K, Rausch T, Döring A, Reinert K. RazerS—fast read mapping with sensitivity control. Genome Res. 2009;19:1646–1654. doi: 10.1101/gr.088823.108. [DOI] [PMC free article] [PubMed] [Google Scholar]
- 36.Li H, Durbin R. Fast and accurate short read alignment with Burrows–Wheeler transform. Bioinformatics. 2009;25:1754–1760. doi: 10.1093/bioinformatics/btp324. [DOI] [PMC free article] [PubMed] [Google Scholar]
- 37.Andrews RM, Kubacka I, Chinnery PF, Lightowlers RN, Turnbull DM, Howell N. Reanalysis and revision of the Cambridge reference sequence for human mitochondrial DNA. Nat. Genet. 1999;23:147. doi: 10.1038/13779. [DOI] [PubMed] [Google Scholar]
- 38.Goto H, Dickins B, Afgan E, Paul IM, Taylor J, Makova KD, Nekrutenko A. Dynamics of mitochondrial heteroplasmy in three families investigated via a repeatable re-sequencing study. Genome Biol. 2011;12:R59. doi: 10.1186/gb-2011-12-6-r59. [DOI] [PMC free article] [PubMed] [Google Scholar]
- 39.Maharjan R, Seeto S, Notley-McRobb L, Ferenci T. Clonal adaptive radiation in a constant environment. Science. 2006;313:514–517. doi: 10.1126/science.1129865. [DOI] [PubMed] [Google Scholar]
- 40.Beardmore RE, Gudelj I, Lipson DA, Hurst LD. Metabolic trade-offs and the maintenance of the fittest and the flattest. Nature. 2011;472:342–346. doi: 10.1038/nature09905. [DOI] [PubMed] [Google Scholar]
- 41.Wu X, Northcott PA, Dubuc A, Dupuy AJ, Shih DJH, Witt H, Croul S, Bouffet E, Fults DW, Eberhart CG, et al. Clonal selection drives genetic divergence of metastatic medulloblastoma. Nature. 2012;482:529–533. doi: 10.1038/nature10825. [DOI] [PMC free article] [PubMed] [Google Scholar]
- 42.Brandon M, Baldi P, Wallace DC. Mitochondrial mutations in cancer. Oncogene. 2006;25:4647–4662. doi: 10.1038/sj.onc.1209607. [DOI] [PubMed] [Google Scholar]
- 43.Kloss-Brandstätter A, Schäfer G, Erhart G, Hüttenhofer A, Coassin S, Seifarth C, Summerer M, Bektic J, Klocker H, Kronenberg F. Somatic mutations throughout the entire mitochondrial genome are associated with elevated PSA levels in prostate cancer patients. Am. J. Hum. Genet. 2010;87:802–812. doi: 10.1016/j.ajhg.2010.11.001. [DOI] [PMC free article] [PubMed] [Google Scholar]
- 44.Ruiz-Pesini E, Lott MT, Procaccio V, Poole JC, Brandon MC, Mishmar D, Yi C, Kreuziger J, Baldi P, Wallace DC. An enhanced MITOMAP with a global mtDNA mutational phylogeny. Nucleic Acids Res. 2007;35:D823–D828. doi: 10.1093/nar/gkl927. [DOI] [PMC free article] [PubMed] [Google Scholar]
- 45.Chatterjee A, Dasgupta S, Sidransky D. Mitochondrial subversion in cancer. Cancer Prev. Res. 2011;4:638–654. doi: 10.1158/1940-6207.CAPR-10-0326. [DOI] [PMC free article] [PubMed] [Google Scholar]
- 46.Nakamaru-Ogiso E, Han H, Matsuno-Yagi A, Keinan E, Sinha SC, Yagi T, Ohnishi T. The ND2 subunit is labeled by a photoaffinity analogue of asimicin, a potent complex I inhibitor. FEBS Lett. 2010;584:883–888. doi: 10.1016/j.febslet.2010.01.004. [DOI] [PMC free article] [PubMed] [Google Scholar]
- 47.Silvestri G, Santorelli FM, Shanske S, Whitley CB, Schimmenti LA, Smith SA, DiMauro S. A new mtDNA mutation in the tRNA(Leu(UUR)) gene associated with maternally inherited cardiomyopathy. Hum. Mutat. 1994;3:37–43. doi: 10.1002/humu.1380030107. [DOI] [PubMed] [Google Scholar]
- 48.Noer AS, Sudoyo H, Lertrit P, Thyagarajan D, Utthanaphol P, Kapsa R, Byrne E, Marzuki S. A tRNA(Lys) mutation in the mtDNA is the causal genetic lesion underlying myoclonic epilepsy and ragged-red fiber (MERRF) syndrome. Am. J. Hum. Genet. 1991;49:715–722. [PMC free article] [PubMed] [Google Scholar]
- 49.Klumpp K, Lévêque V, Le Pogam S, Ma H, Jiang W-R, Kang H, Granycome C, Singer M, Laxton C, Hang JQ, et al. The novel nucleoside analog R1479 (4′-azidocytidine) is a potent inhibitor of NS5B-dependent RNA synthesis and hepatitis C virus replication in cell culture. J. Biol. Chem. 2006;281:3793–3799. doi: 10.1074/jbc.M510195200. [DOI] [PubMed] [Google Scholar]
- 50.Li L, Lok S-M, Yu I-M, Zhang Y, Kuhn RJ, Chen J, Rossmann MG. The flavivirus precursor membrane-envelope protein complex: structure and maturation. Science. 2008;319:1830–1834. doi: 10.1126/science.1153263. [DOI] [PubMed] [Google Scholar]
- 51.Yoshii K, Igarashi M, Ichii O, Yokozawa K, Ito K, Kariwa H, Takashima I. A conserved region in the prM protein is a critical determinant in the assembly of flavivirus particles. J. Gen. Virol. 2012;93:27–38. doi: 10.1099/vir.0.035964-0. [DOI] [PubMed] [Google Scholar]
- 52.Shurtleff AC, Beasley DW, Chen JJ, Ni H, Suderman MT, Wang H, Xu R, Wang E, Weaver SC, Watts DM, et al. Genetic variation in the 3′ non-coding region of dengue viruses. Virology. 2001;281:75–87. doi: 10.1006/viro.2000.0748. [DOI] [PubMed] [Google Scholar]
- 53.Alvarez DE, De Lella Ezcurra AL, Fucito S, Gamarnik AV. Role of RNA structures present at the 3′-UTR of dengue virus on translation, RNA synthesis, and viral replication. Virology. 2005;339:200–212. doi: 10.1016/j.virol.2005.06.009. [DOI] [PubMed] [Google Scholar]
- 54.Zagordi O, Bhattacharya A, Eriksson N, Beerenwinkel N. ShoRAH: estimating the genetic diversity of a mixed sample from next-generation sequencing data. BMC Bioinformatics. 2011;12:119. doi: 10.1186/1471-2105-12-119. [DOI] [PMC free article] [PubMed] [Google Scholar]
- 55.Forshew T, Murtaza M, Parkinson C, Gale D, Tsui DWY, Kaper F, Dawson S-J, Piskorz AM, Jimenez-Linan M, Bentley D, et al. Noninvasive identification and monitoring of cancer mutations by targeted deep sequencing of plasma DNA. Sci. Transl. Med. 2012;4:136ra68. doi: 10.1126/scitranslmed.3003726. [DOI] [PubMed] [Google Scholar]
- 56.Krzywinski M, Schein J, Birol I, Connors J, Gascoyne R, Horsman D, Jones SJ, Marra MA. Circos: an information aesthetic for comparative genomics. Genome research. 2009;19:1639–45. doi: 10.1101/gr.092759.109. [DOI] [PMC free article] [PubMed] [Google Scholar]
Associated Data
This section collects any data citations, data availability statements, or supplementary materials included in this article.