Abstract
As part of the DNA Sequencing Research Group of the Association of Biomolecular Resource Facilities, we have tested the reproducibility of the Roche/454 GS-FLX Titanium System at five core facilities. Experience with the Roche/454 system ranged from <10 to >340 sequencing runs performed. All participating sites were supplied with an aliquot of a common DNA preparation and were requested to conduct sequencing at a common loading condition. The evaluation of sequencing yield and accuracy metrics was assessed at a single site. The study was conducted using a laboratory strain of the Dutch elm disease fungus Ophiostoma novo-ulmi strain H327, an ascomycete, vegetatively haploid fungus with an estimated genome size of 30–50 Mb. We show that the Titanium System is reproducible, with some variation detected in loading conditions, sequencing yield, and homopolymer length accuracy. We demonstrate that reads shorter than the theoretical minimum length are of lower overall quality and not simply truncated reads. The O. novo-ulmi H327 genome assembly is 31.8 Mb and is comprised of eight chromosome-length linear scaffolds, a circular mitochondrial conti of 66.4 kb, and a putative 4.2-kb linear plasmid. We estimate that the nuclear genome encodes 8613 protein coding genes, and the mitochondrion encodes 15 genes and 26 tRNAs.
Keywords: massively parallel DNA sequencing, fungal genomics, Ophiostoma novo-ulmi
INTRODUCTION
Massively parallel sequencing technologies have dramatically sped up the process of very high-throughput sequencing at reduced costs, thus enabling genomic research projects to be conducted across the full spectrum of the biomedical and life sciences. Within these projects, the genome sequencing component is often conducted at a core facility that prepares and sequences the DNA sample and delivers a genomic read set and/or genome assembly for annotation and further studies. Ideally, the genomic data produced should be of consistent and high quality regardless of the individual facility, allowing investigators to select a facility or facilities based on the needs of the project.
The DNA Sequencing Research Group (DSRG) of the Association of Biomolecular Resource Facilities (ABRF) fosters collaborations between core genomics facilities, including the design and implementation of studies to assess the capabilities of its member laboratories and to promote excellence in DNA sequencing. In this study, the DSRG sought to assess the performance of the Roche/454 GS-FLX Titanium sequencing platform1 across multiple core facilities to determine the reproducibility of this instrument, its protocols, and reagents. To avoid additional experimental variation as a result of the use of different samples and sample preparation protocols, we prepared a single DNA sample and distributed aliquots to the participating facilities. As part of the study, we chose to sequence the genome of strain H327 of O. novo-ulmi, the fungal pathogen responsible for the current pandemic of Dutch elm disease. O. novo-ulmi is a vegetatively haploid ascomycetous fungus with an estimated genome size of 30–50 Mb.2 As very few fungal genomes have been sequenced—none from the Ophiostoma/Ceratocystis group—none of the sequencing teams had previous experience from which to draw, and all groups relied completely on standard protocols. Further, given the 30- to 50-Mb genome size, the sample was an appropriate candidate, where multiple runs would be required to gain a high level of genome coverage. Also, as a de novo sequencing project, the genome assembly of this organism would provide new biological knowledge in addition to our technical evaluations.
In this study, we present an assessment of the Roche/454 GS-FLX Titanium sequencing platform across five genomic core facilities, including comparisons of sequencing throughput, accuracy, and coverage. In addition, we present the genome assembly of O. novo-ulmi H327 for use by the fungal and tree pathogen research communities.
MATERIALS AND METHODS
Isolation of O. novo-ulmi H327
O. novo-ulmi subsp. novo-ulmi strain H327 was isolated from an infected elm in the city of Bratislava, Slovakia, in 1979 by H. Jamnicky. This highly aggressive strain has been used for over 25 years in genetic and genomic studies of Dutch elm disease.3,4 Total genomic DNA (40 μg) suspended in Tris/EDTA (TE; pH 8.0) at a concentration of 1 μg/ul was extracted from a yeast-like cell culture of strain H327 as described previously.5
Genome Sequencing, Assembly, and Annotation
Prior to sending aliquots to all facilities, a trial fragment library was generated and sequenced at one site. Following confirmation of the suitability of the sample, a larger scale fragment library was created, divided into aliquots, and sent to all participants. Additionally, a single 8-kb, paired-end library was generated and sequenced at one site. At all facilities, sequencing was performed using the Roche/454 GS-FLX Titanium System, following the manufacturer's protocols. Fragment and paired-end reads were collected at a single site and assembled using Newbler version 2.3. The assembly was further improved manually and with the aid of custom Python scripts. Gene predictions on the linear scaffolds were performed using GeneMark-ES version 2.3.6 Expressed sequence tag (EST) sequences7 were aligned to the genome assembly using Basic Local Alignment Search Tool (BLAST)-Like Alignment Tool (BLAT).8
Sequencing Yield and Accuracy Analyses
Sequence reads were aligned to the genome assembly using BLAT. All analyses were conducted using custom Python scripts. This included generating random pyrosequencing reads, cataloguing homopolymers from the genome sequences, and determining homopolymer accuracy and substitution error rates from the read sequence alignments. Figures were generated using the Matplotlib Python module or the R statistical package.
RESULTS
DNA Sample Preparation and Facility Experience
A single colony culture of O. novo-ulmi strain H327 was grown and had its DNA extracted following protocols described previously.5 DNA (40 μg), suspended in 40 μl TE (pH 8.0), was evaluated by 0.8% agarose gel electrophoresis and spectrometry to confirm that the DNA was of high MW (>23 kb), with no visible appearance of residual RNA and an absorbance at 260 nm:280 nm ratio of >1.9. Five micrograms of DNA was used, following the manufacturer's protocols, to generate a preliminary GS-FLX Titanium fragment library that was sequenced on one-half of a PicoTiter Plate (PTP). The observation of high-quality sequences (peak read length >400 nt, >225,000 reads) indicated that the sample was suitable for further sequencing. Aliquots of a fresh preparation of size-selected ssDNA (verified by BioAnalyzer analysis) were sent to four additional genomics core facilities, where each facility sequenced a full PTP plate, with at least one of the halves loaded at a common concentration of three copies/bead (cpb). A third preparation for an 8-kb paired-end library was made from the same DNA source and sequenced at one site.
DNA sequencing was conducted at five separate facilities, identified as A, B, C, D, and E. The size and experience of the sequencing teams ranged from technical staffs of two (A and D) to seven full-time equivalents (E) and laboratory experience from five (D) to 345 runs (E), respectively (Table 1). The runs performed on the instruments used in this study ranged from five (D) to 197 (E). All sequence data were returned to one facility for centralized analysis.
TABLE 1.
Summary of Participating Core Facilities and Sequencing Yield
| Facility | Team size | Team runs | Instrument runs | Region | Peak length | All reads |
Reads >397 nt |
||
|---|---|---|---|---|---|---|---|---|---|
| Read count (%Δ)a | Bases (%Δ)a | Read count (%)b | Bases (%)b | ||||||
| A | 2 | 22 | 22 | 1 | 481 | 601,679 (−10.55) | 238,617,862 (−10.45) | 398,245 (66.19) | 189,657,001 (79.48) |
| 2 | 477 | 596,503 (−2.62) | 235,886,896 (−1.52) | 395,681 (66.33) | 187,629,648 (79.54) | ||||
| 1 and 2 | 481 | 1,198,182 (−6.77) | 474,504,758 (−6.22) | 793,926 (66.26) | 377,286,649 (79.51) | ||||
| B | 5 | 172 | 163 | 1 | 481 | 679,997 (1.10) | 273,067,587 (2.48) | 464,393 (68.29) | 222,011,763 (81.30) |
| 2 | 475 | 625,654 (2.14) | 243,215,385 (1.54) | 385,954 (61.69) | 182,799,792 (75.16) | ||||
| 1 and 2 | 481 | 1,305,651 (1.59) | 516,282,972 (2.04) | 850,347 (65.13) | 404,811,555 (78.41) | ||||
| C | 3 | 128 | 128 | 1 | 481 | 791,274 (17.64) | 296,820,523 (11.4) | 480,925 (60.78) | 227,892,482 (76.78) |
| 2 | 477 | 774,951 (26.51) | 283,485,969 (18.35) | 444,718 (57.39) | 209,747,097 (73.99) | ||||
| 1 and 2 | 477 | 1,566,225 (21.87) | 580,306,492 (14.69) | 925,643 (59.10) | 437,639,579 (75.42) | ||||
| D | 2 | 5 | 5 | 1 | 478 | 743,160 (10.49) | 308,348,892 (15.72) | 536,017 (72.13) | 256,322,790 (83.13) |
| 2 | 478 | 563,799 (−7.96) | 239,814,876 (0.12) | 425,479 (75.47) | 204,793,870 (85.40) | ||||
| 1 and 2 | 478 | 1,306,959 (1.70) | 548,163,768 (8.34) | 961,496 (73.57) | 461,116,660 (84.12) | ||||
| E | 7 | 345 | 197 | 1 | 475 | 546,931 (−18.69) | 215,406,359 (−19.16) | 346,190 (63.30) | 163,197,131 (75.76) |
| 2 | 473 | 501,900 (−18.07) | 195,249,283 (−18.49) | 309,626 (61.69) | 145,532,130 (74.54) | ||||
| 1 and 2 | 473 | 1,048,831 (−18.39) | 410,655,642 (−18.84) | 655,816 (62.53) | 308,729,261 (75.18) | ||||
Percent deviation from average across all facilities for that category.
Percent of total reads or bases for that region.
Sequencing Yield and Quality
For each facility, we report the total number of reads and the number of bases sequenced for each region of a two-region PTP (Table 1). Every facility exceeded the minimum yield threshold (450,000 reads, 180 Mb sequence, >400 nt peak read length for a full PTP). On a full PTP basis, the number of reads and bases sequenced had an average of 1.28 million reads and 506 Mb and ranged from 1.05 million reads and 411 Mb (E) to 1.57 million and 580 Mb (C; Table 1). In terms of total reads, Facility C was the top performer, with 21% more reads and 15% more bases sequenced than the average. Facility E ranked fifth, with 18% less reads and bases sequenced. With the exception of Facility D (which intentionally attempted a second loading different from 3 cpb), the read-count differences between the two one-half PTPs were within 10% (Table 1). The average peak read length was 478 and varied from 473 nt (E) to 481 nt (A, B) between facilities.
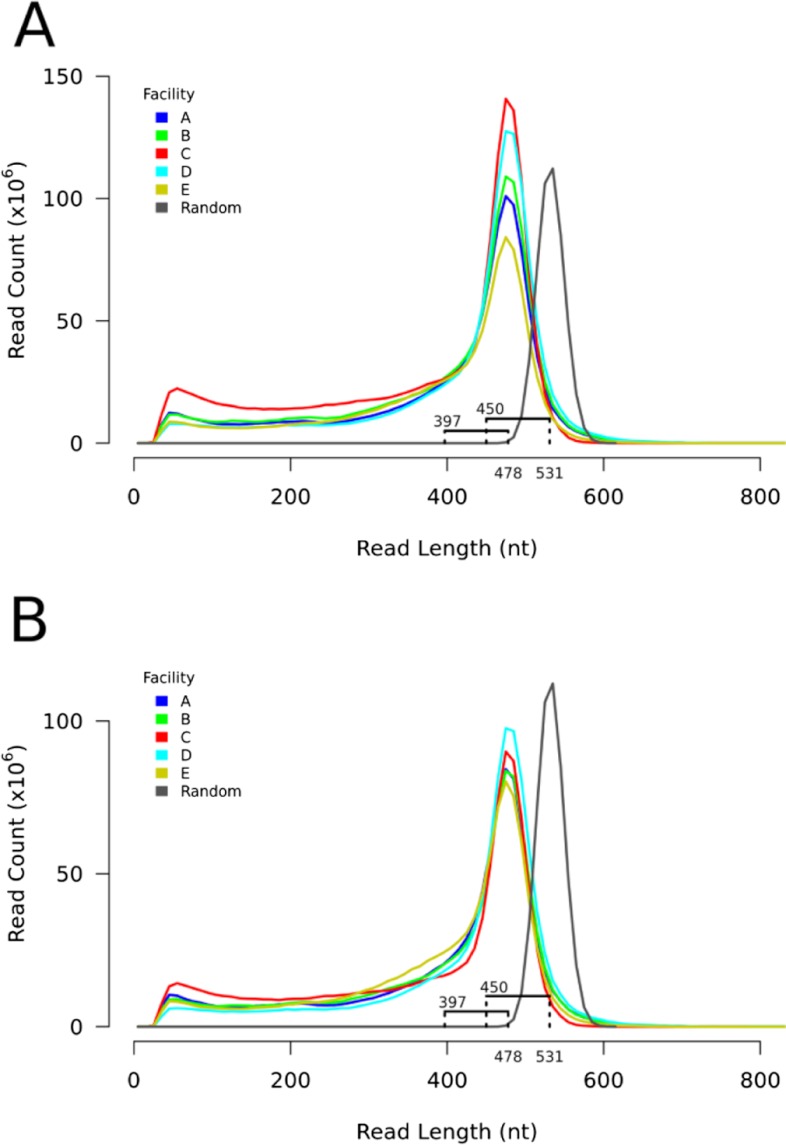
To compare sequence yield and read length with a theoretical optimum, we bioinformatically generated 500,000 random DNA sequences of 1200 nt in length and subjected them to in silico pyrosequencing (200 cycles). These random theoretical reads had a peak read length of 531 nt (2.6 in silico incorporations/cycle), and the shortest possible read was 450 nt (Fig. 1) Our lower observed peak read length for the experimental data (478 nt; Table 1 and Fig. 1A) was a result of a combination of nonrandom genome base composition, the trimming of low-quality sequence on the 3′ end of each read, and the excision of the molecular identifier tag on the 5′ end (data not shown). With the use of the calculated difference (81 nt) in peak read length to shortest read length for the theoretical read set, we thus estimated that the lower boundary for a completely successful read from the O. novo-ulmi genome to be ∼397 nt (Fig. 1A). Therefore, reads below 397 nt do not represent fully successful sequencing events and must be truncated as a result of short DNA templates, failed sequencing reactions, and/or other phenomena. With the use of this threshold, we observed that >60% of reads from four facilities (A, B, D, and E) meet our criteria of full length (Table 1). Contrary to its top ranking in overall sequence yield, Facility C's full-length performance was below that of other facilities, with only 50% of reads being full- length (Table 1). This is also visually evident as a larger tail of short reads for Facility C (Fig. 1A). Facility D had the highest proportion of reads (74%) of full length (Table 1). When we normalized yields by selecting 1 million reads randomly from each facility, we continued to show that whereas peak heights were very consistent, the ratio of truncated:full-length reads varied among facilities (Fig. 1B).
FIGURE 1.
Core facility read length distribution. (A) Total read length distribution for the five core facilities (A–E) and 500,000 randomly generated reads. The peak read length for the five core facilities (478 nt) and the random sequences (531 nt) are marked below the x-axis. The distance to the shortest random sequence is marked (450 nt) and was found to be 81 nt. This same distance from the peak read length for the five core facilities is also marked (397 nt). (B) Read length distribution for 1 million randomly selected reads from each core facility (A–E) and 500,000 random pyrosequencing reads (same as A).
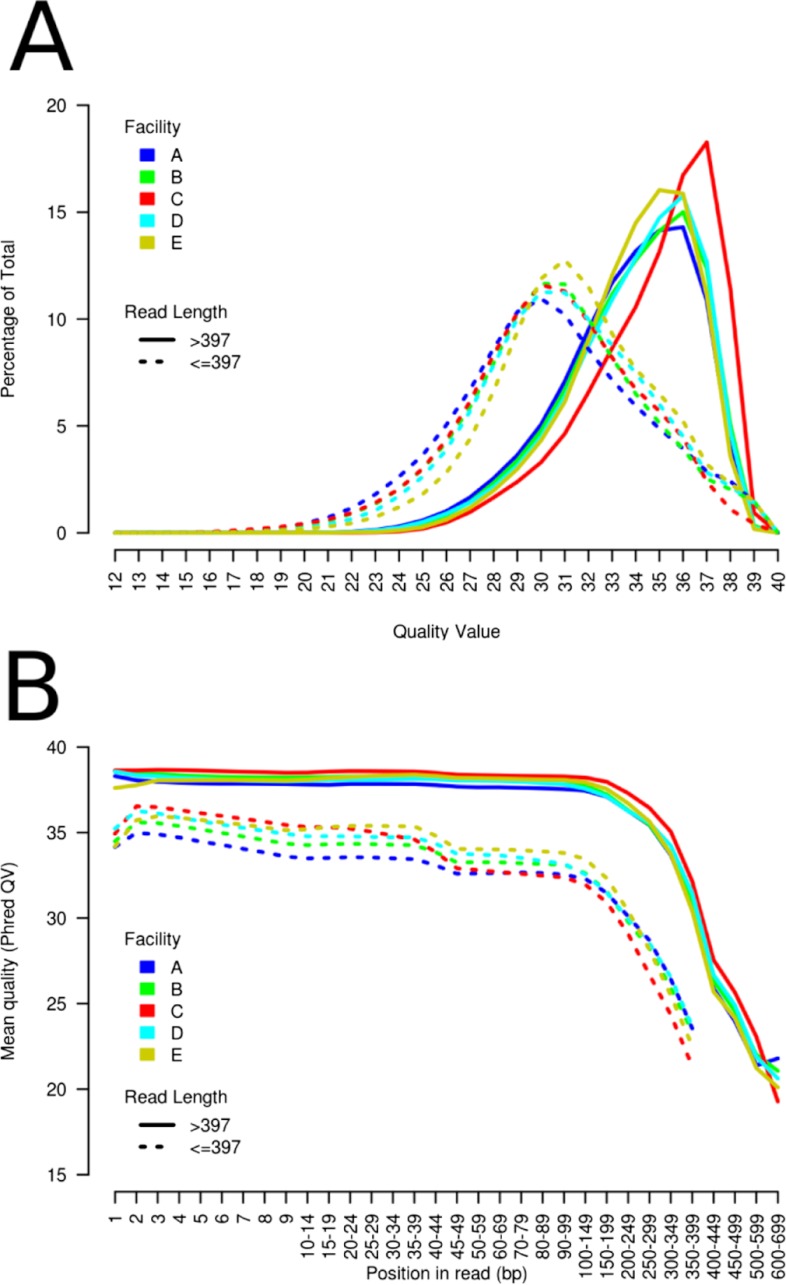
Apart from the value of longer sequence contiguity given by longer reads, truncated reads can still contribute to genome coverage and assembly as long as they are of high base-calling quality. We thus investigated variation in base quality among facilities, including whether reads of less than full-length were of lower quality than full-length reads. For each facility, we catalogued the quality values of all bases from reads < and >397 nt separately. For reads <397 nt, we observed a peak quality value of 30–31 (Fig. 2A), with 65% of bases being at or above this peak value. This is in contrast to reads >397 nt, where the average peak-quality value is 36 (Fig. 2A) and at least 90% of bases are above or equal to a quality value of 30. Notably, for Facility C, full-length reads had a peak quality value of 37. Extending the quality analysis further, we catalogued the average quality of bases from reads < and >397 nt by their position on the sequencing read (Fig. 2B). We observed that the reads <397 nt are of lower average quality across their entire length as compared with longer reads (Fig. 2B). Also, longer reads maintain a minimum quality value of 35 up to 300 nt, whereas shorter reads show a gradual decrease in average quality value across their length.
FIGURE 2.
Base quality/core facility. (A) Percentage of total base quality values/core facility (A–E), divided by reads above (solid lines) or below (dotted lines) 397 nt in length. (B) Mean Phred quality values (QV) by read position/core facility (A–E), divided by reads above (solid lines) or below (dotted lines) 397 nt in length.
Overview of the H327 Genome Assembly
The O. novo-ulmi H327 genome was assembled using the combined read sets from all five facilities (6,425,848 reads; 2,529,913,632 bases), as well as 181,162 paired-end sequence reads (7 kb average insert size±2.5 kb). With the use of Newbler version 2.3, this produced an initial assembly of 19 scaffolds at an average 61× coverage. The 19 scaffolds consisted of nine large multi-contig scaffolds (>500 kb), nine single contig scaffolds (<5 kb), and one scaffold of two contigs containing a partial sequence of the ribosomal gene (∼9 kb). Paired-end information linked either end of this ribosomal scaffold to two larger scaffolds, leading us to merge these three scaffolds together (scaffold00010 in Table 2). Also using paired-end information, we placed seven of nine small single contig scaffolds into sequence gaps within large scaffolds (data not shown). Of the two remaining small scaffolds, one had low read depth of coverage and was discarded (length 2187 nt), whereas the other of length 4151 nt had higher than average read coverage of 73× and was retained separately (Table 2). National Center for Biotechnology Information (NCBI) BLAST analysis of this scaffold shows that it is likely to be of fungal origin, as it had 39% amino acid similarity (e-value 3e-29) to a predicted protein from the filamentous fungus Grosmannia clavigera, which like O. novo-ulmi, belongs to the Ophiostomatales.9
TABLE 2.
Overview of the O. novo-ulmi Strain H327 Genome Assembly
| Name | Read depth | Contigs | Size (nt) | Genes | ESTs | Structure |
|---|---|---|---|---|---|---|
| scaffold00005 | 60.8651 | 34 | 6,937,932 (21.78) | 1854 (21.49) | 697 (21.06) | Linear |
| scaffold00011 | 60.6971 | 26 | 6,817,711 (21.40) | 1827 (21.17) | 772 (23.33) | Linear |
| scaffold00002 | 60.9893 | 17 | 3,669,772 (11.52) | 985 (11.41) | 517 (15.62) | Linear |
| scaffold00018 | 61.0481 | 18 | 3,419,703 (10.74) | 968 (11.22) | 335 (10.12) | Linear |
| scaffold00012 | 61.2487 | 12 | 2,848,703 (8.94) | 794 (9.20) | 241 (7.28) | Linear |
| scaffold00008 | 61.2971 | 17 | 2,801,594 (8.79) | 766 (8.88) | 232 (7.01) | Linear |
| scaffold00010 | 60.9143 | 22 | 2,758,224 (8.66) | 756 (8.76) | 246 (7.43) | Linear |
| scaffold00015 | 61.1431 | 13 | 2,531,247 (7.95) | 663 (7.68) | 237 (7.16) | Linear |
| scaffold00004 | 73.8061 | 1 | 4151 (0.01) | 1 (0.01) | 0 (0.00) | Linear |
| contig00013 | 31.1785 | 1 | 66,357 (0.21) | 15 (0.17) | 1 (0.03) | Circular |
Compared with experiences with other microbial genomes, the O. novo-ulmi assembly had a higher-than-anticipated number of unassembled reads (>11% of reads of high sequence quality). NCBI BLAST analysis indicated that this included a large proportion of reads with similarities to fungal mitochondrial genomes. With the use of an independent assembly of a subset of unassembled reads, we were able to demonstrate the presence of a very high copy number (>3500-fold coverage), 66.357 kb, a single, circular contig corresponding to the O. novo-ulmi H327 mitochondrion.
After applying these improvements, the genome assembly of O. novo-ulmi H327 consists of nine scaffolds containing 160 contigs and totals 31,789,037 nucleotides (Table 2 and Fig. 3A). The sizes of the eight largest scaffolds are consistent with what has been observed using PFGE of chromosomes for various strains of Dutch elm disease fungi, including O. novo-ulmi strain H327 (Fig. 3B).3 The length of these scaffolds and absence of paired-ends extending the extremities of these scaffolds indicate that they represent linear chromosomes. We predict that the eight large scaffolds contain a total of 8613 genes (Table 2). To further assess the overall completeness of the genome assembly, we aligned 3309 EST sequences from Hintz et al.7 and catalogued the number of unique, high-scoring alignments. The vast majority of ESTs (3277, 99.01%) mapped to the assembly, suggesting that the protein-coding portion of the genome is essentially completely contained with the genome assembly.
FIGURE 3.
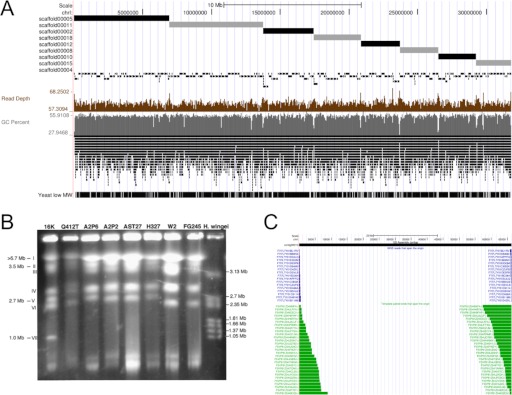
The O. novo-ulmi strain H327 genome assembly. (A) A custom University of Santa Cruz (Santa Cruz, CA, USA) Genome Browser screen capture of the O. novo-ulmi H327 assembly. Tracks from top to bottom are: (i) a 10-Mb scale, (ii) a ruler, (iii) scaffolds ordered by decreasing size (alternating black/gray), (iv) contigs (black), (v), depth of read coverage (brown), (vi) Guanine-cytosine (GC) percent (gray), (vii) gene predictions, and (viii) EST alignments. (B) Pulse-field gel electrophoresis (PFGE) of eight strains of O. novo-ulmi and O. ulmi. DNA ladder sizes are marked on the right, and estimated chromosome sizes are marked on the left. Reprinted from Et-Touil et al.3 (C) The mitochondrial genome assembly. Tracks from top to bottom are: (i) a scale (20 kb), (ii) a ruler, (iii) contig (black), (iv) whole genome shotgun (WGS) reads that span the origin, confirming circularity, (v) pair-end reads that span the origin, confirming circularity.
In addition to these linear scaffolds, we assembled a 66,357-nt circular scaffold, which had its circularity confirmed by multiple paired-end and fragment reads (Fig. 3C). The sequence is similar in size to known Ophiostoma mitochondria10 and has been annotated to show the positions of 26 tRNAs and 15 genes. There remains a single contig of 4191 nt that we cannot place into the genome assembly. This contig had a higher average depth of coverage than the rest of the nuclear genome, showed no evidence of circularity, and had no matches to any paired-ends from the 8-kb library but did have sequence similarities indicating a fungal origin. We hypothesize that this molecule represents a short, linear dsDNA plasmid.
The entire genome assembly is available at NCBI BioProject under Accession Number PRJNA173023 and is also publicly available at http://www.genomequebec.mcgill.ca/compgen/browser-ophiostoma/cgi-bin/hgGateway.
Sequencing Coverage, Homopolymer Accuracy, and Substitution Rates
The use of the genome assembly as a reference allowed us to go back to data from each sequencing facility and measure how accuracy at the read level compared with the consensus sequence. After accounting for reads of mitochondrial DNA origin, the contribution to coverage by each facility ranged from 10× (E) to 16× (C). The vast majority of assembled bases is covered by at least one read from each facility (99.92%; 31,680,436 nt), with 94.06% of the assembled bases covered by five or more reads from each facility. Only 23,727 nt (0.074%) of the genome is covered by four facilities or less. Also, of the total number of bases assembled, 99.93% (31,683,719) are at the maximum quality value of 64.
In the O. novo-ulmi genome assembly, we catalogued a total of 408,315 homopolymers from 4 to 10 nt in length (Table 3). The majority (402,455; 98.5%) is 7 nt or less, and there are ∼2.8-fold more A/T than C/G homopolymers (Fig. 4A). Read accuracy was measured by comparing homopolymer length from individual reads with their orthologous occurrence in the genome sequence. To perform this analysis, we aligned the reads from each facility to the O. novo-ulmi H327 genome, retaining only reads with unique alignments >300 nt. We then catalogued within each alignment the homopolymer length from the read sequence and the orthologous genome sequence. We only considered homopolymer alignments that had flanking nucleotides on both ends that matched between the read and genome sequence. With these criteria, we were able to measure homopolymer accuracy for ∼85% of shorter homopolymers (4–5 nt) to 65% of longer homopolymers (7 nt or more; Table 3). Within this set, we observed that accuracy decreased with increasing homopolymer length (Fig. 4B). We also observed that while B, C, D, and E performed similarly and maintained >50% accuracy for all homopolymer lengths considered, the performance for Facility A was lower, achieving 65% accuracy for homopolymers of length 7, and <50% for homopolymers of lengths 9 and 10. The lower accuracy for Facility A was observed for all four nucleotides (A, C, G, and T), particularly for A/T homopolymers (Fig. 5A). Otherwise, variation in homopolymer accuracy between bases for any a single facility was consistent (Fig. 5B). We next sought to determine whether inaccuracies in homopolymer length were a result of under-calling or over-calling of homopolymer lengths in individual reads. Figure 5C illustrates that the majority of errors across all facilities is a result of under-calls and that Facility A tends to under-call homopolymers of length nine or 10 at an equal or greater proportion as compared with correct calls.
TABLE 3.
Homopolymer Measurement Statistics
| Homopolymer length | Genome | Measured hompolymers/facility (%) |
||||
|---|---|---|---|---|---|---|
| A | B | C | D | E | ||
| 4 | 294,261 | 251,918 (85.61) | 253,370 (86.1) | 254,124 (86.36) | 255,884 (86.96) | 251,041 (85.31) |
| 5 | 79,130 | 64,110 (81.02) | 64,569 (81.6) | 64,609 (81.65) | 65,265 (82.48) | 63,792 (80.62) |
| 6 | 20,974 | 15,758 (75.13) | 15,873 (75.68) | 15,718 (74.94) | 16,093 (76.73) | 15,618 (74.46) |
| 7 | 8090 | 5544 (68.53) | 5650 (69.84) | 5405 (66.81) | 5723 (70.74) | 5510 (68.11) |
| 8 | 3381 | 2173 (64.27) | 2192 (64.83) | 2018 (59.69) | 2249 (66.52) | 2144 (63.41) |
| 9 | 1654 | 1083 (65.48) | 1129 (68.26) | 935 (56.53) | 1138 (68.8) | 1065 (64.39) |
| 10 | 825 | 547 (66.3) | 570 (69.09) | 411 (49.82) | 589 (71.39) | 532 (64.48) |
FIGURE 4.
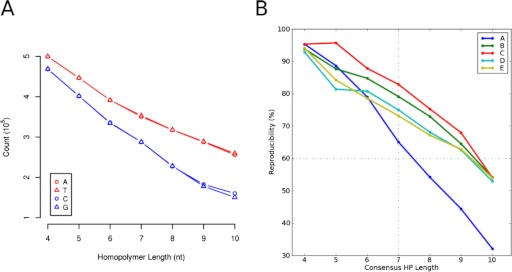
Homopolymer counts and overall accuracy. (A) Counts of homopolymers of length four to 10 in the O. novo-ulmi H327 genome. (B) Homopolymer (HP) accuracy/core facility (A–E).
FIGURE 5.
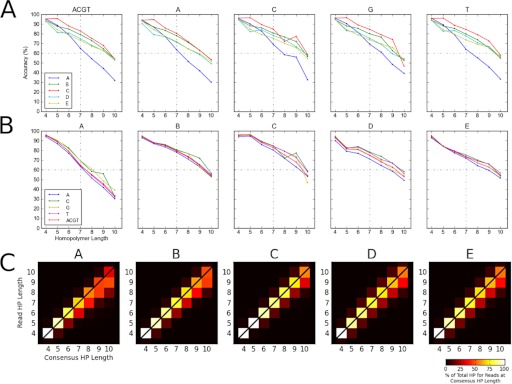
Aspects of homopolymer accuracy. (A) Trend of facility homopolymer accuracy/nucleotide. The left-most plot is overall homopolymer accuracy/facility (identical to Fig. 4B), with subsequent plots depicting accuracy for each nucleotide separately. (B) Trend of homopolymer accuracy/facility. Each chart depicts overall accuracy/facility, and each plot line depicts accuracy for each nucleotide. (C) Homopolymer over-call and under-call rates. The chart depicts for each facility the percent agreement (diagonal), under-call (below diagonal), and over-call (above diagonal) of homopolymers from read sequences to the genome sequence.
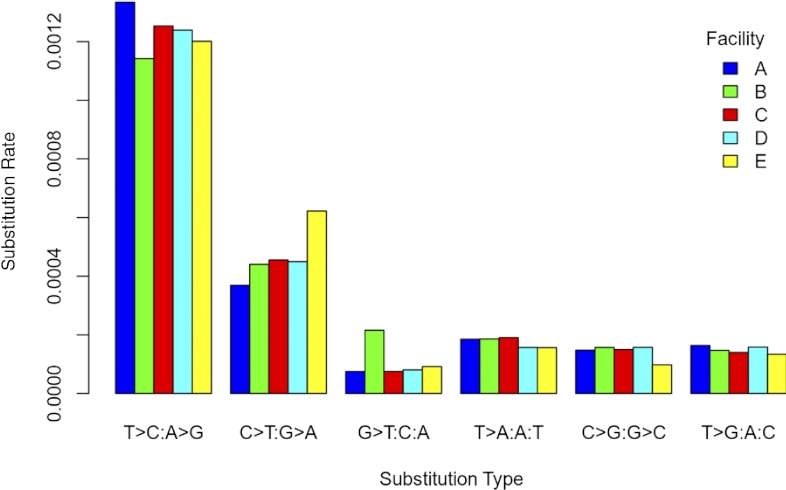
Similar to the homopolymer analysis, we conducted a substitution error rate analysis using only unique alignments of >300 nt. In addition, we only considered alignments that had one or two mismatches to the genome sequence and only substitutions (not gaps) that appeared >5 nt from the end of the read or another mismatch. With the use of these criteria, we catalogued 135,037 substitutions and observed that 94.9% (128,201) occurred once per read. Within each substitution type (e.g., T>C or A>G), the substitution error rate per facility showed slight variation (Fig. 6), with Facility E having a slightly higher rate for C > T or G > A substitutions and Facility B having a higher rate for G > T or C > A substitutions. The most marked variation is the elevated error rates across all facilities for T > C or A > G and C > T or G > A substitutions (Fig. 6). This has been observed previously for this sequencing technology11 and is attributable to PCR fidelity during library preparation.12–14 Notwithstanding these polymerase-based substitutions, the substitution error rate is <0.4/1000 sequenced bases for the other four substitution types and is similar to previously published observations for pyrosequencing.11
FIGURE 6.
Substitution error rate. For each facility, the substitution rate of a nucleotide in read sequence as compared with the genome sequence.
DISCUSSION
The first objective of this study was to test the performance and reproducibility of the Roche/454 GS-FLX Titanium System across a number of genomics core facilities. To eliminate sample variation, we chose to sequence the genome of a single colony isolate of O. novo-ulmi strain H327. As no other strains of the Ophiostoma ulmi group have been sequenced, this gave us the opportunity to provide the first reference genome sequence of an important pathogen of elm trees.
Overall, the Roche/454 GS-FLX Titanium System was reproducible across the five facilities tested in this study. All sites easily surpassed a minimum performance threshold of >450,000 reads per one-half PTP and a peak read length of >400 nt, with all facilities generating a minimum of 500,000 reads and a peak read length between 473 and 481 nt. Some cross-facility variation in output was observed, particularly in transforming emulsion PCR and plate-loading conditions into consistent read outputs.
In addition to comparing throughput, the reproducibility of several quality metrics was tested. Conceptually, the Roche/454 sequencing process should have a minimum read length of ∼400 nt when presented with suitably high-quality libraries. The partitioning of reads below and above a measure of full length revealed that the production of higher read numbers can be offset if there is a higher proportion of shorter reads, as these shortened reads are of lower quality throughout their length. The use of higher proportions of lower-quality reads may impact downstream analysis, especially when searching for variants. For genome assemblies built from consensus sequences, these shorter, lower-quality reads will remain useful as they contribute to overall genome coverage. However, for low-pass sequencing projects, including metagenomics projects, sequencing errors in lower-quality reads may result in poorer analysis results.
To further investigate sequencing quality at a sequencing read level, we compared homopolymer lengths as well as substitution error rates. All facilities had equivalent homopolymer calling accuracy for homopolymers <7 nt, achieving >75% accuracy. Above this homopolymer length, all facilities showed a decrease in accuracy, typically under-calling the homopolymer length compared with what was observed in the genome sequence. Notably, we observed that facilities varied in homopolymer calling accuracy, with a single facility showing a marked decrease in homopolymer accuracy, with <50% accuracy for homopolymers of length 9 or 10 nt. We estimate that assembling the genome, using only reads from this facility, would have incorrectly determined the length of ∼2400 homopolymer tracts. Although of lower accuracy than the norm, it must be kept in mind that this would affect <0.008% of the genome assembly. This decrease in accuracy would be more significant for genomic samples with larger proportions of long homopolymers or in cases where the analysis of individual reads are of importance. Although we cannot precisely identity the cause of the problem, aspects of our experimental design (common sample, often common batches, or lots of reagents) lead us to suspect it is a result of variance in individual machine performance and thus, underline the importance of system maintenance. We also evaluated the substitution error rate and show it is occurring at a rate of 1:2500 sequenced nucleotides on a read basis. For certain substitutions, particularly T > C and A > G, the error rate is higher as a result of PCR fidelity during library preparation.11
Among the facilities tested in this study, we found no correlation between the size or experience of the sequencing team and sequencing yield or accuracy. Overall, we make three general conclusions of relevance to individual researchers, considering the purchase of sequencing services from core facilities. The first is that a review of sequencing quality, especially the ratio of shortened versus full-length reads, is a strong indicator of overall quality. The second is that there is no observable penalty to using multiple core facilities, as long as each facility can provide high-quality sequencing. Our third conclusion is that a minimum threshold of 450,000 reads and peak read length of 400 nt are poor standards for a high-quality sample, and expectations of higher performance (>500,000 reads; peak read length approaching 400 nt) are much more reasonable.
We have produced a high-quality assembly of the 31.8 Mb O. novo-ulmi H327 genome. The eight largest linear scaffolds are similar in length and number to whole chromosomes as measured by PFGE, and the number and density of predicted genes are similar to related fungi.15 Also, the near-complete mapping of an independent set of ESTs7,16 indicates that the protein-coding portion of the genome is comprehensively represented in the assembly. In addition to the assembling chromosome-length sequences, we completely assembled the 66.4-kb mitochondrial genome into a single contig and confirmed its circularity using read sequence and paired-end information. Although not verified, we also hypothesize the presence of a small (4.2 kb), linear plasmid associated with this strain. This first genome reference sequence provides a foundation to conduct further research. The O. ulmi group is characterized by levels of pathogenicity and cross-continental migrations,3,17,18 so comparative sequencing of O. ulmi, O. novo-ulmi, and Ophiostoma himal-ulmi may elucidate evolutionary changes correlated with virulence. Further, as strains are interfertile and can be subjected to controlled matings, genetic/genomic opportunities now exist to trace heritable characteristics more directly to their underlying genomic changes.
ACKNOWLEDGMENTS
This work was partially funded by financial support of the ABRF. V.F. was the recipient of a Canadian Institutes of Health Research Doctoral Research Award. W.H. and L.B. acknowledge support from the Natural Sciences and Engineering Research Council of Canada. We appreciate the technical expertise provided by Gregory Grove, Alvaro Hernandez, Sharon Bachman, and Lorie Hetrick. We are grateful to Clotilde Teiling and Tim Harkins at Roche/454 for advice and the provision of GS-FLX Titanium reagents.
REFERENCES
- 1. Margulies M, Egholm M, Altman WE, et al. Genome sequencing in microfabricated high-density picolitre reactors. Nature 2005;437:376–380 [DOI] [PMC free article] [PubMed] [Google Scholar]
- 2. Dewar K, Bousquet J, Dufour J, Bernier L. A meiotically reproducible chromosome length polymorphism in the ascomycete fungus Ophiostoma ulmi (sensu lato). Mol Gen Genet 1997;255:38–44 [DOI] [PubMed] [Google Scholar]
- 3. Et-Touil A, Brasier CM, Bernier L. Localization of a pathogenicity gene in Ophiostoma novo-ulmi and evidence that it may be introgressed from. O. ulmi. Mol Plant-Microbe Interact 1999;12:6–15 [Google Scholar]
- 4. Aoun M, Jacobi V, Boyle B, Bernier L. Identification and monitoring of Ulmus americana transcripts during in vitro interactions with the Dutch elm disease pathogen Ophiostoma novo-ulmi. Physiol Mol Plant Pathol 2010;74:254–266 [Google Scholar]
- 5. Zolan ME, Pukkila PJ. Inheritance of DNA methylation in Coprinus cinereus. Mol Cell Biol 1986;6:195–200 [DOI] [PMC free article] [PubMed] [Google Scholar]
- 6. Ter-Hovhannisyan V, Lomsadze A, Chernoff YO, Borodovsky M. Gene prediction in novel fungal genomes using an ab initio algorithm with unsupervised training. Genome Res 2008;12:1979–1990 [DOI] [PMC free article] [PubMed] [Google Scholar]
- 7. Hintz W, Pinchback M, de la Bastide P, et al. Functional categorization of unique expressed sequence tags obtained from the yeast-like growth phase of the elm pathogen Ophiostoma novo-ulmi. BMC Genomics 2011;12:431–443 [DOI] [PMC free article] [PubMed] [Google Scholar]
- 8. Kent WJ. BLAT—the BLAST-like alignment tool. Genome Res 2002;12:656–664 [DOI] [PMC free article] [PubMed] [Google Scholar]
- 9. DiGuistini S, Wang Y, Liao NY, et al. Genome and transcriptome analyses of the mountain pine beetle-fungal symbiont Grosmannia clavigera, a lodgepole pine pathogen. Proc Natl Acad Sci USA 2011;108:2504–2509 [DOI] [PMC free article] [PubMed] [Google Scholar]
- 10. Bates MR, Buck KW, Brasier CM. Molecular relationships of the mitochondrial DNA of Ophiostoma ulmi and the NAN and EAN races of O. novo-ulmi determined by restriction fragment length polymorphisms. Mycol Res 1993;97:1093–1100 [Google Scholar]
- 11. Campbell PJ, Pleasance ED, Stephens PJ, et al. Subclonal phylogenetic structures in cancer revealed by ultra-deep sequencing. Proc Natl Acad Sci USA 2008;105:13081–13086 [DOI] [PMC free article] [PubMed] [Google Scholar]
- 12. Ennis PD, Zemmour J, Salter RD, Parham P. Rapid cloning of HLA-A,B cDNA by using the polymerase chain reaction: frequency and nature of errors produced in amplification. Proc Natl Acad Sci USA 1990;87:2833–2837 [DOI] [PMC free article] [PubMed] [Google Scholar]
- 13. Bracho MA, Moya A, Barrio E. Contribution of Taq polymerase-induced errors to the estimation of RNA virus diversity. J Gen Virol 1998;79:2921–2928 [DOI] [PubMed] [Google Scholar]
- 14. Dunning AM, Talmud P, Humphries SE. Errors in the polymerase chain reaction. Nucleic Acids Res 1988;16:10393–10399 [DOI] [PMC free article] [PubMed] [Google Scholar]
- 15. Diguistini S, Liao NJ, Platt D., et al. De novo genome sequence assembly of a filamentous fungus using Sanger, 454 and Illumina sequence data. Genome Biol 2009;10:R94. [DOI] [PMC free article] [PubMed] [Google Scholar]
- 16. Jacobi V, Dufour J, Bouvet G, Aoun M, Bernier L. Identification of transcripts up-regulated in asexual and sexual fruiting bodies of the Dutch elm disease pathogen Ophiostoma novo-ulmi. Can J Microbiol 2010;56:697–705 [DOI] [PubMed] [Google Scholar]
- 17. Brasier CM, Kirk SA. Designation of the EAN and NAN races of Ophiostoma novo-ulmi as subspecies. Myol Res 2001;105:547–554 [Google Scholar]
- 18. Brasier CM. Low genetic diversity of the Ophiostoma novo-ulmi population in North America. Mycologia 1996;88:951–964 [Google Scholar]


