

E2F transcription factors regulate expression of RAE-1 family NKG2D ligands in cancer cells and normal proliferating cells to promote wound healing and immune recognition.
Abstract
The NKG2D stimulatory receptor expressed by natural killer cells and T cell subsets recognizes cell surface ligands that are induced on transformed and infected cells and facilitate immune rejection of tumor cells. We demonstrate that expression of retinoic acid early inducible gene 1 (RAE-1) family NKG2D ligands in cancer cell lines and proliferating normal cells is coupled directly to cell cycle regulation. Raet1 genes are directly transcriptionally activated by E2F family transcription factors, which play a central role in regulating cell cycle entry. Induction of RAE-1 occurred in primary cell cultures, embryonic brain cells in vivo, and cells in healing skin wounds and, accordingly, wound healing was delayed in mice lacking NKG2D. Transcriptional activation by E2Fs is likely coordinated with posttranscriptional regulation by other stress responses. These findings suggest that cellular proliferation, as occurs in cancer cells but also other pathological conditions, is a key signal tied to immune reactions mediated by NKG2D-bearing lymphocytes.
NKG2D is an activating immunoreceptor on NK cells, activated CD8 T cells, a subset of CD4 T cells, NKT cells, and γδT cells. The ligands for NKG2D are self-proteins that are poorly expressed by normal cells but up-regulated in distressed cells. Upon engagement, NKG2D induces activation of lymphocytes, which leads to the cytolysis of target cells and cytokine production. Accordingly, NKG2D has been shown to play a major role in the activity of NK cells and T cells against target cells in vitro and to be protective in the context of certain cancers and infections in vivo (Raulet, 2003; Guerra et al., 2008; Raulet and Guerra, 2009; Champsaur and Lanier, 2010). There is a surprising diversity of NKG2D ligands, up to nine in mice and eight in humans, depending on the strain or individual. In mice, the ligands include five members of the retinoic acid early inducible gene 1 (RAE-1; α–ε) subfamily, murine UL16–binding protein-like transcript 1 (MULT1), and three members of the histocompatibility (H60; a–c) family (Raulet, 2003; Champsaur and Lanier, 2010). In humans, the ligands include RAET1s (also known as ULBPs), MICA, and MICB (Eagle and Trowsdale, 2007; Champsaur and Lanier, 2010).
The ligands are frequently found on the surface of immortalized mouse tumor cell lines, established cell lines and primary tumors (Guerra et al., 2008), and cells infected with certain pathogens (Champsaur and Lanier, 2010). Evidence suggests that ligands are induced through cellular pathways activated by extrinsic stresses, including the DNA damage response, heat shock stress, and, in some cases, tumor suppressors, but most of these act posttranscriptionally and little is known concerning the transcriptional induction of ligand genes in unhealthy cells (see Discussion). Therefore, a major outstanding question in the field is how NKG2D ligands are regulated transcriptionally and how such regulation is coupled to cellular processes associated with disease.
One of the most common themes in the process of tumorigenesis is deregulation of the cell cycle, especially in factors that control the G1/S transition, which heavily relies on the activity of E2F transcription factors. The E2F family consists of eight transcription factors that fall into two groups depending on whether they activate transcription (E2F1, E2F2, and E2F3a) or repress it (E2F4-8 and E2F3b; Chen et al., 2009). Activator E2Fs are expressed in response to growth factor stimulation and oncogenic stress and induce transcription of target genes involved in cell cycle progression and DNA replication. As a result of its critical role in proliferation, the regulatory pathway for E2Fs is one of the most dysregulated pathways in cancer (Chen et al., 2009).
In this study, we have identified proliferative signals generally, and E2F transcription factors specifically, as a major mechanism of transcriptional regulation of the NKG2D ligand Raet1e that leads to the cell surface expression of RAE-1ε. The coupling of RAE-1 expression to proliferative signals provides a mechanism for surveillance of aberrantly proliferating cells but raises interesting questions concerning how normal and pathological proliferation is distinguished by the immune system.
RESULTS
Robust RAE-1ε expression is induced in primary cultures and depends on cell proliferation
To study the regulation of NKG2D ligands in cells that retain normal checkpoint pathways, primary cultures of fibroblasts were prepared from the tails of adult B6 mice. Unexpectedly, without any additional treatments, RAE-1ε transcripts and cell surface expression were detected in fibroblasts within 2 d of the initiation of culture and reached a plateau after 6 d of culture (Fig. 1, A and B). Expression was maintained indefinitely thereafter in the cultures for up to a year when they were maintained in growth-inducing conditions. Similar results were obtained in primary fibroblast cultures prepared from peritoneal wall and ear tissues (unpublished data). Hence, primary culture conditions were sufficient to induce RAE-1ε in the absence of other known stressors.
Figure 1.

RAE-1e is induced on primary cultured fibroblasts dependent on proliferation. (A) qRT-PCR for Raet1e in RNA from adult C57BL/6 tail tissue (day 0), or 2- or 10-d cultured fibroblasts from the tails, relative to 18s rRNA qRT-PCR results. Raet1e transcript levels were normalized to the day 2 amounts, as they were undetectable in day 0 cells. Means ± SD are shown. **, P < 0.005, unpaired Student’s t test. (B) Tail fibroblasts harvested after 1–6 d of in vitro culture were stained with RAE-1ε antibody. Shaded histogram represents isotype control staining. (C) qRT-PCR for Raet1e, Raet1d, Mult1, and H60b in RNA from adult C57BL/6 tail tissue (d0), or 5-d cultured fibroblasts (d5) from the tails, relative to 18s rRNA qRT-PCR results. Means ± SD are shown. (D) Tail fibroblasts were cultured with DMSO or with 10 mM LY294002 or 25 mM Roscovitine for the indicated number of days and stained for RAE-1ε. (E) After 8 d of primary culture in 10% FCS, fibroblasts were treated with LY294002, Roscovitine, or vehicle (DMSO) for 3 d and stained for RAE-1ε (top). RAE-1ε staining was tested after washing the treated cells from the top panel and reculturing for an additional 3 d (bottom). (F) TRAMP-C2 and MC38 tumor cell lines were treated with Roscovitine or vehicle (DMSO) for 1 or 3 d and stained for RAE-1ε. Shaded histograms represent isotype control staining of DMSO-treated samples. (G) HCT116 cells were serum starved or treated with Roscovitine or vehicle (DMSO) for 3 d and stained for MICA/B or UBLP2. Dead (7-AAD+) cells were excluded in all of the experiments above, except one in A. Data in A, B, and D were repeated >10× with similar results, and data in C, E, F, and G are representative of two to three independent experiments.
Induction in proliferating cells was characteristic of some NKG2D ligands, but not others. Both of the Raet1 genes identified in B6 mice were induced in proliferating primary B6 fibroblasts, although induction was greater for Raet1e transcripts than Raet1d transcripts (Fig. 1 C). In contrast, Mult1 and H60b were induced only modestly, if at all (Fig. 1 C). In primary fibroblasts from the BALB/c and 129/J strains, which express RAE-1α, β, and γ, cell surface RAE-1 was strongly induced as detected with RAE-1α–, β–, and γ–specific antibody (unpublished data), suggesting that one or more of these RAE-1 isoforms is also induced in primary fibroblasts. Hence, several RAE-1 isoforms, but not MULT1 and H60b, were induced in proliferating fibroblasts.
RAE-1ε induction in primary cultures was strongly blocked by inhibitors of cyclin-dependent kinases (CDKs; Roscovitine), the PI3K–mTOR pathway (LY294002, Rapamycin), or the MAPK pathway (SB202190; Fig. 1 D and not depicted). Furthermore, after initiating cultures for 8 d without inhibitors, the addition of Roscovitine or LY294002 caused a significant inhibition of RAE-1ε cell surface expression over the next 3 d (Fig. 1 E, top). Washing out the inhibitors and reculturing the cells for 3 d resulted in restoration of RAE-1ε expression (Fig. 1 E, bottom). These inhibitors target distinct pathways but all of them severely inhibit proliferation.
We next addressed whether the constitutive RAE-1 expression by tumor cell lines was dependent on proliferative signals. Inhibiting CDKs with Roscovitine resulted in a marked reduction in RAE-1 expression by several RAE-1–positive cancer cell lines, including TRAMP-C2 prostate adenocarcinoma, MC38 colon carcinoma, and YAC-1 lymphoma cell lines (Fig. 1 F and not depicted). Inhibition of PI3K with LY294002 had similar effects (unpublished data).
To determine whether human NKG2D ligands are also regulated by proliferation, NKG2D ligand-positive HCT116 human carcinoma cell lines were serum starved or treated with Roscovitine to inhibit proliferation. Serum starvation almost completely abrogated MICA/B expression and significantly reduced ULBP2 expression, whereas Roscovitine inhibited both MICA/B and ULBP2 expression (Fig. 1 G). Therefore, the human MICA/B and ULBP2 NKG2D ligands, like mouse RAE-1 ligands, are subject to regulation by proliferative signals.
As further evidence for a role of proliferation in RAE-1 expression, limiting the concentration of serum and therefore of serum growth factors caused a delay in RAE-1 induction in primary fibroblast cultures (Fig. 2 A). Furthermore, cells that had been cultured for >1 mo in 10% serum to maximally induce RAE-1ε expression rapidly extinguished RAE-1ε cell surface and mRNA expression when deprived of serum (Fig. 2, B and C). Re-addition of 10% serum to the serum-starved cells resulted in restoration of RAE-1ε expression (Fig. 2 D). Serum starvation or cell cycle inhibitor treatment did not cause significant cell death, as very few of the cells were stained with Annexin V or 7-AAD after the treatments (Fig. 2 E). Furthermore, when proliferative conditions were reestablished by restoring serum or washing out inhibitors, most of the cells incorporated BrdU within 2–3 d, demonstrating that the treatments had not caused senescence (Fig. 2 F). Therefore, down-regulation of RAE-1 in these studies was not associated with apoptosis or senescence but rather with the nonproliferating state.
Figure 2.

Proliferation is required for RAE-1ε expression on primary fibroblasts. (A) Freshly prepared B6 adult mouse tail fibroblasts were cultured in media supplemented with 2 or 10% serum for ∼3–7 d and harvested for flow cytometry analysis. (B and C) Fibroblasts that had been cultured for >1 mo were serum starved for 1–3 d and processed for staining (B) or RNA analysis (C). Means ± SD are shown. ***, P < 0.0005, unpaired Student’s t test. (D) Samples of serum-starved cells were supplemented with 10% serum and cultured for an additional 3 d. Data in A–D are representative of at least four experiments. (E) Proliferating (Untreated) fibroblasts, or fibroblasts subjected to serum starvation or treatment with LY294002, Roscovitine, or DMSO for 3 d, were stained with 7-AAD and Annexin-V to detect dead and apoptotic cells. (F) Fibroblasts that were serum starved for 3 d were fed with serum for 2 or 3 d in the presence of BrdU to label proliferating cells, before staining the cells intracellularly with BrdU antibodies. (G) Proliferating fibroblasts were serum starved for 3 d before adding 10% serum and BrdU (bottom) or BrdU only (top). After 24 h, cells were stained with BrdU and RAE-1ε antibodies. Gated BrdU+ and BrdU− cells were examined for RAE-1ε expression after excluding 7-AAD+ (dead) cells. (H) Proliferating fibroblasts were stained with RAE-1 antibody, permeabilized, and stained with propidium iodide. Cells in G1, S, or G2 phases of the cell cycle (left) were examined for RAE-1ε expression (right). (I) Freshly prepared tail cells were cultured on fibronectin-coated plates in DMEM supplemented with 10% serum, 100 ng/ml EGF, or no growth factor (−EGF) for 3 d. Cell counts (right, cells/culture) and RAE-1ε staining (left) are shown. Data in E–I are representative of two experiments. (J) Proliferating fibroblasts (Prol) or fibroblasts that were serum starved for 3 d (Starved) were used as target cells for IL-2–activated natural killer cells (LAKs) prepared from NKG2D-deficient (KO) mice or NKG2D WT littermate controls. NKG2D antibody was added to a reaction of WT LAKs with proliferating target cells to block the NKG2D receptor (WT/Prol/MI6). Means ± SD are shown. Data in J are representative of four experiments.
Analysis of cells that incorporated BrdU or not in the first 24 h after serum restoration showed that BrdU+ cells expressed RAE-1, whereas BrdU-negative cells did not (Fig. 2 G), further strengthening the relationship between proliferation and RAE-1 expression. In an established proliferating cell population, cell surface RAE-1 expression did not vary significantly between different cell cycle stages (Fig. 2 H), but it is possible that this reflects the stability of the RAE-1 protein or mRNA. It proved extremely difficult to test whether transcription of Raet1 genes varies in different cell cycle stages.
RAE-1 was induced to a similar extent on primary fibroblasts cultured for 3 d with serum or with serum-free medium supplemented with a defined growth factor that is known to be present in serum (EGF; Loo et al., 1987), arguing against the possibility that serum factors other than growth factors are important for RAE-1 induction (Fig. 2 I). Cells cultured in serum-free medium lacking EGF did not proliferate and failed to induce RAE-1ε on the surface. Together, these data provided evidence that RAE-1ε expression in primary cultures is linked to cellular proliferation and that continuous proliferation is required to maintain RAE-1ε expression on the cell surface.
Cytotoxicity assays were performed to determine whether RAE-1 induction resulting from cell proliferation rendered the cells sensitive to NK killing. Proliferating fibroblasts were efficiently killed by IL-2–activated NK cells, but killing was significantly reduced when the NK cells were derived from NKG2D-deficient (Klrk1−/−) mice (KO) or blocked with NKG2D antibody, demonstrating that NKG2D ligand expression by the fibroblasts induced increased NK killing (Fig. 2 J). If the fibroblasts were starved of serum for 3 d, they displayed lower RAE-1ε at the cell surface (not depicted) and required more than three times as many NK cells to be lysed to the same extent as the proliferating fibroblasts (Fig. 2 J). The residual killing of starved fibroblasts was presumably a result of the expression of ligands for other NK cell receptors because it did not decrease significantly even when NKG2D-deficient (Klrk1−/−) NK cells were used as effector cells (unpublished data). These data showed that reduced RAE-1 expression in starved cells was associated with reduced NK killing of the cells.
Role of stress pathways activated in primary cell cultures
Primary culture conditions can induce a DNA damage response in fibroblasts (Parrinello et al., 2003), which we confirmed by demonstrating nuclear foci containing γH2AX (Mah et al., 2010) on fibroblasts after 5 d of primary culture (unpublished data). Although previous studies demonstrated that an activated DNA damage response can induce RAE-1 expression in cultured cell lines and some T cell cultures (Gasser et al., 2005; Cerboni et al., 2007), RAE-1ε induction in primary fibroblast cultures was not blocked by simultaneous addition of SB218078 and KU55933, which inhibit the key DNA damage response mediators checkpoint kinase 1 (CHK1) and ataxia-telangiectasia mutated (ATM), respectively (Fig. 3 A, left). We have previously shown that a comparable concentration of SB218078 inhibited the induction of RAE-1 on cell lines by each of the DNA damaging agents studied, and that ATM activation is critical for RAE-1 induction by ionizing radiation and radiomimetic drugs (Gasser et al., 2005). Simultaneous deletion of the Atr gene using an inducible Cre system (Ruzankina et al., 2007) and inhibition of ATM (with KU55933) also did not prevent RAE-1ε induction (Fig. 3 A, right). ATM and ATR (ATM and Rad3 related) are the two kinases that initiate most DNA damage responses and whose activity is necessary for maximal RAE-1 expression in tumor cell lines (Gasser et al., 2005). These data established that the DNA damage response pathway dependent on ATM, ATR, and/or CHK1 was not required for RAE-1ε induction in these primary cultures.
Figure 3.
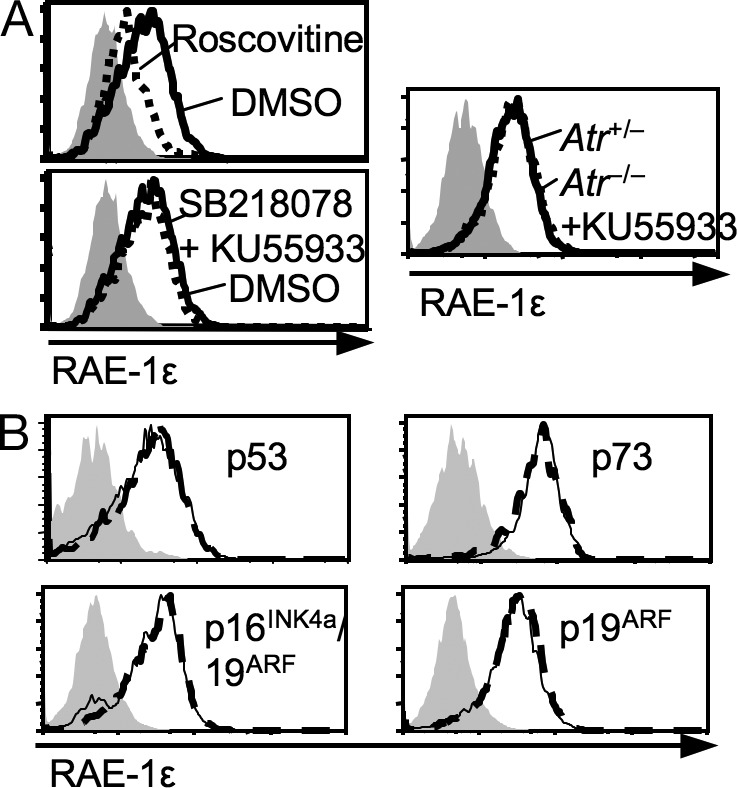
RAE-1ε induction in primary fibroblast cultures is independent of various stress pathways. (A) Fibroblasts were treated with DMSO, Roscovitine, or with a mixture of SB218078 (CHK1 inhibitor) and KU55933 (ATM inhibitor) for 3 d (left). Fibroblasts freshly prepared from Atrfloxed/− Cre-ERT2+ mouse tails were cultured in the absence (Atr+/−) or presence (Atr−/−) of Tamoxifen (to induce Cre and delete loxP-flanked Atr alleles) for 5 d, and KU55933 or DMSO was added for the last 3 d (right). (B) Fibroblasts were freshly prepared from knockout mice that lacked the indicated genes (dashed lines) or WT controls (solid lines) and cultured for 5 d. Dead (7-AAD+) cells were excluded. Each panel is representative of at least three independent experiments.
The tumor suppressors p53, p19ARF, and p16INK4a are often induced in primary cultures (Kamijo et al., 1997). However, RAE-1ε was induced normally in 5-d primary cultures of fibroblasts from mice with deletions of genes for p53, the p53 homologue p73, p19ARF, or both p19ARF and p16INK4a, arguing that RAE-1 induction is not dependent on these tumor suppressors (Fig. 3 B).
Induction of RAE-1 on certain proliferating cells in vivo
To determine whether normal cellular proliferation in vivo can be associated with RAE-1 expression, we examined mouse fetal brain cells. At day 14 of gestation when cellular proliferation is rampant (Daston et al., 2004), RAE-1ε was readily detected on the surface of dissociated fetal brain cells and in fetal brain sections (Fig. 4, A and B), and the cells could be killed by WT but not Klrk1−/− IL-2–activated NK cells (Fig. 4 C). By day 18 of gestation, when cell proliferation is considerably less pronounced (Daston et al., 2004), fetal brain cells failed to stain with RAE-1ε antibody (Fig. 4 A). BrdU labeling for a limited time period confirmed that brain cells at day 14 labeled more rapidly than brain cells at day 18 (Fig. 4 D). With longer labeling periods nearly all the day 14 brain cells incorporated BrdU (not depicted), indicating that nearly all of them were proliferating at that stage and therefore providing an explanation for why the entire population rather than a subset was shifted higher in RAE-1 expression (Fig. 4 A). The finding that early but not late fetal brain cells express RAE-1, which is consistent with published Northern blot data (Zou et al., 1996), suggests that the expression of RAE-1 in embryonic brain cells is correlated with the rate of cell proliferation. NK cells are not present in significant numbers in early embryonic development, suggesting that RAE-1 expression on embryonic cells may not have any physiological consequence. Nevertheless, these findings with embryonic cells support the strong correlation between proliferation and RAE-1ε expression and extend the results to an in vivo system.
Figure 4.
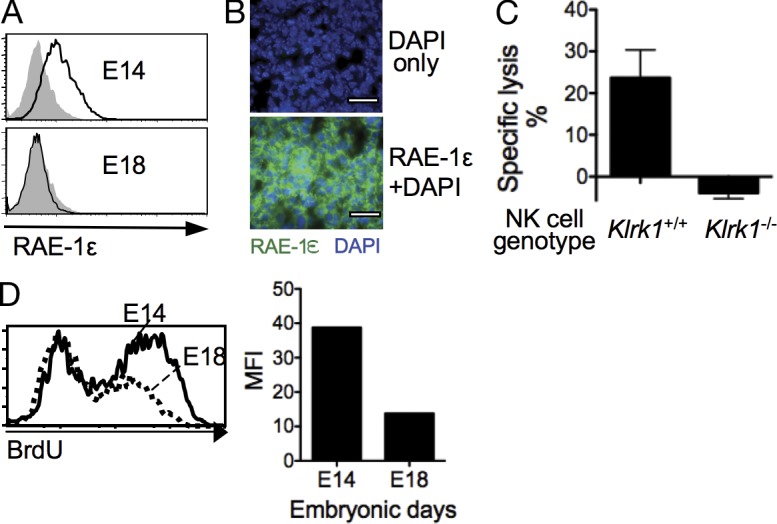
Induction of RAE-1ε on cells in highly proliferative tissues in vivo. (A) Single cell suspensions from E14 and E18 fetal brains were stained with RAE-1ε. Dead (7AAD+) cells were excluded by gating. (B) 9-µm frozen sections of E14 brain were stained with RAE-1ε antibody (green) and DAPI (blue). Bars, 25 µm. (C) Killing of day 14 fetal brain cells by NK cells from Klrk1+/+ or Klrk1−/− mice were measured using LIVE/DEAD fixable dead cell stain kits, gating on CD45-negative cells. Effector/target ratio = 9:1. Means ± SD are shown. (D) BrdU incorporation of embryonic E14 or E18 brain cells after injecting pregnant mothers with BrdU 16 h before sacrifice. Mean fluorescence intensity (MFI) of the entire population is shown on the right. Gated BrdU+ and BrdU− cells stained similarly with RAE-1, consistent with the finding that nearly all the brain cells are proliferating at day 14 (see text). Data in this figure are representative of two to four independent experiments.
As another model for in vivo proliferation, wounded skin undergoing a healing reaction was analyzed for RAE-1 expression. 3 d after wounding, CD45-negative cells in the wound, especially in the epidermal layer, incorporated a large amount of BrdU over 24 h (Fig. 5 A). These data are consistent with evidence that nonlymphoid cells, including keratinocytes and fibroblasts, proliferate in wounds in response to serum growth factors (Singer and Clark, 1999). Interestingly, Raet1e mRNA was significantly induced in wounded skin compared with unwounded skin (Fig. 5 B) and abundant RAE-1ε staining was observed in sections of wounded skin (Fig. 5 C). RAE-1 and BrdU staining were each detected mostly in the epidermal area, suggesting that they colocalize, but it was not possible to determine if RAE1 staining was restricted to BrdU+ cells for technical reasons. These findings provided another example where RAE-1ε is induced in highly proliferative tissue in vivo.
Figure 5.
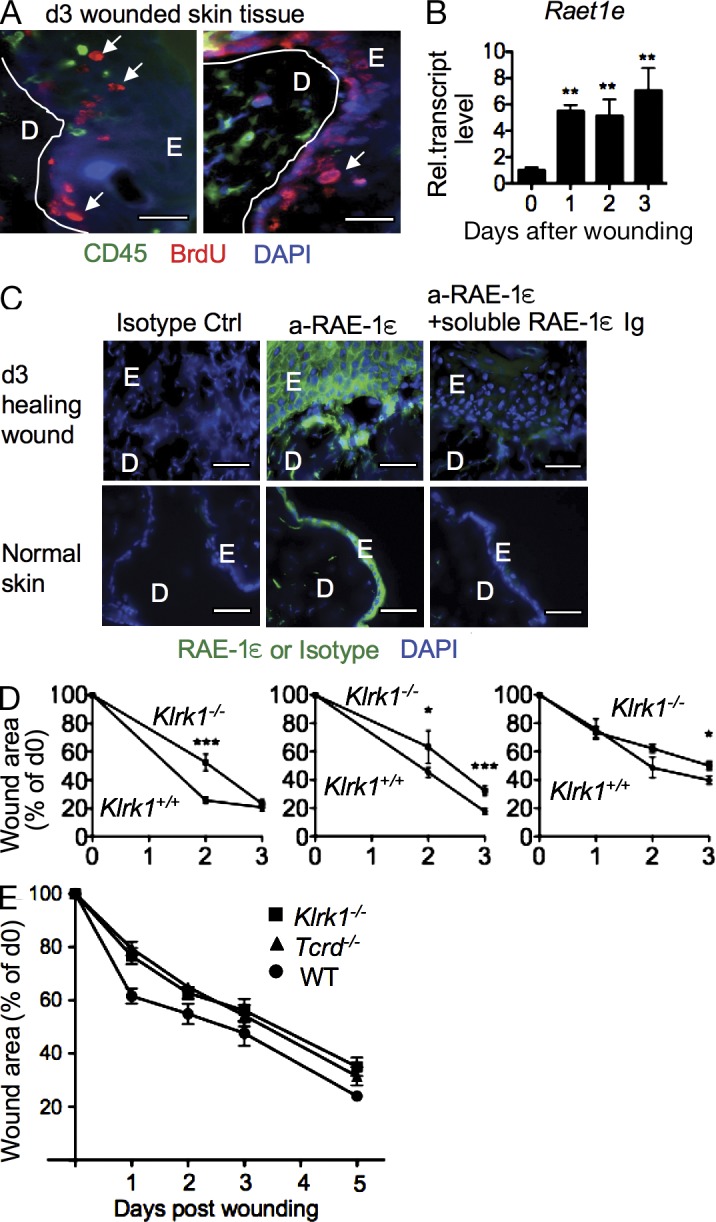
Expression of RAE-1ε in healing skin wounds. (A) BrdU was injected i.p. 2 d after imparting skin wounds, and the mice were sacrificed 1 d later. BrdU+ cells (red) and CD45+ cells (green) in sections of healing skin wounds. Examples of clear BrdU staining are indicated with arrows. D, dermis; E, epidermis. DAPI staining (blue) was not well defined as a result of permeabilization conditions. Two different sections are shown. (B) Skin segments from unwounded mice (d0), or skin surrounding and including wounds that had been imparted 1–3 d earlier were excised. Raet1e mRNA was quantified by qRT-PCR and normalized to 18s rRNA qRT-PCR results (n = 3). Means ± SD are shown. (C) Sections from wounded (3 d earlier) or unwounded skin were stained with RAE-1ε antibody or isotype control antibody (green) with DAPI (blue). In some experiments, the specificity of staining was confirmed by adding soluble recombinant RAE-1ε-Ig before RAE-1ε antibody to block the staining. D, dermis; E, epidermis. RAE-1ε staining of the epidermal layer was consistently observed even in unwounded skin, but staining deeper in the tissue was restricted to wounded skin. Data in A–C are representative at least four experiments. Bars, 25 µm. (D) Three replicate experiments showing delayed wound healing in NKG2D-deficient (Klrk1−/−) mice compared with NKG2D WT (Klrk1+/+) littermates. After application of full thickness wounds, the area of the wound opening was determined on subsequent days. n = 5–11 wounds depending on the experiment. Means ± SD are shown. The asterisks denote significance (*, P < 0.05; **, P < 0.005; ***, P < 0.0005). (E) Analysis of wound closure in WT, TCR-δ–deficient (Tcrd−/−), or NKG2D-deficient mice. After application of full thickness wounds, the area of the wound opening was determined on the subsequent days. Means ± SD are shown. P < 0.05 for WT versus Tcrd−/− at days 1 and 2; P < 0.05 for WT versus Klrk1−/− at days 1 and 5. n = 11–25 wounds depending on the combinations. The comparison of WT versus Klrk1−/− was performed four times but the comparison including Tcrd−/− was done only once.
Previously published studies demonstrated that epidermal γδ T cells accelerate wound healing (Havran, 2000), that epidermal γδ T cells express NKG2D (Girardi et al., 2001; Jamieson et al., 2002), and that activation of those γδ T cells in vitro by cultured keratinocytes depends on NKG2D interactions (Whang et al., 2009). As shown in Fig. 5 D, wound healing was delayed in NKG2D-deficient (Klrk1−/−) mice, which contain normal numbers of epidermal γδ T cells (Jamieson et al., 2002). These data are consistent with a role of induced NKG2D ligands in wounded tissue in mediating a biological function of lymphocytes. It is notable that the impact of a deficiency in a single receptor (NKG2D) on the pace of wound healing was similar to that of a deficiency in all γδ T cells, arguing that NKG2D engagement plays an essential role in this function (Fig. 5 E).
Proliferative signals regulate RAE-1 at the level of transcription
Induction of Raet1e transcripts could be the result of an increase in the rate of Raet1e transcription or could reflect an increase in the stability of Raet1e transcripts that were produced by ongoing transcription. The rate of transcription, independent of posttranscriptional regulation, can be quantified with a nuclear run-on transcription assay, which determines the relative abundance of initiated transcripts in isolated nuclei that can be extended during a short incubation period in vitro (Gariglio et al., 1981; Core et al., 2008). We used a protocol in which isolated nuclei were incubated in the presence of Br-UTP plus other ribonucleotides for 15 min before isolation of the nuclear RNA, immunoprecipitation of the newly labeled RNA with Br-UTP–specific antibodies, and qRT-PCR quantification of the amount of Raet1e or control run-on transcripts in the immunoprecipitated samples (Core et al., 2008). Raet1e run-on transcripts were substantially more abundant in nuclei from fibroblasts proliferating in 10% serum than in nuclei from fibroblasts that had been serum starved for 3 d (Fig. 6 A). The low signal observed with starved nuclei incubated with Br-UTP was similar to the background signal nonspecifically precipitated in samples from proliferating nuclei incubated with UTP instead of Br-UTP (Fig. 6 A, UTP ctrl). These data showed that the increase in Raet1e expression in proliferating cells reflects increased Raet1e transcription.
Figure 6.

Transcriptional regulation of Raet1e by proliferation. (A) Nuclear run-on assays were performed in the presence of Br-UTP in proliferating fibroblasts (Serum) or 3 d serum-starved fibroblasts. Labeled nuclear RNA was immunoprecipitated with Br-U antibody, reverse transcribed, and subjected to qPCR. As a control, the analysis was performed with proliferating fibroblasts that were provided UTP instead of Br-UTP (UTP ctrl). No RT: reverse transcriptase was excluded from the RT reaction using RNA from proliferating fibroblasts. Means ± SD are shown. ***, P < 0.0005, unpaired Student’s t test. (B) Unbiased cap-dependent 5′ RACE PCR was performed to define the 5′ terminal end of the Raet1e transcripts. RNA samples from a panel of Raet1e+ cells were subject to 5′ RACE. In the first PCR reaction, a primer for the 5′ adapter was combined with p4 as the 3′ primer. The product was subjected to nested PCR with the same 5′ primer and primers p1, p2, or p3 as 3′ primers. Numerous splice variants were deduced from the sequences of the various products. Exon 3 is variably included in different mRNAs. Exon 2 was included, albeit rarely, in transcripts from one cell line, Nobo1 (not depicted). Exon 5, described in a previous study (Girardi et al., 2001), was not included in any of the Raet1e sequences we detected. (C) Activity of the Raet1e promoter in cell lines. The pGL3 vector containing the Raet1e promoter fragment in forward (F) or reverse (R) orientations was transfected into RAE-1–expressing Tramp-C1 and Nobo1 cells or RAE-1–negative WEHI 7.1 cells and the cells were incubated in 10% serum for 24 h. The activity of the SV40 promoter in the same reporter plasmid is shown for comparison (S). Means ± SD are shown. (D) Fibroblasts were transfected with pGL3 basic vectors containing the Raet1e promoter (−204 to +70) in forward or reverse orientation. The cells were incubated without serum (−) or with 10% serum (+) for 24 h (n = 3). Means ± SD are shown. ***, P < 0.0005, unpaired Student’s t test. Each panel in this figure is representative of at least three experiments.
To determine whether proliferative signals regulate the Raet1e promoter, we initially defined the promoter using a combination of 5′ RACE PCR, in silico promoter prediction analysis, and transactivation assays (Fig. 6 B and not depicted). When inserted in the GL3-Basic luciferase reporter plasmid lacking a promoter or an enhancer, a fragment of 274 bp that included 205 bp of the 5′ flanking region and 69 bp of the first exon, was active in supporting transcription when transfected transiently in cell lines that express Raet1 but less so in a cell line that does not (Fig. 6 C). The fragment was active only in the forward orientation, a characteristic of most promoters.
When transiently transfected into cultured tail fibroblasts, the Raet1 promoter reporter plasmid was active in cells cultured in 10% serum but only when the Raet1 promoter was in the forward orientation (Fig. 6 D). In serum-starved fibroblasts, in contrast, promoter activity was at least threefold less active, and the activity was independent of promoter orientation. These data indicated that the Raet1 promoter is a locus of regulation dependent on the proliferative status of the cells.
Transcriptional regulation of Raet1e by the E2F family of transcription factors
Given that proliferative signals regulate the Raet1 promoter, we evaluated the role of transcription factors known to play a role in regulating the cell cycle. E2F family members are known to regulate transcription of genes encoding CDKs and many other genes involved in proliferation, and are negatively regulated by pRb (Chen et al., 2009). Three activating E2F family members (E2F1-3) are essential for proliferation of fibroblasts in culture, although they are partially redundant with each other (Wu et al., 2001). Consistent with a role in Raet1 regulation, the transcripts of all three activating E2Fs decreased with kinetics similar to the reduction in Raet1e transcripts in serum-starved fibroblasts (Leone et al., 2000; not depicted). Sequence analysis suggested that numerous putative E2F sites localized to the 5′UTR, first exon, and first intron of the Raet1e gene, including two within the previously studied promoter fragment (Fig. 7, A and B). Considering that most active E2F1 binding sites (82%) overlap with CpG islands (Bieda et al., 2006), it was notable that the two putative E2F sites in the promoter were present in the Raet1e CpG island (Fig. 7 B). In a competition electrophoretic mobility shift assay (EMSA), the Raet1e promoter fragment containing the two putative E2F sites competed with a labeled fragment containing known E2F sites for binding to E2Fs in fibroblast nuclear extracts (Fig. 7 C). A Raet1e promoter fragment in which the core sequences of both putative E2F sites (SSCG) were mutated to ATAT competed substantially less efficiently, demonstrating the role of these sites in E2F binding.
Figure 7.

E2F transcription factors bind to the Raet1e promoter. (A) Putative E2F binding sites with consensus sequence TTTSSCGC (S = C or G, with up to two mismatches allowed only in the three T residues (Schulze et al., 1995; Bieda et al., 2006; Rabinovich et al., 2008) were localized throughout the Raet1e gene. (B) A schematic of the 5′end of the Raet1e locus. The region from −60 to +1 is enlarged to show the putative E2F binding sites. The CpG island is shown as a hatched box. (C) Competition EMSA showing binding of a Raet1e promoter fragment to E2F in fibroblast nuclear extracts. A labeled probe containing E2F sites from the DHFR promoter was incubated with fibroblast nuclear extract (NE) before gel analysis. Binding was competed away by preincubating the extract with a 100-, 200-, or 400-fold excess of unlabeled oligonucleotides, including the same DHFR promoter oligonucleotide, a Raet1e promoter oligonucleotide, or mutated versions of these oligonucleotides in which the E2F binding sites were replaced with nonfunctional sites (Mut DHFR and Mut Raet1e). (D) ChIP assays showing association of E2F1, E2F2, and E2F3 with the Raet1e promoter in proliferating (Serum) or starved fibroblasts. Control IP with IgG isotype is shown. PCR was performed with PCR primers designed to yield a 165 bp product corresponding to −147 to +18 of the Raet1e promoter (left) or primers of the p107 promoter region were used (right). The input lane represented 0.3% of the amount of chromatin used in the ChIP assays. The gel was cut at every set of four semiquantitative PCR and aligned. Black lines indicate that intervening lanes were spliced out. Each panel in this figure is representative of four independent experiments.
Chromatin immunoprecipitation assays confirmed that E2F1, E2F2, and E2F3 were associated with the Raet1 promoter in chromatin extracted from proliferating cells (Fig. 7 D, left). Approximately fourfold less E2F was associated with the Raet1 promoter in chromatin extracted from fibroblasts that had been starved of serum for 3 d (Fig. 7 D, left). E2Fs associated similarly with the p107 gene, a known target for all three activating E2Fs (Iaquinta et al., 2005; Fig. 7 D, right).
To investigate whether E2F1 activates the Raet1e promoter reporter construct described in Fig. 6 D, fibroblasts maintained in 0% serum were cotransfected with the reporter construct and increasing amounts of a pcDNA vector encoding E2F1. Compared with cotransfection with empty vector, cotransfection with E2F1 caused a strong transactivation of the Raet1e promoter construct, to levels even higher than observed when cells were grown in 10% serum (Fig. 8 A, left). E2F1 was much less effective in activating a Raet1e reporter plasmid in which both putative E2F sites were mutated, indicating that E2F transcription factors directly bind and activate the Raet1e promoter construct (Fig. 8 A, right).
Figure 8.

Transactivation of Raet1e expression by E2Fs, and siRNA knockdowns. (A and B) Fibroblasts were transfected with 50 ng pGL3 vector containing the Raet1e promoter segment or corresponding segments in which putative E2F sites (A) or a putative MYC site (B) were mutated, along with varying amounts of pcDNA encoding E2F1 or MYC (0, 100, 250, or 750 ng in the left panel of A, and 0, 250, or 750 ng in the remaining panels). Cells were incubated in 0% serum for 24 h except the 10% serum sample in the left panel of A. Open and shaded boxes represent E2F and MYC sites, respectively; Xs indicate mutations that prevent factor binding. (C) Primary fibroblasts were transfected with the reporter plasmid containing the WT Raet1e promoter or the promoter in which both E2F sites were mutated, and the MYC site was mutated or all three sites were mutated. The transfected cells were incubated for 40 h in 0 or 10% serum before analysis of reporter activity. (D) Endogenous Raet1e expression in fibroblasts transduced with E2F1, E2F2, E2F3, or GFP only (empty) and cultured for 48 h in the absence of serum. DHFR is a known E2F target gene. n = 3. (E) siRNA knockdowns of E2Fs separately or together inhibit Raet1e expression in proliferating fibroblasts 48 h later (P < 0.0005 for all E2F groups vs. negative control). Data were normalized to 18S rRNA amounts and then to the all star negative control sample. n = 8−9. Each result in this figure is representative of at least four independent experiments. The asterisks denote significance (*, P < 0.05; **, P < 0.005).
The promoter fragment also contains a putative c-MYC site (Unni et al., 2008), a finding which led to the proposal that c-MYC regulates the Raet1e gene. Compared with cotransfection with an E2F expression vector, cotransfection of a c-MYC expression vector with the Raet1 promoter reporter caused a modest induction of luciferase (Fig. 8 B). Although this transactivation was significant, a reporter with an inactivating CACGTG to CAGCTG mutation (Kato et al., 1992) in the previously reported c-MYC site was transactivated equally as well as the WT reporter (Fig. 8 B). Moreover, although the WT Raet1e promoter supported luciferase production in proliferating cells (10% FCS) that had not been transfected with E2F or c-MYC, mutation of the putative MYC binding site in the promoter did not impair promoter activity in such cells (Fig. 8 C). In contrast, mutation of both E2F sites caused a significant reduction in promoter activity in proliferating cells. Collectively, these data indicated that E2Fs act directly on the Raet1e promoter in proliferating cells, whereas c-MYC is likely to act indirectly, probably by inducing E2F transcription, an activity of c-MYC which was previously documented elsewhere (Leone et al., 1997).
Transduction of E2F1, E2F2, or E2F3 in cells cultured without serum also transactivated the endogenous Raet1e gene (Fig. 8 D), demonstrating that E2Fs induce transcription of the chromatinized Raet1e gene in its natural context. The extent of induction with different E2Fs varied in different experiments but, in each case, was roughly commensurate with induction of a known E2F target, DHFR, determined in parallel (Fig. 8 D).
Finally, to investigate whether endogenous E2Fs play a necessary role in supporting Raet1e gene expression, E2F expression in proliferating fibroblasts was inhibited by transfection of siRNAs specific for each activating E2F. SiRNAs against E2F1, E2F2, and E2F3 each caused a substantial reduction in Raet1e transcripts to nearly the same extent as a mixture of the three siRNAs (Fig. 8 E). Of note, although each E2F siRNA targeted nonhomologous sequences in the corresponding target E2F mRNA, they each caused reductions in the amounts of the other two activating E2Fs (unpublished data). This is likely a result of the fact that E2F transcription factors autoregulate E2F genes, which had been documented previously based on the findings that each E2F promoter contains E2F binding sites, and mutation of E2F sites in the E2F2 promoter region abrogated transactivation of the E2F2 promoter (Leung et al., 2008). Collectively, the data demonstrate that E2F transcription factors bind and transactivate the Raet1e promoter, play an important role in supporting Raet1 transcription in proliferating cells, and function potentially redundantly in driving Raet1 transcription.
DISCUSSION
Deregulated proliferation is a hallmark of malignancy, and it is known that infections can deregulate proliferative pathways as well (Lavia et al., 2003). Although a previous study implied that expression of MICA is correlated with proliferation, it was not ruled out that the DNA damage response or other stress pathways induced in proliferating cells accounted for the MICA expression (Venkataraman et al., 2007). In contrast, in our analysis of RAE-1 induction, we ruled out numerous stress pathways and tumor suppressors known to be activated in proliferating cells, and we demonstrated a direct linkage with E2F transcription factors, which regulate the cell cycle. The demonstration that proliferation-related signals profoundly induce Raet1e transcription via the action of E2F transcription factors provides a new conceptual framework for understanding the role of the NKG2D–ligand axis in immune responses.
It is notable that RAE-1 induction in proliferating primary fibroblasts was not dependent on the DNA damage checkpoint response pathway, which is initiated by ATM or ATR. A role of the DNA damage response in ligand induction has been demonstrated in numerous cell lines treated with genotoxic drugs and in untreated tumor cells that constitutively express NKG2D ligands (Gasser et al., 2005; Cerboni et al., 2007). In the present case, as well as in an instance of virus-induced RAE-1 expression in fibroblast cell lines (Tokuyama et al., 2011), the DNA damage response does not play a significant role. The basis of these differences is not known, but it could simply reflect redundancy in the mechanisms of NKG2D ligand induction. For example, the DNA damage response acts primarily to stabilize Raet1 mRNA, whereas E2F acts transcriptionally, so it is possible that sufficiently strong transcriptional activation of RAE-1 in proliferating cells provides robust cell surface RAE-1 despite the absence of mRNA-stabilizing conditions. Alternatively, the cellular requirements for ligand induction may differ depending on the differentiation or activation state of the cells.
Proliferation in normal tissues and RAE-1 expression
Obviously, proliferation is not restricted to malignant cells but also occurs during development of normal tissues and during processes of tissue renewal. Our data showed that RAE-1 induction occurs even in normal cells undergoing proliferation in vivo, that is, in embryonic day 14 (E14) embryonic brain cells or in cells in healing wounds. Notably, E2F transcription factors are also strongly induced in healing wounds (D’Souza et al., 2002; unpublished data) and are expressed strongly in midgestation embryonic brain tissue, with the levels diminishing later in gestation (Dagnino et al., 1997). RAE-1 induction in normal tissues was surprising because it seems potentially maladaptive for normal proliferating cells to display NKG2D ligands. Fetal brain cells are presumably under no threat, however, because mature NK cells appear after birth, after RAE-1 expression on brain cells is extinguished. In the case of cells in healing wounds, in contrast, our data suggest that expression of RAE-1ε and another skin-specific NKG2D ligand (H60c; Whang et al., 2009) by cells in the wound has a beneficial effect by accelerating wound healing. The specialized γδ T cells that reside in the skin (Havran, 2000; Girardi et al., 2001; Gray et al., 2011) express NKG2D (Jameson et al., 2002) and respond to stimulation by producing growth factors that accelerate wound healing (Havran, 2000). In addition to up-regulating RAE-1ε, wounded skin cells up-regulate another NKG2D ligand H60c, at least at the mRNA level (Whang et al., 2009), and we suspect that both ligands play a role in the acceleration of wound healing documented here. It remains possible that distinct stress pathways that are activated in wounded skin (Oberringer et al., 1995; Schäfer and Werner, 2008) cooperate with proliferative signals to amplify RAE-1ε expression.
Integration of stress and proliferation in the induction of RAE-1ε
Whereas proliferation is important for inducing Raet1e transcription, it is probably not sufficient for inducing RAE-1 at the cell surface in all conditions or cell types. One important factor is likely to be the intensity of proliferation, as suggested by our finding that proliferating brain cells at day 18 of gestation, which proliferate less than those at day 14, do not express appreciable RAE-1ε (Fig. 4 A). Also consistent with this idea is that substantially more E2F1 plasmid was required for induction of Raet1 in our experiments than was required for induction of other targets as reported elsewhere (Ohtani et al., 1995; Stiewe and Pützer, 2000; Ma et al., 2003).
In addition, cell types are likely to vary in the extent to which proliferation suffices to induce NKG2D ligands, as suggested by the fact that proliferating T cells in vitro expressed relatively small amounts of NKG2D ligands or none at all (Diefenbach et al., 2000; Cerboni et al., 2007). It is possible that ligand expression is repressed specifically in lymphocytes, which proliferate as part of their normal program and are surrounded by NK cells. Alternatively, another signal, in addition to the proliferative signal, may be required for ligand expression in those cells.
Indeed, many studies have identified other stress pathways that regulate NKG2D ligands, which may act cooperatively with proliferative signals to regulate RAE-1 and other NKG2D ligands. Many of these pathways act at different stages of biogenesis of NKG2D ligands. For example, the DNA damage response pathway induces Raet1 expression, but it acts to augment the stability of Raet1 transcripts and does not augment transcription (unpublished data). Heat shock induces the MULT1 protein by decreasing the rate of ubiquitin-dependent MULT1 degradation (Nice et al., 2009). The PI3K pathway, which supports RAE-1 expression in both virus-infected cells and tumor cell lines, may act in part by regulating protein translation as well as by stimulating cell proliferation (Tokuyama et al., 2011). Some stress pathways augment transcription as well, including the heat shock pathway, which regulates MICA transcription (Venkataraman et al., 2007), and the tumor suppressor p53, which augments transcription of one of the human ULBP proteins (Textor et al., 2011).
We propose that in some cells or circumstances, these levels of regulation may serve as serial checkpoints, regulated by distinct stimuli, to ensure that ligands are induced only in diseased cells and not in normal cells. In certain cases, for example in fibroblasts stimulated to undergo intense proliferation, the posttranscriptional checkpoints may be overwhelmed as a result of the magnitude of Raet1e transcriptional induction. Understanding the cooperation of the individual signals and stress pathways and their contribution for different ligands and in different tissues or tumors will provide additional insights concerning the biological function of NKG2D and, by extension, NK recognition.
Redundancy and activities of E2F transcription factors
Notably, in addition to regulating cell cycle progression, E2F can exert a role in the DNA damage response by inducing target genes that function in DNA repair and recombination and DNA damage checkpoints. E2F1 is directly phosphorylated by ATM, and acetylation, also driven by the DNA damage response, potentiates the apoptotic functions of E2F1. Therefore, E2Fs may play a role in both NKG2D ligand transcription and the posttranscriptional regulation exerted by the DNA damage response.
E2F1, 2, and 3 redundantly regulate many transcriptional targets and the proliferation of mouse embryonic fibroblasts in vitro (Wu et al., 2001). Our transactivation data suggest they redundantly regulate Raet1e, as well, but we could not corroborate this in knockdown experiments because knockdowns of each E2F family member dampened expression of the others. Notably, however, we observed no defect in RAE-1 expression in proliferating fibroblasts from E2F1−/− mice, consistent with the proposal that E2F1–3 redundantly regulate Raet1 (unpublished data).
The findings reported here link cell cycle control directly to the induction of NKG2D ligands and provide a new framework for understanding the regulation of this component of the immune system. Further analysis of the roles played by E2Fs in regulating NKG2D ligands may provide new approaches for understanding how processes associated with tumorigenesis and infections lead to elimination of unhealthy cells by immune cells. At the same time, the results provide new perspectives for understanding the roles of NKG2D in processes beyond tumorigenesis and infections, such as wound healing.
MATERIALS AND METHODS
Mice, cells, antibodies, and reagents.
Fibroblasts from >8 wk old C57BL/6J or specific knockout mice were prepared as previously described (Lander et al., 1978) in DMEM with 10% FCS, 100 U/ml penicillin, 100 µg/ml streptomycin, 0.2 mg/ml glutamine, 10 µg/ml gentamycin sulfate, 20 mM Hepes, and 50 µM 2-mercaptoethanol. For Atr deletion in ear fibroblasts from Atrfloxed/−Cre-ERT2+ mice (Ruzankina et al., 2007), fibroblasts were cultured in the presence of 100 nM tamoxifen, which was changed every day. Pan–RAE-1 mAb (186107), RAE-1ε mAb (205001), and MULT1 mAb (237104) were purchased from R&D Systems. PE-conjugated goat F(ab’)2 fragment to rat IgG was purchased from Jackson ImmunoResearch Laboratories. BrdU staining was performed with biotin-conjugated BrdU antibody (MoBU-1; BioLegend) using the BrdU flow kit (BD). SB218078 was purchased from Calbiochem and KU55933 was purchased from VWR. All animal procedures were performed according National Institutes of Health guidelines under protocols approved by the University of California Animal Care and Use Committee.
Nuclear run-on transcription assay.
Nuclei were isolated by incubating fibroblast cell pellets with 5 ml of swelling buffer (10 mM Tris-HCl, pH 7.5, 2 mM MgCl2, and 3 mM CaCl2) and incubated at 4°C for 5 min, followed by centrifugation. Cells were resuspended in lysis buffer (swelling buffer + 0.5% NP-40 + 2 U/ml Superase In [Ambion] + 10% glycerol) and pipetted ∼20–30 times with a p1000 pipette to disrupt the membrane. After washing with lysis buffer, pelleted cells were resuspended with 100 µl of freezing media (50 mM Tris-HCl, pH 8.3, 40% [vol/vol] glycerol, 5 mM MgCl2, 0.1 mM EDTA + 10× protease inhibitor [complete mini, EDTA-free; Roche]) and frozen. For the assays, 100 µl nuclei solution was mixed with 0.1 ml reaction buffer (10 mM Tris-HCl, pH 8.0, 5 mM MgCl2, 300 mM KCl, 0.5 mM ATP/CTP/GTP, and Br-UTP [Invitrogen]) and incubated at 30°C for 15 min. DNaseI was added to the mixture and the reaction was incubated for another 30 min at 37°C, followed by TRIZOL addition and RNA extraction.
Immunoprecipitation of Br-UTP–labeled RNA was performed as previously described (Core et al., 2008) with modifications. BrdU antibody–agarose complex (IIB5-AC; Santa Cruz Biotechnology, Inc.), which cross-reacts with Br-UTP, was blocked with 0.1% Polyvinylpyrrolidone and 1 µg/ml BSA. The labeled RNA was incubated with antibody–bead complexes in binding buffer (0.5× SSPE, 1 mM EDTA, and 0.05% Tween) for 60 min. After washing (5× with binding buffer; 1× with low salt buffer [0.2× SSPE, 1 mM EDTA, and 0.05% Tween), 1× with high salt buffer [low salt buffer + 137.5 mM NaCl], and 2× with TET buffer [TE + 0.05% Tween]), the RNA–antibody complex was eluted 4× with 125 µl of elution buffer (20 mM DTT, 300 mM NaCl, 5 mM Tris-HCl, pH 7.5, 1 mM EDTA, and 0.1% SDS) at 37°C for 5 min with vortexing every minute. The combined eluates were extracted with TRIZOL (Invitrogen).
Quantitative RT-PCR.
Total RNA isolated using TRIzol (Invitrogen) was digested with DNase (Ambion) and reverse transcribed with Superscript III reverse transcription (Invitrogen). Triplicate amplification mixtures were prepared with 0.01–1 µg cDNA, SYBR GreenER SuperMix (Invitrogen), and 200 nM of forward and reverse primers and cycled using the ABI 7300 Real-Time PCR system as follows: 50°C for 2 min, 95°C for 10 min, and 40 cycles of 95°C for 15 s and 60°C for 60 s. All results were normalized based on parallel qRT-PCR of 18s rRNA.
Primers.
See Table 1 for a list of primers.
Table 1.
Primers
| Gene | Forward | Reverse |
| Raet1e | 5′-CAGGTGACCCAGGGAAGATG-3′ | 5′-CTCAACTCCTGGCACAAATCG-3′ |
| Unspliced Raet1e | 5′-ATTTGTGCCAGGAGTTGAGG-3′ | 5′-CCTGCATGTACTCTGCCCTT-3′ |
| E2f1 | 5′-GCCCTTGACTATCACTTTGGTCTC-3′ | 5′-CCTTCCCATTTTGGTCTGCTC-3′ |
| E2f2 | 5′-GCCACCACCTACTACACTTCG-3′ | 5′-CGGAATTCAGGGACCGTAG-3′ |
| E2f3 | 5′-GCCTCTACACCACGCCACAAG-3′ | 5′-TCGCCCAGTTCCAGCCTTC-3′ |
| c-Myc | 5′-CAGAGGAGGAACGAGCTGAAGCGC-3′ | 5′-TTATGCACCAGAGTTTCGAAGCTGTTCG-3′ |
| DHFR | 5′-CTGGTTCTCCATTCCTGAGAAG-3′ | 5′-GCCACCAACTATCCAGACCATG-3′ |
| 18s rRNA | 5′-GTCTGTGATGCCCTTAGATG-3′ | 5′-AGCTTATGACCCGCACTTAC-3′ |
| Raet1e promoter | 5′-GGCTGTAATTTGCACACTCG-3′ | 5′-GGAGCAGGTAACTGACTACAGC-3′ |
| p107 promoter | 5′-TTAGAGTCCGAGGTCCATCTTCT-3′ | 5′-GGGCTCGTCCTCGAACATATCC-3′ |
Plasmids, transfection, and transduction.
The pGL3-Raet1e promoter constructs consisted of promoter fragments inserted between the HindIII and XhoI sites in the pGL3 vector. The E2F1 (−56 and −10) and C-MYC binding site mutants were made with the QuikChange kit (Agilent Technologies). pcDNA-CMV-E2F1 (a gift from P.J. Farnham, University of California, Davis, Davis, CA) was described previously (Li et al., 1994). pCMV6-E2F2 was purchased from OriGene. pCX-c-Myc plasmid was purchased from Addgene. pBABE-E2F1, E2F3, and pMSCV-E2F2 retroviral expression vectors were gifts from S. Gasser (National University of Singapore, Singapore).
All plasmid and siRNA transfections were performed with Lipofectamine 2000 (Invitrogen). Plasmid transfections were done in Opti-MEM (Invitrogen) using 0.8 µg of total DNA and 2 µl lipofectamine per well in 24-well plates. Retroviral supernatants for transductions were generated by cotransfecting 293T cells with plasmids encoding VSV gag/pol, env, and pMSCV or pBABE retroviral constructs. After 24 h, culture supernatants were collected and added directly to actively proliferating fibroblasts. RNA was harvested 48 h after transduction using TRIZOL. For siRNA knockdown experiments, fibroblasts were transfected with 10 pmol siRNA against E2F1 (Mm_E2f1_1; QIAGEN), E2F2 (Mm_E2f2_1), E2F3 (Mm_E2f3_1), b2m (Mm_B2m_2), or negative control (1027280; QIAGEN). RNA was harvested 48 h after transfection.
Dual luciferase reporter assay.
Fibroblasts were transfected with 50 ng of reporter construct, 0.1 ng pRL (Renilla reporter plasmid), and increasing amounts of pcDNA-E2F1 (100–750 ng). As necessary, the total mass of transfected DNA in each sample was adjusted to 800 ng by adding empty vector plasmid DNA. Data are presented as means ± SD of triplicate determinations. The Dual-Luciferase Reporter Assay System (Promega) was used to measure luciferase luminescence using LMAXII384.
Cytotoxicity assay.
4-h chromium release assays were performed as described elsewhere (Whang et al., 2009). The spontaneous release was, in all cases, <20% of the maximum release. The percentage of specific 51Cr release was calculated according to the following formula: % specific lysis = 100 × (experimental − spontaneous release)/(detergent release − spontaneous release). In some experiments, LIVE/DEAD fixable stain kits (Invitrogen) were used to measure the killing of target cells. NK cells and the target cells were incubated for 2 h and the total cells were stained with green LIVE/DEAD fluorescent dye to detect dead cells, followed by staining with CD45 antibody to distinguish the target cells and the effector cells. The percentage of green cells (dead cells) in the CD45 negative population was used to calculate the percentage of specific lysis according to the following formula: % specific lysis = 100 × (% experimental dead cells − % spontaneous dead cells)/(100% − % spontaneous dead cells).
Immunofluorescence.
Tissues were frozen in O.C.T. freezing medium and cut into ∼7–10 µm sections, which were fixed with cold acetone for 15 min and blocked with 10% donkey serum for 1 h at room temperature. The slides were stained with RAE-1ε antibody (1:100) overnight, followed by Alexa Fluor 555–conjugated anti–rat IgG antibody. For BrdU staining, sections were fixed with acetone and incubated 1 M HCl for 10 min on ice, 2 M HCl for 10 min at room temperature, and 2 M HCl for 20 min at 37°C to access nuclear DNA. The sections were immediately neutralized with 0.1 M borate buffer for 10 min at room temperature and washed three times with 0.1% Triton X-100. Coverslips were mounted on slides with Vectashield with DAPI (Vector Laboratories) and the fluorescent signal was visualized using a microscope (Eclipse E800; Nikon).
Fetal brain cell analysis.
Brains from E14 and E18 fetuses were frozen in O.C.T. freezing medium (Tissue-Tek) for immunofluorescence or dissociated into single cell suspensions for flow cytometry by pressing the brain fragments through nylon meshes without enzymatic treatments. In some experiments, pregnant mothers were injected i.p. with 50 mg/kg BrdU 16 h before sacrifice.
Wound healing.
Mice were anesthetized with isoflurane, their backs were shaved, and a 2-mm punch tool was used to create full-thickness skin wounds, as previously described (Jameson et al., 2002). For wound size measurements, mice were sacrificed 0–3 d after wounding and the back skin was peeled off, laid flat on a culture dish filled with DMEM, and photographed from a constant distance (20 cm). The area of the wound opening was marked by freehand shaping and quantified using ImageJ software (National Institutes of Health). In some of the experiments, mice were injected i.p. with 50 mg/kg BrdU 1 d before sacrifice.
Wounded mice were euthanized 1–4 d after wounding and the skin was excised including the border ∼1 mm around the wound. The excised skin was flash frozen with liquid nitrogen and ground with a mortar and pestle. Total cellular RNA was extracted using TRIZOL (Invitrogen).
Chromatin immunoprecipitation.
Fibroblasts were harvested with trypsin and resuspended in DMEM 10% FCS. Fixing solution (0.1 M NaCl, 1 mM EDTA, 0.5 mM EGTA, 50 mM Hepes, pH 8.0, and 11% formaldehyde) was added to the medium to achieve a final concentration of 1% formaldehyde and cross-linking proceeded for 10 m at RT. After adding glycine to a concentration of 0.125 M to stop the reaction and washing twice with cold PBS, lysates were sonicated to shear the genomic DNA into 200–600 bp fragments (30% amplification, 20 s, 8–10×). The previous day, polyclonal antibodies specific for E2F1 (KH95; Santa Cruz Biotechnology, Inc.), E2F2 (C-20; Santa Cruz Biotechnology, Inc.), or E2F3 (C-20; Santa Cruz Biotechnology, Inc.) were blocked with BSA and incubated with Dynal beads (Invitrogen) overnight at 4°C. Sonicated samples were immunoprecipitated overnight at 4°C with antibody–beads complexes. After extensive washing (3× with low salt wash buffer, 1× with high salt wash buffer, 1× with LiCl Wash Buffer, and 2× with TE Buffer), the complexes were eluted at 65°C for 30 min with elution buffer (10 mM Tris, pH 8.0, 1 mM EDTA, and 1% SDS). The cross-links were reversed by adding NaCl to a final concentration of 0.2 M and heating the samples to 65°C overnight. The eluted material was phenol-chloroform extracted, ethanol precipitated, and resuspended in 50 µl of water.
EMSA.
4 µg of fibroblast nuclear extract was incubated with the 20 fmol of a biotinylated DNA probe at room temperature for 20 min in 1× binding buffer (Thermo Fisher Scientific) + glycerol + MgCl2. Complexes were separated on a 6% polyacrylamide non-denaturing gel and transferred to a nylon membrane for detection using the light-shift EMSA kit (Thermo Fisher Scientific). In the competition experiments, varying amounts of unlabeled competitor oligonucleotides were preincubated with extract for 20 min before adding biotinylated DNA.
The probe was a 5′ biotin-labeled 26 bp oligonucleotide and its complement consisting of a segment of the DHFR promoter that contains E2F sites (Li et al., 1994; 5′-GCTGCGATTTCGCGCCAAACTTGACG-3′, the two overlapping E2F sites are underlined). As unlabeled competitors, we used the same DHFR promoter segment, a DHFR promoter oligo with mutated E2F sites (5′-CGTCAAGTTTATATATAAATCGCAGC-3′, mutant base pairs underlined; Li et al., 1994), a 61-bp oligonucleotide corresponding to a segment of the Raet1e promoter that contains E2F sites (5′-GGCTTCCCCGCGGGCGGCGCCTTCCGCCCTCCGCCATTGTGTCCATCCCCTGCCCGCAGAG-3′, E2F sites underlined), and a Raet1e promoter oligonucleotide in which the E2F sites were mutated (5′-GGCTTCATATCGGGCGGCGCCTTCCGCCCTCCGCCATTGTGTCCATCCCCTGATATCAGAG-3′, mutant base pairs underlined).
Statistical analysis.
Data were analyzed using an unpaired Student’s t test. Values of P < 0.05 were considered statistically significant.
Acknowledgments
We thank G. Barton and R. Vance for critical comments on the manuscript, T. Nice, N. Shifrin, M. Whang, and S. Gasser for discussions, and L. Wang and L. Zhang for assistance. We thank E. Brown for ear tissues from ATRfloxed/−Cre-ERT2+ mice, E. Flores for tails from p73−/− mice, and H. Nolla and A. Valeros for help with flow cytometry.
This work was supported by grants from the National Institutes of Health to D.H. Raulet. H. Jung was supported by a scholarship from the Samsung Scholarship Foundation.
The authors have no conflicting financial interests.
Footnotes
Abbreviations used:
- ATM
- ataxia-telangiectasia mutated
- CDK
- cyclin-dependent kinase
- CHK1
- checkpoint kinase 1
- EMSA
- electrophoretic mobility shift assay
- H60a
- histocompatibility 60
- MULT1
- murine UL16-binding protein-like transcript 1
- RAE-1
- retinoic acid early inducible gene 1
References
- Bieda M., Xu X., Singer M.A., Green R., Farnham P.J. 2006. Unbiased location analysis of E2F1-binding sites suggests a widespread role for E2F1 in the human genome. Genome Res. 16:595–605 10.1101/gr.4887606 [DOI] [PMC free article] [PubMed] [Google Scholar]
- Cerboni C., Zingoni A., Cippitelli M., Piccoli M., Frati L., Santoni A. 2007. Antigen-activated human T lymphocytes express cell-surface NKG2D ligands via an ATM/ATR-dependent mechanism and become susceptible to autologous NK- cell lysis. Blood. 110:606–615 10.1182/blood-2006-10-052720 [DOI] [PubMed] [Google Scholar]
- Champsaur M., Lanier L.L. 2010. Effect of NKG2D ligand expression on host immune responses. Immunol. Rev. 235:267–285 [DOI] [PMC free article] [PubMed] [Google Scholar]
- Chen H.Z., Tsai S.Y., Leone G. 2009. Emerging roles of E2Fs in cancer: an exit from cell cycle control. Nat. Rev. Cancer. 9:785–797 10.1038/nrc2696 [DOI] [PMC free article] [PubMed] [Google Scholar]
- Core L.J., Waterfall J.J., Lis J.T. 2008. Nascent RNA sequencing reveals widespread pausing and divergent initiation at human promoters. Science. 322:1845–1848 10.1126/science.1162228 [DOI] [PMC free article] [PubMed] [Google Scholar]
- D’Souza S.J., Vespa A., Murkherjee S., Maher A., Pajak A., Dagnino L. 2002. E2F-1 is essential for normal epidermal wound repair. J. Biol. Chem. 277:10626–10632 10.1074/jbc.M111956200 [DOI] [PubMed] [Google Scholar]
- Dagnino L., Fry C.J., Bartley S.M., Farnham P., Gallie B.L., Phillips R.A. 1997. Expression patterns of the E2F family of transcription factors during mouse nervous system development. Mech. Dev. 66:13–25 10.1016/S0925-4773(97)00083-X [DOI] [PubMed] [Google Scholar]
- Daston G., Faustman E., Ginsberg G., Fenner-Crisp P., Olin S., Sonawane B., Bruckner J., Breslin W., McLaughlin T.J. 2004. A framework for assessing risks to children from exposure to environmental agents. Environ. Health Perspect. 112:238–256 [DOI] [PMC free article] [PubMed] [Google Scholar]
- Diefenbach A., Jamieson A.M., Liu S.D., Shastri N., Raulet D.H. 2000. Ligands for the murine NKG2D receptor: expression by tumor cells and activation of NK cells and macrophages. Nat. Immunol. 1:119–126 10.1038/77793 [DOI] [PubMed] [Google Scholar]
- Eagle R.A., Trowsdale J. 2007. Promiscuity and the single receptor: NKG2D. Nat. Rev. Immunol. 7:737–744 10.1038/nri2144 [DOI] [PubMed] [Google Scholar]
- Gariglio P., Bellard M., Chambon P. 1981. Clustering of RNA polymerase B molecules in the 5′ moiety of the adult beta-globin gene of hen erythrocytes. Nucleic Acids Res. 9:2589–2598 10.1093/nar/9.11.2589 [DOI] [PMC free article] [PubMed] [Google Scholar]
- Gasser S., Orsulic S., Brown E.J., Raulet D.H. 2005. The DNA damage pathway regulates innate immune system ligands of the NKG2D receptor. Nature. 436:1186–1190 10.1038/nature03884 [DOI] [PMC free article] [PubMed] [Google Scholar]
- Girardi M., Oppenheim D.E., Steele C.R., Lewis J.M., Glusac E., Filler R., Hobby P., Sutton B., Tigelaar R.E., Hayday A.C. 2001. Regulation of cutaneous malignancy by gammadelta T cells. Science. 294:605–609 10.1126/science.1063916 [DOI] [PubMed] [Google Scholar]
- Gray E.E., Suzuki K., Cyster J.G. 2011. Cutting edge: Identification of a motile IL-17-producing gammadelta T cell population in the dermis. J. Immunol. 186:6091–6095 10.4049/jimmunol.1100427 [DOI] [PMC free article] [PubMed] [Google Scholar]
- Guerra N., Tan Y.X., Joncker N.T., Choy A., Gallardo F., Xiong N., Knoblaugh S., Cado D., Greenberg N.M., Raulet D.H. 2008. NKG2D-deficient mice are defective in tumor surveillance in models of spontaneous malignancy. Immunity. 28:571–580 10.1016/j.immuni.2008.02.016 [DOI] [PMC free article] [PubMed] [Google Scholar]
- Havran W.L. 2000. A role for epithelial gammadelta T cells in tissue repair. Immunol. Res. 21:63–69 10.1385/IR:21:2-3:63 [DOI] [PubMed] [Google Scholar]
- Iaquinta P.J., Aslanian A., Lees J.A. 2005. Regulation of the Arf/p53 tumor surveillance network by E2F. Cold Spring Harb. Symp. Quant. Biol. 70:309–316 10.1101/sqb.2005.70.050 [DOI] [PubMed] [Google Scholar]
- Jameson J., Ugarte K., Chen N., Yachi P., Fuchs E., Boismenu R., Havran W.L. 2002. A role for skin gammadelta T cells in wound repair. Science. 296:747–749 10.1126/science.1069639 [DOI] [PubMed] [Google Scholar]
- Jamieson A.M., Diefenbach A., McMahon C.W., Xiong N., Carlyle J.R., Raulet D.H. 2002. The role of the NKG2D immunoreceptor in immune cell activation and natural killing. Immunity. 17:19–29 10.1016/S1074-7613(02)00333-3 [DOI] [PubMed] [Google Scholar]
- Kamijo T., Zindy F., Roussel M.F., Quelle D.E., Downing J.R., Ashmun R.A., Grosveld G., Sherr C.J. 1997. Tumor suppression at the mouse INK4a locus mediated by the alternative reading frame product p19ARF. Cell. 91:649–659 10.1016/S0092-8674(00)80452-3 [DOI] [PubMed] [Google Scholar]
- Kato G.J., Lee W.M., Chen L.L., Dang C.V. 1992. Max: functional domains and interaction with c-Myc. Genes Dev. 6:81–92 10.1101/gad.6.1.81 [DOI] [PubMed] [Google Scholar]
- Lander M.R., Moll B., Rowe W.P. 1978. A procedure for culture of cells from mouse tail biopsies: brief communication. J. Natl. Cancer Inst. 60:477–478 [PubMed] [Google Scholar]
- Lavia P., Mileo A.M., Giordano A., Paggi M.G. 2003. Emerging roles of DNA tumor viruses in cell proliferation: new insights into genomic instability. Oncogene. 22:6508–6516 10.1038/sj.onc.1206861 [DOI] [PubMed] [Google Scholar]
- Leone G., DeGregori J., Sears R., Jakoi L., Nevins J.R. 1997. Myc and Ras collaborate in inducing accumulation of active cyclin E/Cdk2 and E2F. Nature. 387:422–426 10.1038/387422a0 [DOI] [PubMed] [Google Scholar]
- Leone G., Nuckolls F., Ishida S., Adams M., Sears R., Jakoi L., Miron A., Nevins J.R. 2000. Identification of a novel E2F3 product suggests a mechanism for determining specificity of repression by Rb proteins. Mol. Cell. Biol. 20:3626–3632 10.1128/MCB.20.10.3626-3632.2000 [DOI] [PMC free article] [PubMed] [Google Scholar]
- Leung J.Y., Ehmann G.L., Giangrande P.H., Nevins J.R. 2008. A role for Myc in facilitating transcription activation by E2F1. Oncogene. 27:4172–4179 10.1038/onc.2008.55 [DOI] [PubMed] [Google Scholar]
- Li Y., Slansky J.E., Myers D.J., Drinkwater N.R., Kaelin W.G., Farnham P.J. 1994. Cloning, chromosomal location, and characterization of mouse E2F1. Mol. Cell. Biol. 14:1861–1869 10.1128/MCB.14.3.1861 [DOI] [PMC free article] [PubMed] [Google Scholar]
- Loo D.T., Fuquay J.I., Rawson C.L., Barnes D.W. 1987. Extended culture of mouse embryo cells without senescence: inhibition by serum. Science. 236:200–202 10.1126/science.3494308 [DOI] [PubMed] [Google Scholar]
- Ma Y., Yuan J., Huang M., Jove R., Cress W.D. 2003. Regulation of the cyclin D3 promoter by E2F1. J. Biol. Chem. 278:16770–16776 10.1074/jbc.M212702200 [DOI] [PubMed] [Google Scholar]
- Mah L.J., El-Osta A., Karagiannis T.C. 2010. gammaH2AX: a sensitive molecular marker of DNA damage and repair. Leukemia. 24:679–686 10.1038/leu.2010.6 [DOI] [PubMed] [Google Scholar]
- Nice T.J., Coscoy L., Raulet D.H. 2009. Posttranslational regulation of the NKG2D ligand Mult1 in response to cell stress. J. Exp. Med. 206:287–298 10.1084/jem.20081335 [DOI] [PMC free article] [PubMed] [Google Scholar]
- Oberringer M., Baum H.P., Jung V., Welter C., Frank J., Kuhlmann M., Mutschler W., Hanselmann R.G. 1995. Differential expression of heat shock protein 70 in well healing and chronic human wound tissue. Biochem. Biophys. Res. Commun. 214:1009–1014 10.1006/bbrc.1995.2386 [DOI] [PubMed] [Google Scholar]
- Ohtani K., DeGregori J., Nevins J.R. 1995. Regulation of the cyclin E gene by transcription factor E2F1. Proc. Natl. Acad. Sci. USA. 92:12146–12150 10.1073/pnas.92.26.12146 [DOI] [PMC free article] [PubMed] [Google Scholar]
- Parrinello S., Samper E., Krtolica A., Goldstein J., Melov S., Campisi J. 2003. Oxygen sensitivity severely limits the replicative lifespan of murine fibroblasts. Nat. Cell Biol. 5:741–747 10.1038/ncb1024 [DOI] [PMC free article] [PubMed] [Google Scholar]
- Raulet D.H. 2003. Roles of the NKG2D immunoreceptor and its ligands. Nat. Rev. Immunol. 3:781–790 10.1038/nri1199 [DOI] [PubMed] [Google Scholar]
- Raulet D.H., Guerra N. 2009. Oncogenic stress sensed by the immune system: role of natural killer cell receptors. Nat. Rev. Immunol. 9:568–580 10.1038/nri2604 [DOI] [PMC free article] [PubMed] [Google Scholar]
- Ruzankina Y., Pinzon-Guzman C., Asare A., Ong T., Pontano L., Cotsarelis G., Zediak V.P., Velez M., Bhandoola A., Brown E.J. 2007. Deletion of the developmentally essential gene ATR in adult mice leads to age-related phenotypes and stem cell loss. Cell Stem Cell. 1:113–126 10.1016/j.stem.2007.03.002 [DOI] [PMC free article] [PubMed] [Google Scholar]
- Schäfer M., Werner S. 2008. Oxidative stress in normal and impaired wound repair. Pharmacol. Res. 58:165–171 10.1016/j.phrs.2008.06.004 [DOI] [PubMed] [Google Scholar]
- Singer A.J., Clark R.A. 1999. Cutaneous wound healing. N. Engl. J. Med. 341:738–746 10.1056/NEJM199909023411006 [DOI] [PubMed] [Google Scholar]
- Stiewe T., Pützer B.M. 2000. Role of the p53-homologue p73 in E2F1-induced apoptosis. Nat. Genet. 26:464–469 10.1038/82617 [DOI] [PubMed] [Google Scholar]
- Textor S., Fiegler N., Arnold A., Porgador A., Hofmann T.G., Cerwenka A. 2011. Human NK cells are alerted to induction of p53 in cancer cells by upregulation of the NKG2D ligands ULBP1 and ULBP2. Cancer Res. 71:5998–6009 10.1158/0008-5472.CAN-10-3211 [DOI] [PubMed] [Google Scholar]
- Tokuyama M., Lorin C., Delebecque F., Jung H., Raulet D.H., Coscoy L. 2011. Expression of the RAE-1 family of stimulatory NK-cell ligands requires activation of the PI3K pathway during viral infection and transformation. PLoS Pathog. 7:e1002265 10.1371/journal.ppat.1002265 [DOI] [PMC free article] [PubMed] [Google Scholar]
- Unni A.M., Bondar T., Medzhitov R. 2008. Intrinsic sensor of oncogenic transformation induces a signal for innate immunosurveillance. Proc. Natl. Acad. Sci. USA. 105:1686–1691 10.1073/pnas.0701675105 [DOI] [PMC free article] [PubMed] [Google Scholar]
- Venkataraman G.M., Suciu D., Groh V., Boss J.M., Spies T. 2007. Promoter region architecture and transcriptional regulation of the genes for the MHC class I-related chain A and B ligands of NKG2D. J. Immunol. 178:961–969 [DOI] [PubMed] [Google Scholar]
- Whang M.I., Guerra N., Raulet D.H. 2009. Costimulation of dendritic epidermal gammadelta T cells by a new NKG2D ligand expressed specifically in the skin. J. Immunol. 182:4557–4564 10.4049/jimmunol.0802439 [DOI] [PMC free article] [PubMed] [Google Scholar]
- Wu L., Timmers C., Maiti B., Saavedra H.I., Sang L., Chong G.T., Nuckolls F., Giangrande P., Wright F.A., Field S.J., et al. 2001. The E2F1-3 transcription factors are essential for cellular proliferation. Nature. 414:457–462 10.1038/35106593 [DOI] [PubMed] [Google Scholar]
- Zou Z., Nomura M., Takihara Y., Yasunaga T., Shimada K. 1996. Isolation and characterization of retinoic acid-inducible cDNA clones in F9 cells: a novel cDNA family encodes cell surface proteins sharing partial homology with MHC class I molecules. J. Biochem. 119:319–328 10.1093/oxfordjournals.jbchem.a021242 [DOI] [PubMed] [Google Scholar]