

Abstract
We propose an automated method to segment cortical necrosis from brain FLAIR-MR Images. Cortical necrosis are regions of dead brain tissue in the cortex caused by cerebrovascular disease (CVD). The accurate segmentation of these regions is difficult as their intensity patterns are similar to the adjoining cerebrospinal fluid (CSF). We generate a model of normal variation using MR scans of healthy controls. The model is based on the Jacobians of warps obtained by registering scans of normal subjects to a common coordinate system. For each patient scan a Jacobian is obtained by warping it to the same coordinate system. Large deviations between the model and subject-specific Jacobians are flagged as `abnormalities'. Abnormalities are segmented as cortical necrosis if they are in the cortex and have the intensity profile of CSF. We evaluate our method by using a set of 72 healthy subjects to model cortical variation.We use this model to successfully detect and segment cortical necrosis in a set of 37 patients with CVD. A comparison of the results with segmentations from two independent human experts shows that the overlap between our approach and either of the human experts is in the range of the overlap between the two human experts themselves.
Index Terms: cortical necrosis segmentation, brain MRI, wavelets, jacobian
1. INTRODUCTION
The World Health Report of 2003 estimates that CVD results in 16.7 million global deaths per year. The disease often causes premature death of brain tissue (necrosis), which is classified based on its location as either subcortical necrosis or cortical necrosis. Many clinical studies investigating CVD rely on manual segmentation of the necrosis obtained from FLAIR-MRI (Fluid attenuation inversion recovery Magnetic resonance imaging) [1]. On FLAIR, subcortical necrosis are clearly visible as they are surrounded by living tissue. However accurately outlining cortical necrosis is generally very difficult as the intensity pattern of the pathology is similar to the adjacent CSF (See Figure 1). Due to these difficulties, studies frequently use human experts to generate the segmentations. These segmentations generally suffer from large inter- and intra-subject variability. Further manual analysis is time consuming and costly. In this paper we propose a fully automatic segmentation method for this task.
Fig. 1.
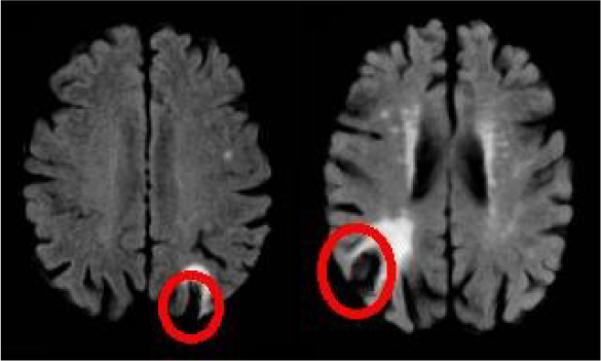
Typical cortical necrosis as seen on FLAIR MRI.
A short survey of related literature is given below. In [2] an intensity-based segmentation by fuzzy c-means algorithm is applied and tissue probability maps are created. These maps are compared with spatial tissue distribution maps obtained from an atlas, and the inconsistencies between two maps are segmented as necrosis. However the authors reported that the method was not successful in the cortical region, mainly due to the high anatomical variation of the cortex, which was not properly captured by the atlas. A promising approach using brain symmetry to detect necrosis is described in [3] but finding the axis of symmetry is not trivial. [4] suggests the use of Jacobian maps for detecting patholody. They register follow up scans to the base line scan of the subject in order to identify multiple sclerosis lesions.
Like [4], we use Jacobian maps to detect and segment cortical necrosis. Unlike [4] we use a set of Jacobian maps generated by non-rigidly aligning FLAIR images of healthy subjects to model the normal variation of the cortex. We use this `model' to then detect and delineate `abnormalities' from a subject scan. All `abnormalities' found in the cortex that fit the intensity profile of CSF are labeled as cortical necrosis. We evaluate our method by quantifying 1) how well it detects the presence of cortical necrosis in a large set of test images only some of which contain cortical necrosis 2) comparing the segmentation obtained using our method to the segmentation of cortical necrosis done by two human experts.
2. METHODS
As stated before we detect cortical necrosis as deviations from a normal cortex. To do this, we aim to encode the normal variation of the cortex using a database containing normal subjects only. This is challenging because the inter-subject variability of the cortex is very high. The method we propose to deal with cortical variability and segment cortical necrosis is comprised of three steps: 1) Generation of Jacobian deformation maps by registering MR scans of healthy controls to a common template; 2) Extraction of abnormal cortical regions using the Jacobian deformation maps; 3) Accurate delineation of cortical necrosis by using additional information from original FLAIR-MR scans. Each of these steps are described in more detail below.
2.1. Generation of Jacobian deformation maps
Jacobian deformation maps capture the rate of change of volume at every voxel that occurs when a subject scan is registered non-linearly to a template scan. If a subject scan contains a cortical necrosis, then the non-linear registration attempts to register this necrosis to a normal sulcus in the template scan. This results in an extremely large change in volume in the regions close to such cortical necrosis. Thus, the values of the Jacobian determinants are high in these regions.
For generating the database of normal Jacobian deformation maps we register our database of preprocessed normal FLAIR-MR scans to a normal template using the elastic registration method described in [5]. Henceforth we denote the Jacobians generated by this registration process as where i indexes the normal subjects in our database. The preprocessing done before the registration involves skullstrip-ping with BET [6], bias correction with N3 [7] and 12-dof linear registration to template using FLIRT [8]. For a given subject scan in which we wish to detect and segment cortical necrosis, we repeat the preprocessing and the non-linear registration in a similar manner. We denote the Jacobian determinant obtained from the subject scan as 𝒥t. It is important to note that both and 𝒥t are in the template space.
2.2. Extraction of abnormal cortical regions using the Jacobian deformation maps
We now use and 𝒥t to pinpoint cortical abnormalities. If the high values of Jacobian determinants generated above were caused exclusively by the presence of cortical necrosis, our problem would be solved at this stage. In practice this does not happen. The extreme variation of sulcal anatomy results in the presence of subject specific false positive spikes in the value of the Jacobian determinant at several cortical locations. We deal with these false positives using the framework described in the following section. The motivating idea is that if we have a large enough set of normal subjects, such false positives will occur in one or a few of our normal subjects. This information can then be used to eliminate such false positives whenever they occur in subject scans. In broad terms we want to detect cortical abnormalities from 𝒥t while modeling cortical variation using .
However for reasons of computational efficiency we do not use the original Jacobian maps directly. Instead we use a compressed representation of these maps. The compression is done using wavelets. We provide next a brief description of wavelet based compression followed by the description of the method used to model cortical variation using the wavelet representations.
2.2.1. Feature extraction using wavelet compression
A detailed exposition of wavelet based compression techniques is available in [9, 10]. For the purposes of this paper it suffices to understand that any Jacobian image 𝒥 may be represented as a linear combination of several predefined `basis images':
| (1) |
where ak are wavelet coefficients sorted in descending order, ψk are the corresponding wavelet basis images (functions), and q is the dimensionality of 𝒥 (the number of voxels in the image). In practice a large proportion of the ordered set are very close to zero. This allows us to choose the largest p of them and write
| (2) |
where is the residual. Since p ≪ q, a few thousand wavelet coefficients can represent an image containing more than a million voxels. For our experiments we have q ≈ 5:6 × 10⁶ and we use p = 10000. We generate compressed wavelet representation for the Jacobian map(𝒥t) corresponding to the subject scan:
| (3) |
The feature vector
| (4) |
represents the subject after wavelet compression. Note that the basis are selected based on the subject data only. The exact same basis are then used to generate a compressed representation of each normal Jacobian map :
| (5) |
Each row of the matrix A is a set of wavelet coefficients that represent one scan from the database of MR scans of healthy controls. Centered feature vectors are finally calculated as:
| (6) |
where is the mean of the rows of A. For the rest of this paper we denote the i-th row of the matrix C as ci.
2.2.2. Abnormality detection
Our abnormality detection algorithm is based on the assumption that the feature vector extracted from a subject scan that does not contain any cortical abnormality can be expressed as a convex combination of the rows of C. We denote the collection of the vectors formed by the rows of C as . We seek,the point closest to s that is inside the convex hull of . A point inside the convex hull parametrized by α is given by:
| (7) |
We solve:
| (8) |
and compute c(α*) using (7). To obtain 𝒥t*, the Jacobian deformation map corresponding to c(α*), we first compute a*
| (9) |
and then plug the components of a* into (3) to get:
| (10) |
We define the abnormality map corresponding to the subject as:
| (11) |
Note that contains cortical as well as subcortical abnormalities. Since in this paper we focus on cortical abnormalities, we mask out the subcortical regions of using a precomputed binary mask based on the template.
is now mapped back to the subject space to get using a precomputed deformation field. , the Jacobian abnormality map in the subject space is used for detecting and segmenting necrosis. An example of is shown in Figure 2.
Fig. 2.
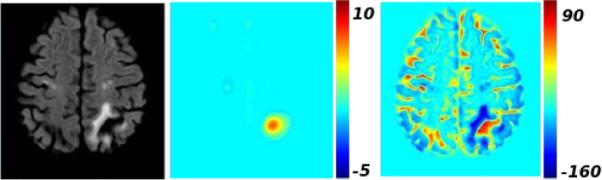
From left to right, the original FLAIR-MR scan, the Jacobian abnormality map , the intensity-based abnormality map .
2.3. Detection of cortical necrosis
In the detection task, the goal is to detect scans that contain cortical necrosis, in a given set of subject scans. We do this by defining a cortical abnormality score based on the Jacobian abnormality maps:
| (12) |
where Ω is the image domain, I(x) is the indicator function and the value of at location x ∈ Ω. θ is an abnormality threshold. We consider that values higher than the threshold θ may indicate necrosis. If ξ ≥ ξ0 then the method flags the subject as containing a cortical necrosis. In large studies the thresholds θ and ξ0 can be determined from a small subset of the data for which ground truth is known.
2.4. Segmentation of cortical necrosis
The Jacobian abnormality maps give us a coarse delineation of necrosis (Figure 2). In general, they pick up large regions around the cortical necrosis of interest. For the segmentation task, we combine the Jacobian abnormality map with an intensity-based abnormality map, denoted by 𝒟t. 𝒟t is obtained by the voxelwise subtraction of the mean of the FLAIR-MR scans of healthy controls from the subject scan. Prior to subtraction, a linear histogram matching is performed between each scan and the template. Since the necrosis intensity profile is similar to that of CSF, the intensity difference has a high positive value in the region of the necrosis (Figure 2). The necrosis segmentation is obtained by thresholding the voxelwise multiplication of and 𝒟t:
| (13) |
using a threshold τ that can be learned from a manually segmented training dataset.
As a post-processing step, the regions that are segmented as necrosis, and that have a volume less than 27 cubic milimeters have been removed, as this is consistent with the clinical practice of necrosis detection.
3. RESULTS
A dataset of 72 FLAIR MRIs belonging to healthy subjects is used for modeling the normal variation of the cortex. We applied the proposed method on a dataset of 37 FLAIR images belonging to subjects with CVD. We compared the results of our method to the segmentations performed by two human experts. Both experts detected cortical necrosis on the same 4 subjects, and created manual necrosis masks for these subjects.
3.1. Detection
As a first task, we applied our method for classifying subjects into two classes according to whether they have cortical necrosis or not. A Leave-One-Out (LOO) cross validation strategy is applied in order to detect the optimal parameter values θ and ξ0 defined in Section 2.3 automatically from the data. For each LOO iteration, one subject is selected as the test image, and the remaining 36 scans and their labels are used as the training set. The abnormality score (ξ) of each training subject is calculated for a set of values of θ. The ξ0 value that give the highest rate of correct classification is detected for each θ value. The {θ, ξ0} pair that obtains the highest classification accuracy is selected. The left-out subject is classified according to the selected {θ, ξ0} values.
We obtained a classification accuracy of 97.3 %. All 4 subjects with cortical necrosis were classified correctly, while only 1 subject without cortical necrosis was classified as having cortical necrosis.
3.2. Segmentation
The segmentation method described in Section 2.4 is applied on the 4 scans for which manual necrosis masks were provided. The automated segmentation (MA) is compared to both manual masks (ME1, ME2). Inter-rater variability is also measured by comparing ME1 with ME2. The overlap between a pair of masks is measured by calculating the Dice score.
An LOO strategy is applied to determine the value of the parameter τ. At each iteration, the scans of the remaining three subjects are used for training purposes. Dice scores between the pairs {MA, ME1}, and {MA, ME2} are calculated for these scans, for each setting of τ. The value of τ that maximizes the average Dice score is used for segmenting the left-out subject.
Figure 3 presents the Dice scores obtained for the 4 target scans. The resulting Dice scores show that the variation between our approach and either of the human experts is in the same range as variation between the human experts themselves. We observed that, on difficult subjects, for which the segmentation by the two experts do not agree, the automated method also had a low Dice score. Figure 4 shows the principal regions with cortical necrosis on each target scan, and the corresponding automated and manual segmentations. From Figure 3 and Figure 4 we see that the automated segmentations are comparable to the human expert generated segmen tations.
Fig. 3.

Dice coefficients between human experts {ME1 vs. ME2}, and between automated method and experts {MA vs ME1} and {MA vs ME2}.
Fig. 4.
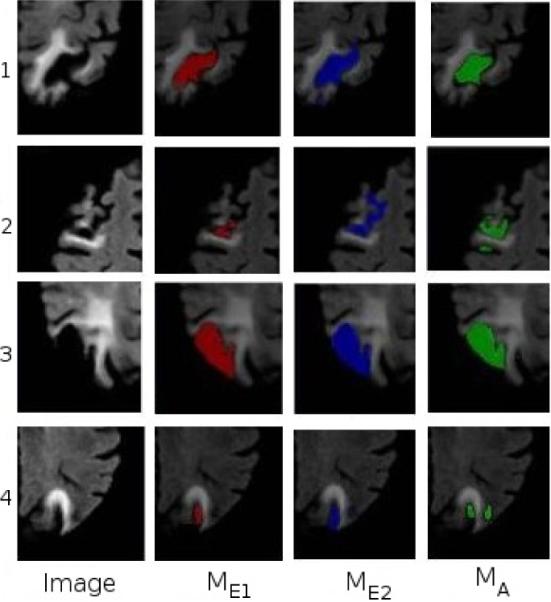
From left to right: Cortical necrosis on 4 subject scans, segmentation by the human experts, and by the automated method.
4. CONCLUSION
Segmentation of cortical necrosis is a difficult problem. The inter-rater agreement between human experts may be quite low for the segmentation of cortical necrosis. Hence developing automated methods to perform this task is very challenging. The method proposed here uses the Jacobian determinants to encode the spatial abnormality information and attempts to detect and segment cortical necrosis by using a model of `normality' derived using a database of healthy brain scans. We obtained a high detection rate, and a segmentation that is comparable to the manual masks created by experts.
5 REFERENCES
- [1].Barkhof F. Guidelines for brain imaging in vascular dementia clinical trials. Int Psychogeriatry. 2003;15:273–6. doi: 10.1017/S1041610203009323. [DOI] [PubMed] [Google Scholar]
- [2].Shen Shan, J. Szameitat Andre, Sterr Annette. An improved lesion detection approach based on similarity measurement between fuzzy intensity segmentation and spatial probability maps. Magnetic Resonance Imaging. 2010;28(no. 2):245–254. doi: 10.1016/j.mri.2009.06.007. [DOI] [PubMed] [Google Scholar]
- [3].Saito H, Katsuragawa S, Hirai T, Kakeda S, Kourogi Y. A computerized method for detection of acute cerebral infarction on ct images. Nippon Hoshasen Gijutsu Gakkai Zasshi. 2010;66(no. 9):1169–1177. doi: 10.6009/jjrt.66.1169. [DOI] [PubMed] [Google Scholar]
- [4].Rey David, Subsol Gérard, Delingette Hervé, Ayache Nicholas. Automatic detection and segmentation of evolving processes in 3d medical images: Application to multiple sclerosis. Medical Image Analysis. 2002;6(no. 2):163–179. doi: 10.1016/s1361-8415(02)00056-7. [DOI] [PubMed] [Google Scholar]
- [5].Andersson J, Smith S, Jenkinson M. Fnirt - fmrib's non-linear image registration tool. Human Brain Mapping. 2008 [Google Scholar]
- [6].Smith SM. Fast robust automated brain extraction. Human Brain Mapping. 2002;17:143–155. doi: 10.1002/hbm.10062. [DOI] [PMC free article] [PubMed] [Google Scholar]
- [7].Evans A, Sled J, Zijdenbos A. A nonparametric method for automatic correction of intensity nonuniformity in mri data. IEEE Trans Med Imaging. 1998;17:87–97. doi: 10.1109/42.668698. [DOI] [PubMed] [Google Scholar]
- [8].Smith SM, Jenkinson M, Woolrich MW. Advances in functional and structural mr image analysis and implementation as fsl. Neuro-Image. 2004;23:208–219. doi: 10.1016/j.neuroimage.2004.07.051. [DOI] [PubMed] [Google Scholar]
- [9].Mallat Stphane. A Wavelet Tour of Signal Processing, Third Edition: The Sparse Way. 3rd edition Academic Press; 2008. [Google Scholar]
- [10].L. Donoho David. De-noising by soft-thresholding. IEEE Transactions on Information Theory. 1995;41(no. 3):613–627. [Google Scholar]