Abstract
Glyconanomaterials have shown high potential in applications including bioanalysis and nanomedicine. Here, a quantitative analytical technique, based on isothermal titration calorimetry, was developed to characterize the interactions between glyconanoparticles and lectins. By titrating lectins into the glyconanoparticle solution, the apparent dissociation constant, thermodynamic parameters, and the number of binding sites were derived simultaneously. For the glyconanoparticles-lectin binding pairs investigated, a 3–5 orders of magnitude affinity enhancement over the free ligand-lectin interactions was observed which can be attributed to the multivalent ligand presentation on the nanoparticles. The impact of ligand density was also studied, and results showed that the affinity increased with the number of glycans on the nanoparticle.
Carbohydrates as a class of biomolecules play significant roles in important biological processes including cell communication, DNA hybridization, viral infection and inflammation.1–3 Glyconanomaterials, nanomaterials conjugated with carbohydrate ligands, have recently emerged as efficient multivalent scaffolds that provide significantly enhanced affinity to the carbohydrate-binding proteins.4 Despite their high potential for biomedical applications, methods for the quantitative analysis of glyconanomaterial binding affinities are still lacking. Common approaches to affinity determination rely on changes in the physical properties of the nanomaterials upon lectin binding to compute the affinity constants. Examples include localized surface plasmon resonance (SPR) of metal nanoparticles, and quartz crystal microbalance (QCM) measurements of the mass changes upon glyconanoparticle binding.5–7 We recently developed methodologies to measure the affinity between glyconanomaterials and lectins, including a competition assay that uses fluorescently-labeled lectins in solution,8,9 lectin microarrays,10 and dynamic light scattering (DLS)11 measurements of changes in particle size.
Here we describe the direct measurement of the interactions of glyconanoparticles with lectins by ITC. ITC is a sensitive and quantitative analytical technique that relies on the detection of heat absorbed or released upon the interactions between, for example, ligands and biomacromolecules in solutions.12 It involves a series of titrations in which one reactant is added in aliquots into the cell containing the other reactant, and detection of the released/absorbed change in heat in the reaction. From the resulting binding isotherm, thermodynamic parameters (ΔH), the dissociation constant (Kd), and the number of binding sites (n) can be derived. Current commercial ITC instruments are capable of measuring a wide range of interactions with Kd values ranging from millimolar to nanomolar. The apparent dissociation constants of GNP-lectin interactions are mostly in the nanomolar range,5,6,8,11 and therefore, ITC should be a suitable method for measuring GNP-lectin interactions.
MATERIALS AND METHODS
Materials
Hydrogen tetrachloroaurate (III) hydrate (HAuCl4·XH2O, 99.9%-Au) was purchased from Strem Chemicals (Newburyport, MA). Sodium citrate was obtained from Mallinckrodt. d-(+)-Mannose (Man), d-(+)-galactose (Gal) and Tween 20 was obtained from TCI America. Con A (Concanavalin A), PNA (Peanut Agglutinin), 2-O-α-d-mannopyranosyl-d-mannopyranose (Man2), anthrone (97%), and bovine serum albumin (BSA) were purchased from Sigma-Aldrich. All water was treated via a Milli-Q ultrapure water purification system. Dialysis tubing (G-Biosciences Tube-O-dialyzer, 15K, medium) was purchased from VWR International. All ITC experiments were carried out in HEPES buffer (10 mM, pH 7.6) containing 90 mM NaCl, 1 mM CaCl2 and 1 mM MnCl2.
Preparation of glyconanoparticles (GNPs)
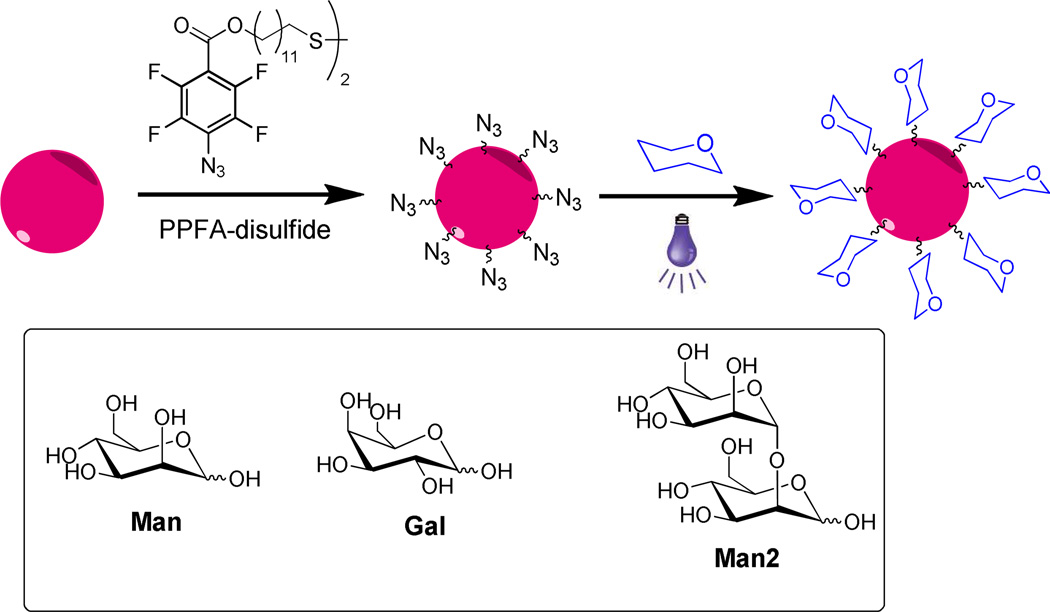
Gold nanoparticles (Au NPs), 22 nm in diameter, were prepared and functionalized with PFPA-disulfide following the same procedure as described in a previous paper (Scheme 1).8 The subsequent carbohydrate coupling was carried out photochemically as reported previously.13 Briefly, a solution of PFPA-functionalized Au NPs in acetone (10 nM) mixed with an aqueous solution of carbohydrate (10 mM) was irradiated for 12 min with a 450-W medium pressure Hg lamp (Hanovia) with a 280-nm long-path optical filter. The resulting GNPs were then dialyzed overnight to remove excess carbohydrate. Before the binding experiments, the GNPs were incubated in HEPES buffer containing 0.01% Tween 20 and 3% BSA for 1 hour, centrifuged, and placed in the buffer without BSA until further use.
Scheme 1.
Synthesis of GNPs.
Protein cloning, expression, and purification of CVNmDB
Protein was expressed from a synthetic gene using pET26b(+) (Novagen; Madison, WI) and Escherichia coli BL21(DE3) as expression vector and host strain, respectively. Cells were grown at 37 °C and induced with 1 mM isopropyl 1-thio-β-d-galactopyranoside for 3 h. Isotopic labeling was carried out by growing the culture in modified M9 minimal medium containing [15N]H4Cl as sole nitrogen source. The expressed protein was isolated from the periplasmic fraction of the E. coli cells by twice heating (62 °C) and cooling (0 °C) the cell suspension in phosphate buffered saline (pH 7.4). After removal of insoluble material by centrifugation, the supernatant, containing soluble protein, was fractionated by gel filtration on Superdex 75 (HiLoad2.6 × 60 cm, Amersham Biosciences), equilibrated in 20 mM sodium phosphate buffer (pH 6.0). The protein was isolated as monomers. The purity and identity of the protein was assessed and verified by mass spectrometry and the structural integrity of the proteins was ascertained by recording a 1H-15N HSQC spectrum.
Isothermal Titration Calorimetry (ITC)
ITC experiments were performed using an ITC200 Microcalorimeter from MicroCal, LLC. (Northampton, MA) in HEPES buffer. The concentration of lectin was 10 µM, and that of GNP was 2.5 µM. In each individual experiment, ~38 µL of lectin was injected through the computer-controlled 40-µL micro-syringe at an interval of 4 min into the nanoparticle solution in the same buffer (cell volume = 200 µL) while stirring at 1000 rpm. The experimental data were fitted to a theoretical titration curve using the software supplied by MicroCal. A standard one-site model was used with ΔH (enthalpy change, in kcal/mol), Ka (association constant, in M−1), and n (number of binding sites) as the variables.
RESULTS AND DISCUSSION
GNPs were synthesized by coupling carbohydrates to Au NPs using the perfluorophenyl azide (PFPA) photocoupling chemistry developed in our laboratory.4,13–15 Au NPs of 22 nm in diameter were synthesized and functionalized with PFPA (Scheme 1). Man, Gal, and Man2 were then conjugated to the PFPA-functionalized Au NPs by a light activation (Scheme 1).4,13 The density of the attached carbohydrates were determined colorimetrically, using the anthrone-sulfuric acid assay (Table 1).13 Binding studies were carried out using the plant lectin Con A, a well-studied tetrameric protein with specificity towards α-mannosyl groups.16,17 In the ITC experiments, the lectin solution was loaded into the syringe and titrated into the GNP solution in the calorimeter cell. Upon binding between the GNPs and the lectin, such as Man-conjugated GNP (GNP-Man) and Con A, heat is released. The amount of generated heat decreases with each subsequent injection as the GNPs in the cell become saturated with bound lectin. In contrast, if no binding occurs, the released heat, caused simply by reagent mixing, is much smaller and remains essentially constant with each injection.
Table 1.
The number of carbohydrate ligand per nanoparticle (ligand density), apparent dissociation constant (KD), and thermodynamic parameters of GNP-lectin interactions at 25 °C.
| GNP | Ligand density |
Lectin | KD (nM) |
Kd (µM) | βa | −ΔG b (kJ mol−1) |
ΔH (×104 kJ mol−1) |
TΔS (×104 kJ mol−1) |
n | Nb | |
|---|---|---|---|---|---|---|---|---|---|---|---|
| GNP-Man | 3600 | Con A | 122 | 47030 | 3.6 | 39.4 | −10.8 | −10.8 | 0.00327 | 306 | |
| PNA | not detectable | ||||||||||
| GNP-Gal | 3500 | Con A | not detectable | ||||||||
| GNP- Man2 |
I | 1400 | Con A | 34.8 | 2420 | 2.8 | 42.6 | −4.64 | −4.63 | 0.00478 | 209 |
| II | 260 | 82.6 | 2.5 | 40.4 | −2.84 | −2.83 | 0.0101 | 99 | |||
| III | 110 | 175 | 2.1 | 38.6 | −3.06 | −3.05 | 0.0121 | 83 | |||
| GNP- Man2I |
1400 | CV-N | 17.2 | 75728 | 4.6 | 44.3 | −0.67 | −0.66 | 0.00625 | 160 | |
enhancement factor: β= log(Kd/KD)
ΔG was calculated (=ΔH-TΔS).
number of GNP binding sites: N = 1/n (n: number of lectin binding sites)
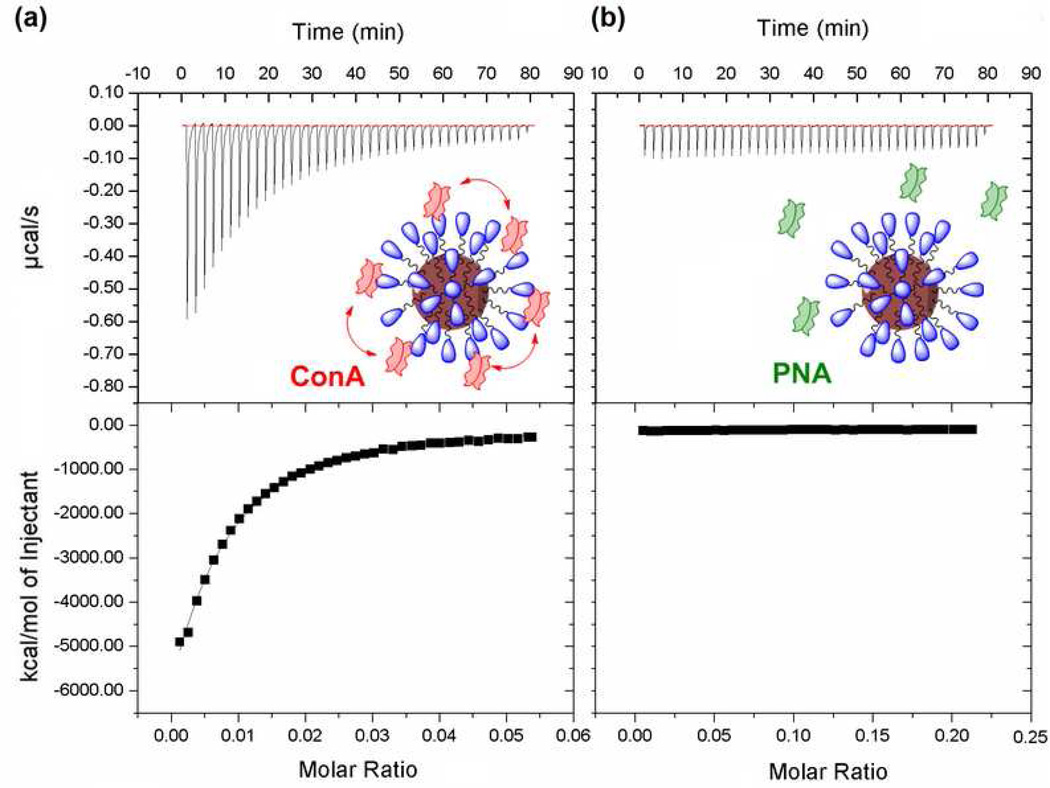
Figure 1a is a typical ITC titration experiment of GNP-Man with Con A at pH 7.6 in HEPES buffer, containing 1 mM Mn2+ and 1 mM Ca2+. As expected, the heat generated at each injection of the lectin solution aliquot decreased gradually with each additional injection, yielding a typical titration isotherm. As a control, ITC experiments were performed in identical fashion with buffer only and the heat released was used to correct each lectin-GNP titration experiment. Figure 1a shows the titration data (solid squares) and the theoretical fit (line), demonstrating excellent agreement. The extracted binding parameters, such as the dissociation constant (KD), the enthalpy change (ΔH), the entropy change (ΔS), and the number of lectin binding sites (n) are summarized in Table 1. The enhancement factor β, defined as log(Kd/KD), where Kd is the dissociation constant for the interaction with the monovalent ligand, can be used to evaluate the multivalency effect when nanoparticles are used as scaffolds.18,19 Compared to α-d-mannopyranose binding to Con A (Kd = 470 µM),20 the KD value of GNP-Man and Con A (KD = 122 nM) was approximately four orders of magnitude smaller, indicating the apparent tighter affinity. The number of GNP binding sites, N (306), representing the number of functional valences on the nanoparticle that are available for binding with the lectin, is clearly smaller than the number of carbohydrate ligands that were immobilized on the particle surface (3600). Thus, only a subset of the available ligands on the GNP participated in lectin binding. Similar results have also been observed by Kiessling and coworkers in the binding of Con A to multivalent Man on polymers,21 and Brewer et al. in the binding of soybean agglutinin (SBA) to multivalent GalNAc on mucin.22 This is not surprising, since the distance between the four sugar binding sites on Con A is ~6.5 nm,23 clearly larger than the distance between the Man ligands on the GNP surface (2~3 nm).8 The negative enthalpy change reveals that the GNP- lectin interaction is an exothermic process (ΔH < 0) with an unfavorable entropy change (ΔS < 0), yielding an overall negative Gibbs free energy (ΔG). In the control experiment where PNA was titrated into the GNP-Man solution, the released heat was small and remained unchanged throughout the titration (top, Figure 1b) and yielded a flat titration curve (bottom, Figure 1b). Similar results were also obtained when Con A was titrated into the GNP-Gal solution since galactose is not a ligand for Con A (Figure 2S, Supporting Information). Therefore, only cognate interactions such as the one between Con A and GNP-Man2 resulted in a measurable signal by ITC and no binding between Con A and GNP-Gal could be detected.
Figure 1.
ITC graphs of GNP-Man titrating with (a) Con A and (b) PNA. The experimental data (solid squares) were fit to theoretical titration curves (solid lines) using the software supplied by the ITC manufacturer.
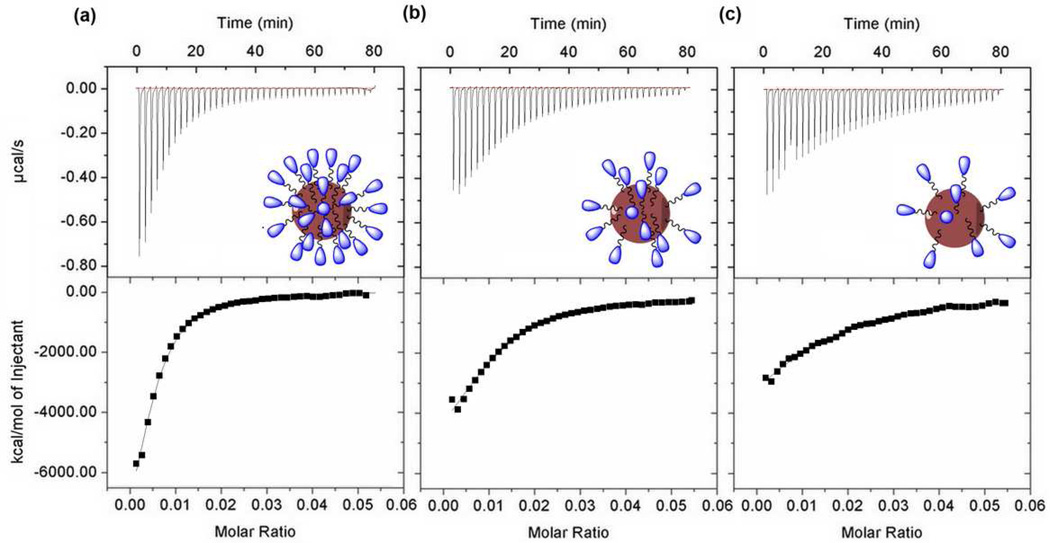
In order to evaluate the effect of ligand density on lectin binding, ITC experiments were carried for varying ligand densities ranging from 1400 (GNP-Man2I, Figure 2a), via 260 (GNP-Man2II, Figure 2b) to 110 (GNP-Man2III, Figure 2c). Samples of the GNP with different sugar loadings were prepared according to a previously developed procedure that involves diluting the photocoupling agent PFPA on the nanoparticles before Man2 immobilization.8 Our data reveal that the apparent dissociation constant (KD) depends on the number of Man2 ligands on the GNPs (Table 1). GNP-Man2I, containing the highest ligand density, exhibited the largest N value and the tightest apparent affinity. It should be noted, however, that although the ligand density of GNP-Man2I is 5 times and 13 times higher than that of GNP-Man2II and GNP-Man2III, respectively, the apparent binding affinity was only 2 and 5 times larger. This may be attributed to the fact that not all ligands on the GNP-Man2 participate in lectin binding.8 For GNP-M2III the slightly more favorable ΔG value is probably due to the reduced steric interference at lower ligand density.
Figure 2.
ITC titration graphs of Con A with (a) GNP-Man2I, (b) GNP-Man2II, and (c) GNP-Man2III. Solid squares: experimental data, lines: fitted titration curves.
The above approach was further tested with a cyanobacterial lectin, cyanovirin-N (CV-N)24–27 that contains two binding sites for the Man2 epitope on high-mannose glycans. MutDB, a variant of CV-N with only one binding site,28 was employed here. The ITC titration curves (Figure 3S, Supporting Information) show a 4.6 orders of magnitude affinity enhancement (β) of GNP-Man2 over free Man2 interacting with CV-N (Table 1), similar to the results obtained previously using a fluorescence competition assay.29
CONCLUSIONS
In conclusion, we present an ITC-based method for quantitatively analyzing the binding affinity of glyconanoparticles with lectins. Titrating lectins into the GNP solution one can derive simultaneously the apparent dissociation constant, thermodynamic parameters, and the number of binding sites. For the cases investigated here, a 3–5 orders of magnitude affinity enhancement over the free ligand interaction is observed which can be attributed to the multivalent ligand presentation on the nanoparticles. The current results are consistent with those obtained previously using other analytical techniques, such as fluorescence competition assays, dynamic light scattering, and microarrays. However, it should be stressed that in contrast to these other methods that either require a label, or rely on indirect information, ITC permits the direct measurement of the affinity constant, thermodynamic parameters and stoichiometry for the interactions. The approach presented here provides a general and highly sensitive means for studying interactions between nanomaterials and biological molecules. Our results further confirm previous findings by us8,11 and others31–33 that multivalent interactions are highly dependent on ligand densities on the multivalent scaffold.
Supplementary Material
ACKNOWLEDGMENTS
This work was supported by National Institutes of Health grants R01GM080295 and 2R15GM066279 (to M.Y.) and R01GM080642 (to A.M.G.).
Footnotes
Supporting Information Available: Nanoparticle characterization, ITC graphs of binding for GNP-Gal with Con A, and GNP-M2 with CVN lectin. This material is available free of charge via the Internet at http://pubs.acs.org.
REFERENCES
- 1.Lee YC, Lee RT. Acc. Chem. Res. 1995;28:321–327. [Google Scholar]
- 2.Cipolla L, Peri F, Airoldi C. Anti-Cancer Agents Med. Chem. 2008;8:92–121. doi: 10.2174/187152008783330815. [DOI] [PubMed] [Google Scholar]
- 3.Niemeyer CM, Mirkin CA. Nanobiotechnology. Wiley-VCH Weinheim; 2004. [Google Scholar]
- 4.Wang X, Liu LH, Ramstrom O, Yan M. Exp. Biol. Med. 2009;234:1128–1139. doi: 10.3181/0904-MR-134. [DOI] [PMC free article] [PubMed] [Google Scholar]
- 5.Lin CC, Yeh YC, Yang CY, Chen GF, Chen YC, Wu YC, Chen CC. Chem. Commun. 2003;23:2920–2921. doi: 10.1039/b308995a. [DOI] [PubMed] [Google Scholar]
- 6.Mahon E, Aastrup T, Barboiu M. Chem. Commun. 2010;46:5491–5493. doi: 10.1039/c002652b. [DOI] [PubMed] [Google Scholar]
- 7.Chuang YJ, Zhou X, Pan Z, Turchi C. Biochem. Biophys. Res. Commun. 2009;389:22–27. doi: 10.1016/j.bbrc.2009.08.079. [DOI] [PMC free article] [PubMed] [Google Scholar]
- 8.Wang X, Ramström O, Yan M. Anal. Chem. 2010;82:9082–9089. doi: 10.1021/ac102114z. [DOI] [PMC free article] [PubMed] [Google Scholar]
- 9.Wang X, Ramström O, Yan M. Adv. Mater. 2010;22:1946–1953. doi: 10.1002/adma.200903908. [DOI] [PMC free article] [PubMed] [Google Scholar]
- 10.Wang X, Ramstrom O, Yan M. submitted. [Google Scholar]
- 11.Wang X, Ramstrom O, Yan M. Analyst. 2011;136:4174–4178. doi: 10.1039/c1an15469a. [DOI] [PMC free article] [PubMed] [Google Scholar]
- 12.Jelesarov I, Bosshard HR. J. Mol. Recognit. 1999;12:3–18. doi: 10.1002/(SICI)1099-1352(199901/02)12:1<3::AID-JMR441>3.0.CO;2-6. [DOI] [PubMed] [Google Scholar]
- 13.Wang X, Ramström O, Yan M. J. Mater. Chem. 2009;19:8944–8949. doi: 10.1039/B917900C. [DOI] [PMC free article] [PubMed] [Google Scholar]
- 14.Liu LH, Dietsch H, Schurtenberger P, Yan M. Bioconjugate Chem. 2009;20:1349–1355. doi: 10.1021/bc900110x. [DOI] [PMC free article] [PubMed] [Google Scholar]
- 15.Liu LH, Yan M. Acc. Chem. Res. 2010;43:1434–1443. doi: 10.1021/ar100066t. [DOI] [PMC free article] [PubMed] [Google Scholar]
- 16.De la Fuente JM, Penadés S. Biochim. Biophys. Acta, Gen. Subj. 2006;1760:636–651. doi: 10.1016/j.bbagen.2005.12.001. [DOI] [PubMed] [Google Scholar]
- 17.Lis H, Sharon N. Chem. Rev. 1998;98:637–674. doi: 10.1021/cr940413g. [DOI] [PubMed] [Google Scholar]
- 18.Mammen M, Choi SK, Whitesides GM. Angew. Chem. Int. Ed. 1998;37:2754–2794. doi: 10.1002/(SICI)1521-3773(19981102)37:20<2754::AID-ANIE2754>3.0.CO;2-3. [DOI] [PubMed] [Google Scholar]
- 19.Shenhar R, Rotello VM. Acc. Chem. Res. 2003;36:549–561. doi: 10.1021/ar020083j. [DOI] [PubMed] [Google Scholar]
- 20.Mandal DK, Kishore N, Brewer CF. Biochemistry. 1994;33:1149–1156. doi: 10.1021/bi00171a014. [DOI] [PubMed] [Google Scholar]
- 21.Gestwicki JE, Strong LE, Cairo CW, Boehm FJ, Kiessling LL. Chem. Biol. 2002;9:163–169. doi: 10.1016/s1074-5521(02)00102-3. [DOI] [PubMed] [Google Scholar]
- 22.Dam TK, Gerken TA, Cavada BS, Nascimento KS, Moura TR, Brewer CF. J. Biol. Chem. 2007;282:28256–28263. doi: 10.1074/jbc.M704677200. [DOI] [PubMed] [Google Scholar]
- 23.Bittiger H, Schnebli HP. Concanavalin A as a Tool. London: John Wiley and Sons; 1976. [Google Scholar]
- 24.Barrientos LG, Gronenborn AM. Mini-Rev. Med. Chem. 2005;5:21–31. doi: 10.2174/1389557053402783. [DOI] [PubMed] [Google Scholar]
- 25.Bewley CA, Otero-Quintero S. J. Am. Chem. Soc. 2001;123:3892–3902. doi: 10.1021/ja004040e. [DOI] [PubMed] [Google Scholar]
- 26.Bolmstedt AJ, O'Keefe BR, Shenoy SR, Mcmahon JB, Boyd MR. Mol. Pharmacol. 2001;59:949–954. doi: 10.1124/mol.59.5.949. [DOI] [PubMed] [Google Scholar]
- 27.Shenoy SR, Barrientos LG, Ratner DM, O'Keefe BR, Seeberger PH, Gronenborn AM, Boyd MR. Chem. Biol. 2002;9:1109–1118. doi: 10.1016/s1074-5521(02)00237-5. [DOI] [PubMed] [Google Scholar]
- 28.Matei E, Furey W, Gronenborn AM. Structure. 2008;16:1183–1194. doi: 10.1016/j.str.2008.05.011. [DOI] [PMC free article] [PubMed] [Google Scholar]
- 29.Wang X, Matei E, Deng LQ, Ramstrom O, Gronenborn AM, Yan M. Chem. Commun. 2011;47:8620–8622. doi: 10.1039/c1cc12981c. [DOI] [PMC free article] [PubMed] [Google Scholar]
- 30.Schwarz FP, Puri KD, Bhat RG, Surolia A. J. Biol. Chem. 1993;268:7668–7677. [PubMed] [Google Scholar]
- 31.Chien YY, Jan MD, Adak AK, Tzeng HC, Lin YP, Chen YJ, Wang KT, Chen CT, Chen CC, Lin CC. ChemBioChem. 2008;9:1100–1109. doi: 10.1002/cbic.200700590. [DOI] [PubMed] [Google Scholar]
- 32.Di Gianvincenzo P, Marradi M, Martínez-Ávila OM, Bedoya LM, Alcamí J, Penadés S. Bioorg. Med. Chem. Lett. 2010;20:2718–2721. doi: 10.1016/j.bmcl.2010.03.079. [DOI] [PubMed] [Google Scholar]
- 33.Fakhari A, Baoum A, Siahaan TJ, Le KB, Berkland C. J. Pharm. Sci. 2011;100:1045–1056. doi: 10.1002/jps.22342. [DOI] [PMC free article] [PubMed] [Google Scholar]
Associated Data
This section collects any data citations, data availability statements, or supplementary materials included in this article.


