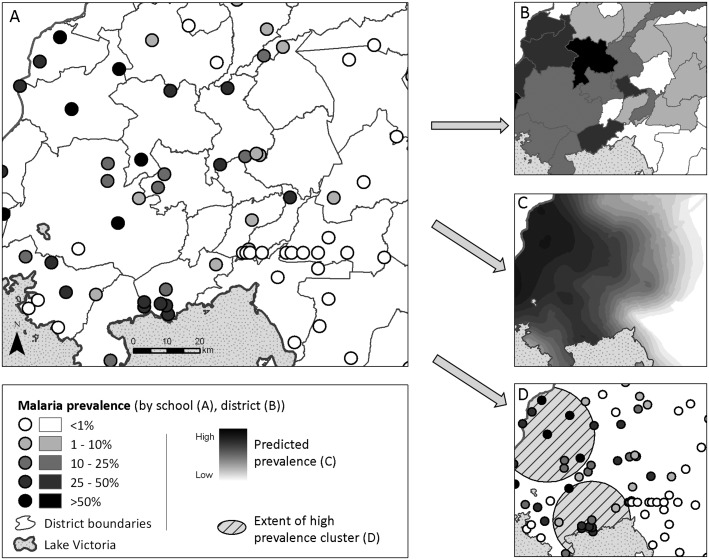
Fig. 1.
An illustrated application of the three major branches of spatial statistics, using one dataset. (A) Data used for analysis: Point-level (school-level) malaria prevalence data for Western Kenya, collected during the National School Malaria Survey, 2010 (Gitonga et al. 2010). (B) Discrete spatial analysis: data are aggregated to the area level (in this case, mean district prevalence) for presentation and analysis. Discrete spatial statistics can be used to smooth between units, or investigate associations with covariates. (C) Continuous spatial analysis: characterizes spatial dependency (or autocorrelation) between points, and can be used to interpolate predicted outcomes across the entire study region (in this case, using Ordinary Kriging (Goovaerts, 1997)). (D) Spatial point processes: used to investigate the location of individual spatial clusters (indicated as hatched circles) in the outcome (in this case, Kulldorf's spatial scan statistic (Kulldorff and Nagarwalla, 1995)).

