Abstract
The promoter-specific transcription factor Sp1 is expressed ubiquitously, and plays a primary role in the regulation of the expression of many genes. Domains A and B located in the N-terminal half of the protein are characterized by glutamine-rich (Q-rich) sequences. These Q-rich domains have been shown to be involved in the interaction between Sp1 and different classes of nuclear proteins, such as TATA-binding protein associated factors. Furthermore, the self-association of Sp1 via Q-rich domains is also important for the regulation of transcriptional activity. It has been considered that an Sp1 molecule bound to a “distal” GC-box synergistically interacts with another Sp1 molecule at a “proximal” binding site. Although the formation of multimers via Q-rich domains seems functionally important for Sp1, little is known about the structural and physicochemical nature of the interaction between Q-rich domains. We analyzed the structural details of isolated glutamine-rich B (QB) domains of Sp1 by circular dichroism (CD), analytical ultracentrifugation, and heteronuclear magnetic resonance spectroscopy (NMR). We found the isolated QB domains to be disordered under all conditions examined. Nevertheless, a detailed analysis of NMR spectra clearly indicated interaction between the domains. In particular, the C-terminal half was responsible for the self-association. Furthermore, analytical ultracentrifugation demonstrated weak but significant interaction between isolated QB domains. The self-association between QB domains would be responsible, at least in part, for the formation of multimers by full-length Sp1 molecules that has been proposed to occur during transcriptional activation.
Keywords: transcription factor, glutamine-rich domain, molecular interaction, intrinsically disordered protein, nuclear magnetic resonance
Introduction
The properly timed and coordinated expression of eukaryotic genes is regulated, in part, at the level of transcription initiation. The promoter-specific transcription factor Sp1 is expressed ubiquitously, and plays a primary role in the regulation of the expression of many genes.1 It consists of multiple functional domains, including a C-terminal DNA-binding domain with three C2H2-type zinc fingers, and two transcriptional activation domains, A and B, which are characterized by glutamine-rich sequences (Fig. 1).2–4 The glutamine-rich (Q-rich) domain is one of the representative transactivation motifs found in many transcription factors and has been implicated in protein–protein interactions.5–7 Q-rich domains have been shown to be involved in the interaction between Sp1 and different classes of nuclear proteins, such as TATA-binding protein associated factors (TAFs), which are components of the general transcription factor TFIID.8–12 The interaction between Sp1 and TAF4 via each Q-rich domain is considered to recruit RNA polymerase II to the transcription initiation site and activate transcription.
Figure 1.
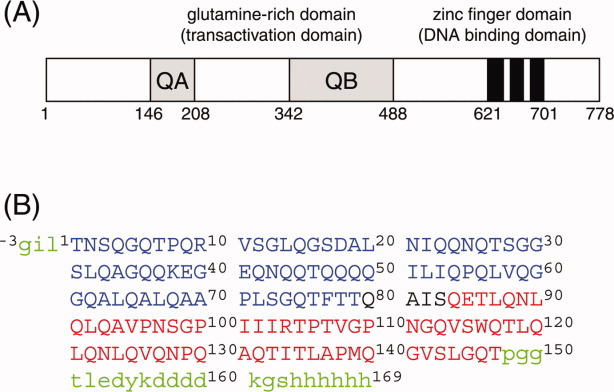
(A) Schematic representation of the transcription factor Sp1. Two glutamine-rich domains, QA and QB, and three zinc finger domains are indicated. (B) Amino acid sequence of the QB domain of Sp1 used in this study. Two fragment proteins, Bn (1T–S83, in blue) and Bc (80Q–T147, in red), were also used to facilitate the assignment. The proteins were expressed as a fusion protein with glutathione S-transferase (GST) at the N-terminus, which was cleaved during the purification. The residual linker amino acids at the N-terminus are indicated by small capitals in green. The proteins also contain anti-FLAG and hexahistidine tags at the C-terminal.
In addition to the interaction with other proteins, the self-association of Sp1 via Q-rich domains is also important for the regulation of transcriptional activity. The binding of Sp1 to the GC-rich DNA sequence element (GC-box) located immediately upstream of the transcriptional start site strongly induces the expression of the encoded protein. On the other hand, it has been shown that a GC-box located 1.7 kb downstream of the transcriptional start site could also act as a transcriptional enhancer.13 It has been considered that the Sp1 molecule which bound to the “distal” GC-box synergistically interacts with another Sp1 molecule at the “proximal” binding site. The formation of a multimeric form of Sp1 on the DNA molecule was also evidenced by scanning electron microscopy, in which a “loop” structure was formed by a plasmid DNA containing several Sp1-binding sites.14,15 Furthermore, the formation of a multimeric structure by itself seems functionally important. It was indicated that the promoter activity of the transcriptionally active form of Sp1 was enhanced dramatically by the addition of a DNA binding-deficient (fingerless) mutant. This synergetic effect is known as “superactivation,” and considered a result of the interaction between Sp1 molecules via the Q-rich domains.13,16
Although the multimers formed via Q-rich domains seem functionally important for Sp1, little is known about the structural and physicochemical mechanism of the interaction between Q-rich domains. Among two Q-rich domains in Sp1, we focused here on the glutamine-rich B (QB) domain because the truncated protein lacking QA domain is shown to possess a transcriptional activity.13 We analyzed the structural features of isolated QB domain of Sp1 by circular dichroism (CD), analytical ultracentrifugation, and heteronuclear NMR spectroscopy. The CD and NMR analyses demonstrated that the isolated QB domain was largely disordered. Nevertheless, a detailed analysis of the cross peak intensity of NMR spectra recorded at different protein concentrations clearly indicated interaction between QB domains. In particular, the C-terminal half of the domain was responsible for the self-association of QB domains. Furthermore, analytical ultracentrifugation demonstrated weak but significant self-association between the isolated QB domains. The self-association between QB domains would be responsible, at least in part, for the formation of multimers by full-length Sp1 molecules that has been proposed to occur during transcriptional activation. The results also propose a novel interaction mode of intrinsically disordered proteins that does not accompany with significant conformational change.
Results and Discussion
Secondary structural analysis by CD spectroscopy
We first measured far-UV CD spectra to examine the secondary structure of the isolated QB domain of Sp1 at pH 7.3 and 4°C (Fig. 2). The spectrum showed a minimum at 200 nm, indicating that the protein does not have a rigid, well-ordered secondary structure. However, close examination revealed a broad shoulder at around 230–220 nm, suggesting a partially and/or transiently folded structure to be present. To examine whether isolated QB domains interact with each other, we compared the spectra recorded at various concentrations of protein. By using an assembling cell with a light path of 0.1 mm, we could obtain far-UV CD spectra at a protein concentration as high as 300 μM, nearly corresponded to NMR measurements (see below). Although the protein concentration was varied from 50 to 300 μM, all the spectra were virtually identical. We also measured the spectra at lower protein concentrations from 5 to 25 μM using a standard cell with a light path of 1 mm, but found no significant change in the spectra (data not shown). In addition, a similar spectrum with a minimum at 200 nm was obtained at different temperatures (25 and 37°C), indicating that the protein was predominantly unfolded under all the conditions examined.
Figure 2.
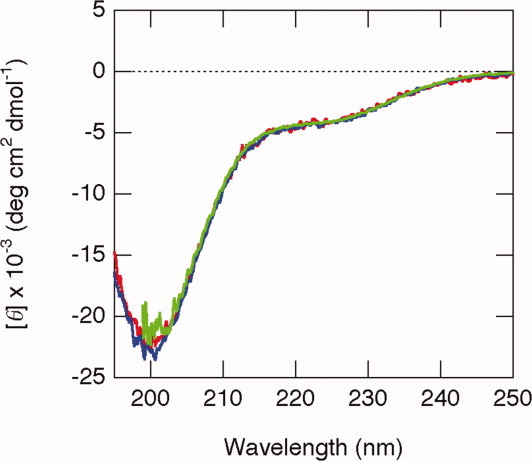
Far UV-CD spectra of QB domains measured at 4°C. Three traces recorded at different protein concentrations, 50 (red), 100 (blue), and 300 (black) μM, are overlaid.
Backbone resonance assignments for the QB domain of Sp1
The secondary and tertiary structures of the QB domain were analyzed by nuclear magnetic resonance (NMR) spectroscopy, which provides detailed information on the structure and dynamics of proteins at an atomic resolution. We first measured the 1H-15N spectra of the QB domain at different temperatures, and found that the signal intensity decreased dramatically at higher temperature (Supporting Information Fig. S1). This is not due to temperature-dependent conformational change as we obtained virtually the same CD spectra at different temperatures, but is partly due to rapid exchange with the solvent water at higher temperature. We therefore decided to perform all the NMR experiments at 4°C.
Figure 3 shows a 1H-15N HSQC spectrum of the QB domain recorded at 4°C with the resonance assignments indicated. The cross peaks in the spectrum dispersed poorly, and all the backbone 1HN resonances appeared within the range of 8.5–7.5 ppm. The results indicate that neither a well-defined secondary nor a rigid tertiary structure was formed under the conditions examined, consistent with the results of CD spectroscopy. To facilitate the signal assignment of the QB domain, we prepared two fragment proteins, Bn and Bc, which cover the N- and C-terminal part of the QB protein, respectively (Fig. 1). The overlay of two spectra obtained by Bn and Bc corresponded very well to that of QB protein (Supporting Information Fig. S2). This indicates almost no interaction between the N- and C-terminal halves of the QB molecule, consistent with the observations above that the QB protein does not have a well-ordered tertiary structure.
Figure 3.
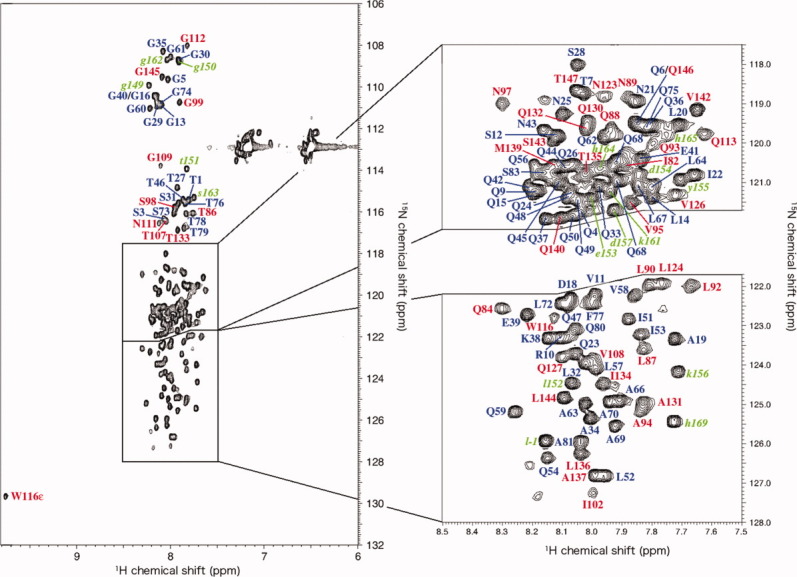
1H-15N HSQC spectra of QB domains measured 4°C. The assignments of signals are indicated by a single-letter code and residue number in the same colors as in Figure 1(B). A total of 129 residues among 138 nonproline residues (the N- and C-terminal extensions were not included) were unambiguously assigned.
Secondary chemical shift analysis
It is known that the chemical shift value of 13Cα depends closely on the secondary structure adopted by the residue.17 Secondary chemical shift, the deviation of the observed value from that expected for random coils, was plotted against residue number (Supporting Information Fig. S3). For most of the residues, the value was within the threshold range (–0.5 < ΔδCα < +0.8), indicating again that no well-ordered secondary structures are formed in isolated QB domains. A detailed analysis of the plot, however, revealed that a sequence of residues around the central part of the molecule (from E85 to L90) had significantly larger values, indicating a weak tendency for the formation of an α-helix in this region. Interestingly, this region was also identified by several secondary prediction methods such as the PHD and NewJoint methods,18–21 suggesting a tendency to form an α-helix.
Concentration-dependent change of the 15N-HSQC spectra
While the CD spectra provide averaged, overall secondary structural information on proteins, the intensity and position (chemical shift value) of each NMR peak sensitively reflects the change in the environment surrounding the nuclear spin. Therefore, we expected a detailed analysis of 1H-15N HSQC spectra to be able to reveal the intermolecular interaction between isolated QB domains, although any significant change was not detected in CD spectra at different concentrations of the protein (Fig. 2). To examine any intermolecular interaction between isolated QB domains, 1H-15N HSQC spectra of 15N-labeled QB were measured in the absence and presence of an excess amount of unlabeled QB [Fig. 4(A)]. Although the two spectra were very similar to each other, a detailed analysis revealed a significant decrease in intensity and a slight displacement in peak position for several residues.
Figure 4.
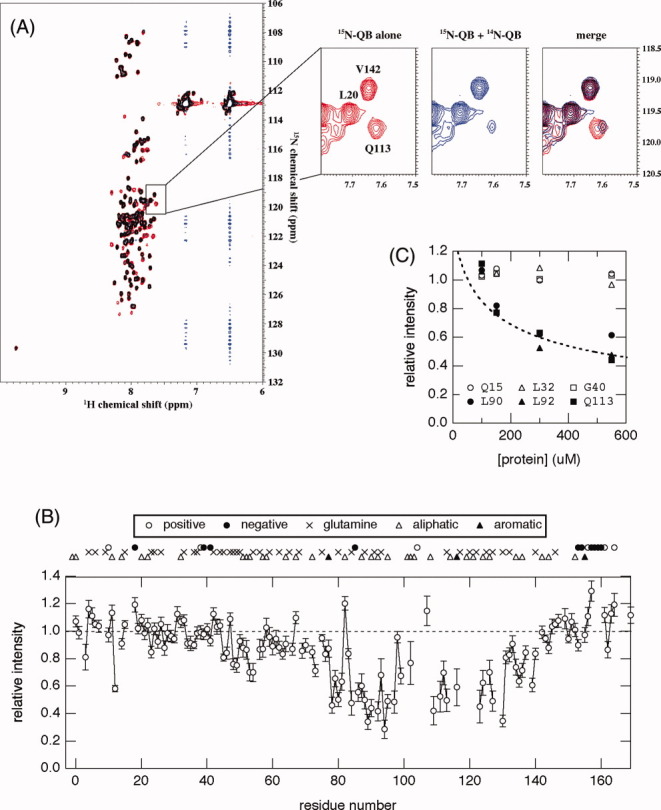
(A) Overlay of the 1H-15N HSQC spectra of 15N-QB domains in the absence (red) and presence (blue) of unlabeled QB domains at 4°C. Concentrations of 15N-QB were 50 μM in both spectra, and an excess amount (500 μM) of unlabeled QB was added. Expansion of the spectra in a representative region is shown in the right panel. The signal for Q113 showed a dramatic decrease in intensity and a slight upfield shift upon an increase in the total protein concentration. (B) The relative peak intensity of 1H-15N HSQC spectra plotted against the residue number of the QB domain. The intensity in the presence of a 10-fold amount of 14N-protein relative to that in its absence is shown. The positions of glutamine residues as well as several characteristic amino acid residues, positively/negatively charged or hydrophobic, are indicated on the top of the graph. (C) Relative peak intensity of several representative residues plotted against total protein concentration. Samples containing a constant concentration (50 μM) of the 15N-QB domain and various concentrations (50–500 μM) of 14N-QB were prepared, and peak intensity relative to that in the absence of 14N-QB was plotted against the total concentration of protein (15N-QB + 14N-QB). A broken line indicates the relative fraction of monomer at a given total protein concentration on the assumption of a monomer–dimer equilibrium [Eq. (2)] at Ka = 4.5 × 10³ M–1.
Relative peak intensity in the presence of a 10-fold 14N-QB protein to that recorded in its absence was plotted against residue number [Fig. 4(B)]. It was clearly shown that the residue which decreased in intensity was located from the center to the C-terminal part of the molecule. This suggests that the interaction between isolated QB domains is site-specific, and the affected residues may represent an important binding site for the molecular interaction. A careful comparison with amino acid type revealed that these regions are relatively rich in aliphatic residues, suggesting the involvement of hydrophobic interaction. Interestingly, the region includes several residues important to the physiological function of full-length Sp1 as revealed by mutational studies, such as Trp116, Leu119, Leu121, and Leu124.22 This suggests the molecular association between QB domains to be important for the physiological function of Sp1.
Analytical ultracentrifugation
Although the analysis of NMR spectra suggested interaction between isolated QB domains, we failed to detect any accumulation of the dimer or higher oligomeric molecular species by size-exclusion chromatography (data not shown). We then measured the sedimentation equilibrium by analytical ultracentrifugation, which provides detailed information for weakly interacting proteins such as weight-averaged molecular weights and equilibrium constants.
We first analyzed the results by assuming that the protein molecule is monodispersed in the solution. In such a case, the logarithm of the protein concentration would linearly depend on the square of the radius, as shown in Eq. (1) (see Materials and Methods). The plots, however, clearly deviated from linearity, showing an upward curvature at larger r2 values [Fig. 5(A)]. This demonstrated that the molecular weight of the isolated QB domain in the solution was not uniform, and equilibrium should exist between the monomer and higher oligomeric states. Correspondingly, the slope of the plots, which gives the weight-averaged molecular weight of the protein, provided a significantly larger value than that expected from the amino acid sequence (Supporting Information Table S1).
Figure 5.
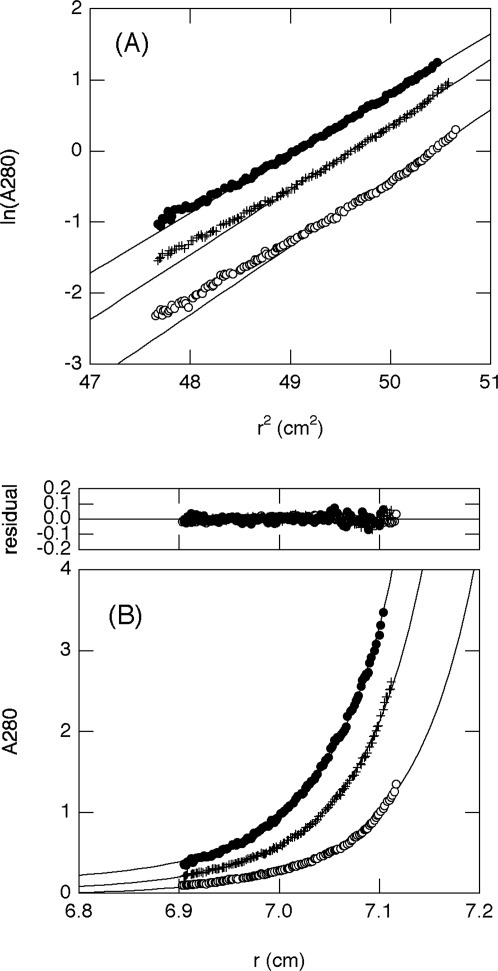
Sedimentation equilibrium analysis of the QB domain at protein concentrations of 50 (open circle), 100 (cross), and 150 μM (closed circle) and at 4°C. (A) ln(c) versus r2 plot. The straight lines in the plot give a weight-averaged molecular weight of 21.3–24.4 kDa for each concentration (Supporting Information Table S1), which is apparently larger than that expected from the amino acid sequence (18.4 kDa). In addition, the data significantly deviated from the lines, indicating that proteins are not in a monodispersed state. (B) Plot of concentration versus radius with a theoretical fit using Eq. (3). Three independent sets of experimental data were globally fit to provide a Ka value of 4.5 × 10³ M–1. The molecular weight of the monomer was fixed at 18.4 kDa during the fit.
Although we do not know the type of multimeric state present in the monomer–oligomer equilibrium of the QB domain, we assumed a monomer–dimer equilibrium as the simplest approximation [Eqs. (2) and (3)]. The plots of three independently performed experiments at different protein concentrations were globally fit to Eq. (3), while fixing the molecular weight of the monomer M1 at 18,400 [Fig. 5(B)]. The fitting converged well and provided a Ka value of 4.5 × 10³ M–1, suggesting that the association is considerably weak.
Titration with unlabeled QB domains monitored by 15N-HSQC
We repeated the 1H-15N HSQC measurements at a fixed concentration of the 15N-labeled QB domain in the presence of various concentrations of the unlabeled QB domain at molar ratio of 1:1, 1:2, 1:5, or 1:10. As expected from the previous results [Fig. 4(B)], the cross peaks could be divided into two groups, one independent of the added unlabeled QB domain, and the other showing a significant decrease in intensity. The results for several representative residues are shown in Figure 4(C). Interestingly, the plots corresponded well among residues belonging to the same group. Furthermore, the plots for decreasing residues also corresponded well to the monomeric fraction calculated based on Eq. (2) with an estimated Ka of 4.5 × 10³ M–1 and total protein concentrations at each point.
The decrease in peak intensity may be attributed to line broadening by the chemical exchange. It was theoretically known that the line-width of an NMR peak would be very broad, and become practically “invisible,” when the nuclear spin is exchanging between two or more chemical environments at a time constant of μs to ms.23 Although the exact nature of the equilibrium is unknown, the association between isolated QB domains is not strong as evidenced by sedimentation equilibrium experiments. Therefore, a number of association and dissociation events between QB domains should occur repeatedly during NMR measurements. A 10-fold difference in the total protein concentration would be enough to shift the apparent rate constant for the intermolecular interaction to that of a μs to ms time-scale, where NMR peaks will apparently “disappear” because of the chemical exchange line broadening.
Sp1 is an intrinsically disordered protein
Recently, a number of proteins that do not have any rigid tertiary structure, generally known as intrinsically disordered proteins (IDPs), or that contain a long disordered region of more than 50 residues, called an intrinsically disordered region (IDR), have been reported.24 Although their biological roles are not fully understood, most IDPs/IDRs are considered involved in molecular recognition, such as protein-protein, protein-nucleotide, and protein-membrane interactions.25,26 Many transcription factors also have long disordered regions, which are considered to form ordered structures upon binding with ligands.
In this study, we clearly demonstrated that the QB domain of Sp1 corresponds to a long intrinsically disordered region. Interestingly, while most of the IDPs/IDRs are considered to show a large conformational change upon binding to its ligands, the interaction between QB domains does not accompany with significant conformational change. The glutamine-rich domain of Sp1 are supported to be important in the self-association, but they are also suggested to associate with the glutamine-rich domains of the other transcriptional factor such as TAF4. A weak but significant interaction without large conformational change found in this study might propose a novel mode of interaction of IDPs/IDRs that enables to recognize many different ligands.
Materials and Methods
Materials
15N-Ammonium chloride, U-13C6-glucose and deuterium oxide were purchased from SI Science (Saitama, Japan). Other reagents were purchased from Nacalai Tesque (Kyoto, Japan).
Protein expression and purification
The expression plasmids for glutamine-rich domains of Sp1 (QB [342-488], Bn [342-424], Bc [421-488]) were constructed as fusion proteins with glutathione S-transferase (GST) at the N-terminal by inserting the genes of interest into the pGEX1 vector (Amrad). Each protein contains the three-residue N-terminal extension and the C-terminal extension of a FLAG-octapeptide-tag followed by a hexahistidine-tag (Fig. 1). The expression vectors encoding GST-Q-rich-FLAG/His fusion protein were introduced into Escherichia coli strain BL21(DE3). Transformed bacteria were grown in Lucia broth medium containing 50 μg mL−1 of ampicillin. Uniformly 15N-labeled and 13C,15N-labeled proteins were prepared from cells grown in M9 minimal medium with 0.5 g L−115NH4Cl and 2 g L−113C-glucose/0.5 g L−115NH4Cl, respectively. Bacterial cells were grown at 37°C, and isopropyl-β-d-thiogalactopyranoside (IPTG) was added to the medium when the absorbance at 600 nm reached 0.6. After the IPTG was added, growth temperature was decreased to 25°C and cells were further incubated overnight. Cells were harvested by centrifugation at 5000g for 15 min at 4°C.
The collected bacterial cells were suspended in buffer A (300 mM NaCl, 50 mM sodium phosphate, pH 8.0) containing 1 mM phenylmethanesulfonyl fluoride, and disrupted by sonication with intermittent pulses for 1 min (pulse of 0.5 s, interval of 0.5 s, output level of 7) three times using an ultrasonic disruptor equipped with a TP-012 standard tip (UD-201, Tomy, Tokyo, Japan). The cell debris was removed by centrifugation at 10,000g for 60 min at 4°C, and the cell extract was loaded onto HisTrap FF (GE Healthcare). The column was washed with buffer A containing 20 mM imidazole, and bound protein was eluted with buffer A containing 500 mM imidazole.
The eluted protein was dialyzed against buffer B (140 mM NaCl, 20 mM sodiumphosphate, pH 7.3), and digested by a protease factor Xa (QIAGEN) to cleave the peptide bond between the GST-tag and Q-rich domain. The protein was incubated for 16 h at 20°C at a ratio of 1 U of enzyme per 200 μg of substrate protein. The digested protein mixture was loaded onto Glutathione Sepharose 4B (GE Healthcare), and flow-through fractions were collected. After the GST-tag moiety was removed, the Q-rich domain was further purified by gel-filtration chromatography using a column of Superdex 75 10/300 GL (GE Healthcare) equilibrated with buffer B. The purity of the protein was confirmed to be >95% by gel-filtration chromatography and SDS-PAGE. The purified proteins were collected and concentrated with Amicon Ultra (Millipore), and stored at 4°C.
Circular dichroism (CD)
CD spectra were measured on a Jasco J-820 spectropolarimeter. A standard quartz cell with a 1-mm light path length, or an assembling cell composed of a pair of quartz plates with a 0.1-mm path length was used to record the spectra at protein concentrations of up to 300 μM. The results are expressed as mean residue ellipticity [θ]. Four scans were averaged for each sample.
NMR measurements
NMR spectra were measured on a Bruker DMX600 spectrometer with a triple-axis-gradient and triple-resonance probe. Sequence-specific resonance assignments were obtained by analyzing the 3D-HNCACB and 3D-hNcocaNH spectra recorded at 4°C.27,28 The concentrations were 1 mM15N,13C-labeled protein, 126 mM NaCl, 18 mM sodium phosphate (pH 7.3) and 10% D2O (90% buffer B and 10% D2O). The spectra were processed with nmrPipe and analyzed with nmrDraw and PIPP.29,30
Analytical ultracentrifugation
Sedimentation equilibrium experiments were performed with a Beckman XL-A analytical ultracentrifuge at 25,000 rpm. The measurements were made at 4°C. The molecular weight and partial specific volume (v) of the QB domain were assumed from the amino acid composition to be 18,400 and 0.7302 cm3 g−1, respectively.31 The density (ρ) of the buffer (140 mM NaCl, 50 mM Na-phosphate, pH 7.3) at 4°C was assumed to be 1.0068 g cm−3. All experiments were performed using double-sector 12-mm-thick charcoal-epon centerpieces and matched quartz windows.
If a protein molecule is monodispersed in a solution, the plot of the logarithm of the protein concentration (c) depends linearly on the square of the radius (r).
| (1) |
where M is the molecular weight of the protein, and R, T, and ω are the gas constant, absolute temperature, and rotor speed, respectively.
If, on the other hand, the protein is in equilibrium between the monomeric (M) and dimeric (D) states at the association constant Ka,
| (2) |
the c versus r plots should be analyzed by the theoretical equation of the integrated form of Eq. (1) on the basis of the monomer–dimer equilibrium.32,33
| (3) |
where cT is the total protein concentration as the monomer, cM0 is the monomer concentration at the arbitrary radius point r0 and M1 is the molecular weight of the monomer. The measurements at three different protein concentrations under the same buffer conditions were carried out using a rotor with three cells, and the results at different concentrations were globally fitted to Eq. (3) using the Igor Pro software program (WaveMetrics).
Acknowledgments
The authors thank Professor Yuji Goto and Ms. Miyo Sakai (Institute for Protein Research, Osaka University) for help with the analytical ultracentrifugation.
Supplementary material
Additional Supporting Information may be found in the online version of this article.
References
- 1.Kavurma MM, Santiago FS, Bonfoco E, Khachigian LM. Sp1 phosphorylation regulates apoptosis via extracellular FasL-Fas engagement. J Biol Chem. 2001;275:4964–4971. doi: 10.1074/jbc.M009251200. [DOI] [PubMed] [Google Scholar]
- 2.Courey AJ, Tjian R. Analysis of Sp1 in vivo reveals multiple transcriptional domains, including a novel glutamine-rich activation motif. Cell. 1988;55:887–898. doi: 10.1016/0092-8674(88)90144-4. [DOI] [PubMed] [Google Scholar]
- 3.Kadonaga JT, Carner KR, Masiarz FR, Tjian R. Isolation of cDNA encoding transcription factor Sp1 and functional analysis of the DNA binding domain. Cell. 1987;51:1079–1090. doi: 10.1016/0092-8674(87)90594-0. [DOI] [PubMed] [Google Scholar]
- 4.Elrod-Erickson M, Pabo CO. Binding studies with mutants of Zif268. J Biol Chem. 1999;274:19281–19285. doi: 10.1074/jbc.274.27.19281. [DOI] [PubMed] [Google Scholar]
- 5.Wilkins RC, Lis JT. DNA distortion and multimerization: novel functions of the glutamine-rich domain of GAGA factor. J Mol Biol. 1999;285:515–525. doi: 10.1006/jmbi.1998.2356. [DOI] [PubMed] [Google Scholar]
- 6.Guo L, Han A, Bates DL, Cao J, Chen L. Crystal structure of a conserved N-terminal domain of histone deacetylase 4 reveals functional insights into glutamine-rich domains. Proc Natl Acad Sci USA. 2007;104:4297–4302. doi: 10.1073/pnas.0608041104. [DOI] [PMC free article] [PubMed] [Google Scholar]
- 7.Reijns MA, Alexander RD, Spiller MP, Beggs JD. A role for Q/N-rich aggregation-prone regions in P-body localization. J Cell Sci. 2008;121:2463–2472. doi: 10.1242/jcs.024976. [DOI] [PMC free article] [PubMed] [Google Scholar]
- 8.Hoey T, Weinzieri ROJ, Gill G, Chen JL, Dynlacht BD, Tjian R. Molecular cloning and functional analysis of drosophila TAF110 reveal properties expected of coactivators. Cell. 1993;72:247–260. doi: 10.1016/0092-8674(93)90664-c. [DOI] [PubMed] [Google Scholar]
- 9.Saluja D, Vassallo MF, Tanese N. Distinct subdomains of human TAFII130 are required for interactions with glutamine-rich transcriptional activators. Mol Cell Biol. 1998;18:5734–5743. doi: 10.1128/mcb.18.10.5734. [DOI] [PMC free article] [PubMed] [Google Scholar]
- 10.Emili A, Greenblatt J, Ingles CJ. Species-specific interaction of the glutamine-rich activation domains of Sp1 with the TATA box-binding protein. Mol Cell Biol. 1994;14:1582–1593. doi: 10.1128/mcb.14.3.1582. [DOI] [PMC free article] [PubMed] [Google Scholar]
- 11.Ström AC, Forsberg M, Lillhager P, Westin G. The transcription factors Sp1 and Oct-1 interact physically to regulate human U2 snRNA gene expression. Nucleic Acids Res. 1996;24:1981–1986. doi: 10.1093/nar/24.11.1981. [DOI] [PMC free article] [PubMed] [Google Scholar]
- 12.Rojo-Niersbach E, Furukawa T, Tanesem N. Genetic dissection of hTAF(II)130 defines a hydrophobic surface required for interaction with glutamine-rich activators. J Biol Chem. 1999;274:33778–33784. doi: 10.1074/jbc.274.47.33778. [DOI] [PubMed] [Google Scholar]
- 13.Courey AJ, Holtzman DA, Jackson SP, Tjian R. Synergistic activation by the glutamine-rich domains of human transcriptional factor Sp1. Cell. 1989;59:827–836. doi: 10.1016/0092-8674(89)90606-5. [DOI] [PubMed] [Google Scholar]
- 14.Mastrangelo IA, Courey AJ, Wall JS, Jackson SP, Hough PVC. DNA looping and Sp1 multimer links: a mechanism for transcriptional synergism and enhancement. Proc Natl Acad Sci USA. 1991;88:5670–5674. doi: 10.1073/pnas.88.13.5670. [DOI] [PMC free article] [PubMed] [Google Scholar]
- 15.Su W, Jackson S, Tjian R, Echols H. DNA looping between sites for transcriptional activation: self-association of DNA-bound Sp1. Genes Dev. 1991;5:820–826. doi: 10.1101/gad.5.5.820. [DOI] [PubMed] [Google Scholar]
- 16.Pascal E, Tjian R. Different activation domains of Sp1 govern formation of multimers and mediate transcriptional synergism. Genes Dev. 1991;5:1646–1656. doi: 10.1101/gad.5.9.1646. [DOI] [PubMed] [Google Scholar]
- 17.Wishart DS, Sykes BD. Chemical shifts as a tool for structure determination. Methods Enzymol. 1994;239:363–392. doi: 10.1016/s0076-6879(94)39014-2. [DOI] [PubMed] [Google Scholar]
- 18.Rost B, Sander C. Prediction of protein structure at better than 70% accuracy. J Mol Biol. 1993;232:584–599. doi: 10.1006/jmbi.1993.1413. [DOI] [PubMed] [Google Scholar]
- 19.Rost B, Sander C. Combining evolutionary information and neural networks to predict protein secondary structure. Proteins. 1994;19:55–72. doi: 10.1002/prot.340190108. [DOI] [PubMed] [Google Scholar]
- 20.Nishikawa K, Noguchi T. Predicting protein secondary structure based on amino acid sequence. Methods Enzymol. 1991;202:31–44. doi: 10.1016/0076-6879(91)02005-t. [DOI] [PubMed] [Google Scholar]
- 21.Ito M, Matsuo Y, Nishikawa K. Prediction of protein secondary structure using the 3D-1D compatibility algorithm. Comput Appl Biosci. 1997;13:415–424. doi: 10.1093/bioinformatics/13.4.415. [DOI] [PubMed] [Google Scholar]
- 22.Gill G, Pascal E, Tseng ZH, Tjian RA. glutamine-rich hydrophobic patch in transcription factor Sp1 contacts the dTATII110 component of the Drosophila TFIID complex and mediates transcriptional activation. Proc Natl Acad Sci USA. 1994;91:192–196. doi: 10.1073/pnas.91.1.192. [DOI] [PMC free article] [PubMed] [Google Scholar]
- 23.Palmer AG, III, Kroenke CD, Loria JP. Nuclear magnetic resonance methods for quantifying microsecond-to-millisecond motions in biological macromolecules. Methods Enzymol. 2001;339:204–238. doi: 10.1016/s0076-6879(01)39315-1. [DOI] [PubMed] [Google Scholar]
- 24.Dunker AK, Lawson JD, Brown CJ, Williams RM, Romero P, Oh JS, Oldfield CJ, Campen AM, Ratliff CM, Hipps KW, Ausio J, Nissen MS, Reeves R, Kang C, Kissinger CR, Bailey RW, Griswold MD, Chiu W, Garner E, Obradovic Z. Intrinsically disordered protein. J Mol Graph Model. 2001;19:26–59. doi: 10.1016/s1093-3263(00)00138-8. [DOI] [PubMed] [Google Scholar]
- 25.Dunker AK, Cortese MS, Romero P, Iakoucheva LM, Uversky VN. Flexible nets. The role of intrinsic disorder in protein interaction networks. FEBS J. 2005;272:5129–5148. doi: 10.1111/j.1742-4658.2005.04948.x. [DOI] [PubMed] [Google Scholar]
- 26.Dunker AK, Brown CJ, Lawson JD, Iakoucheva LM, Obradovic Z. Intrinsic disorder and protein function. Biochemistry. 2002;41:6573–6582. doi: 10.1021/bi012159+. [DOI] [PubMed] [Google Scholar]
- 27.Wittekind M, Muller M. HNCACB, a high sensitivity 3D NMR experiment to correlate amide-proton and nitrogen resonances with the alpha and beta carbon resonances in proteins. J Magn Reson ser B. 1993;101:201–205. [Google Scholar]
- 28.Panchal SC, Bhavesh NS, Hosur RV. Improved 3D triple resonance experiments, HNN and HN(C)N, for HN and 15N sequential correlations in (13C, 15N) labeled proteins: application to unfolded proteins. J Biomol NMR. 2001;20:135–147. doi: 10.1023/a:1011239023422. [DOI] [PubMed] [Google Scholar]
- 29.Delaglio F, Grzesiek S, Vuister G, Zhu G, Pfeifer J, Bax A. NMRPipe: a multidimensional spectral processing system based on UNIX pipes. J Biomol NMR. 1995;6:277–293. doi: 10.1007/BF00197809. [DOI] [PubMed] [Google Scholar]
- 30.Garrett DS, Powers R, Gronenborn AM, Clore GM. A common sense approach to peak picking in two, three and four-dimensional spectra using automatic computer analysis of contour diagrams. J Magn Reson. 1991;95:214–220. doi: 10.1016/j.jmr.2011.09.007. [DOI] [PubMed] [Google Scholar]
- 31.Cohn EJ, Edsall JT. Proteins, amino acids and peptides as ions and dipolar ions. New York: Reinhold Publications; 1943. pp. 370–381. [Google Scholar]
- 32.Sakurai K, Oobatake M, Goto Y. Salt dependent monomer–dimer equilibrium of bovine β-lactoglobulin at pH 3. Protein Sci. 2001;10:2325–2335. doi: 10.1110/ps.17001. [DOI] [PMC free article] [PubMed] [Google Scholar]
- 33.Cantor CR, Schimmel PR. Biophysical Chemistry, part II. Techniques for the study of biological structure and function. New York: W. H. Freeman and Company; 1980. pp. 591–641. [Google Scholar]
Associated Data
This section collects any data citations, data availability statements, or supplementary materials included in this article.


