

Abstract
Knowledge of the dynamic features of protein interfaces is necessary for a deeper understanding of protein–protein interactions. We performed normal-mode analysis (NMA) of 517 nonredundant homodimers and their protomers to characterize dimer interfaces from a dynamic perspective. The motion vector calculated by NMA for each atom of a dimer was decomposed into internal and external motion vectors in individual component subunits, followed by the averaging of time-averaged correlations between these vectors over atom pairs in the interface. This averaged correlation coefficient (ACC) was defined for various combinations of vectors and investigated in detail. ACCs decrease exponentially with an increasing interface area and r-value, that is, interface area divided by the entire subunit surface area. As the r-value reflects the nature of dimer formation, the result suggests that both the interface area and the nature of dimer formation are responsible for the dynamic properties of dimer interfaces. For interfaces with small or medium r-values and without intersubunit entanglements, ACCs are found to increase on dimer formation when compared with those in the protomer state. In contrast, ACCs do not increase on dimer formation for interfaces with large r-values and intersubunit entanglements such as in interwinding dimers. Furthermore, relationships between ACCs for intrasubunit atom pairs and for intersubunit atom pairs are found to significantly differ between interwinding and noninterwinding dimers for external motions. External motions are considered as an important factor for characterizing dimer interfaces.
Keywords: protein-protein interaction, normal-mode analysis, internal motion, external motion, homodimer interfaces, interwinding interfaces, interface dynamics, correlative atomic fluctuations
Introduction
Specific molecular recognition between proteins plays an essential role in biological functions. Structural information of protein–protein complexes is important for understanding protein functions; however, it has mainly been obtained from the analysis of static three-dimensional (3D) structures of protein–protein complexes determined by X-ray crystallography and NMR. For a deeper understanding of protein–protein interactions, knowledge of the dynamic features of protein interfaces is required.1–6
Several computational techniques have been developed to retrieve dynamic information from the static 3D structural data of proteins, that is, normal-mode analysis (NMA), Monte Carlo (MC) simulation, and molecular dynamics (MD) simulation. Although the coverage of the conformational spaces of proteins is smaller in NMA than in MC and MD simulations, owing to the harmonic approximation in NMA, it has been shown that NMA can provide a proper description of the functionally important motions of proteins.7–13 In addition, NMA demands less computational time and thus can be systematically applied to many proteins including those of a large size.
Protein–protein interactions have been investigated individually by NMA to elucidate important motions involved in several biochemical events such as protein-inhibitor binding,14 crystal-packing contacts observed in crystal structures of protein–protein complexes,15,16 and conformational changes involved in protein complex formation.17,18 NMA studies on conformational changes could be useful for developing the methodology to address the problem of flexible protein–protein docking.19–21 However, as was revealed in previous studies,22–24 we have realized that it is difficult to create a unified view of protein–protein interactions because of the variety of biological and biochemical functions in which they occur, as well as the different types of molecular interactions (i.e., hydrophobic, electrostatic, and hydrogen bonding interactions) and structural aspects involved, such as interface shapes and complex structures. Although it is important to investigate individual protein–protein interactions in detail, comprehensive analyses covering multiple protein–protein complexes are also required to understand the dynamic features of protein–protein interactions more deeply.
For such a wide-range examination, we calculated interface-average dynamic properties of 517 representative homodimeric proteins by NMA and then compared them. For a dynamic property, we considered correlativity among atomic motions in the interface, because the interactions among atoms were well reflected in such correlative motions of atoms. The correlativity, as defined below, was calculated for individual atom pairs and then averaged over the atom pairs in the interface for each dimer. These averaged properties, which were assigned to individual dimers as characteristics of the dynamic feature of interface, were examined about how they are distributed and how they can characterize the individual homodimer interfaces.
NMA generates a high number of normal modes for a given dimer. Each normal mode represents a characteristic motion of the dimer. Usually, lower frequency normal modes are studied because they describe collective global motions of atoms related to biochemical function. On the other hand, NMA can also generate time-averaged properties over all normal modes, such as mean displacements of atoms and mean correlation coefficients between motions of atom pairs. In this study, we focus on the averaged correlation coefficients (ACC) over the atom pairs in the interface to characterize the dynamics of protein–protein interactions. One significant point in this study is the decomposition of an atomic motion to internal and external ones in individual subunits of dimers, whereas the whole dimer has no external motion. Here, the internal motion is a deformation of the individual subunits, and the external motion is a rigid-body motion, which changes their mutual positions; they may be referred to as tertiary and quaternary motions of the dimer, respectively. ACCs that can be defined for various combinations of these motions were examined. Another point is that ACC is calculated for two kinds of sets of atom pairs, those within the same subunit (intrasubunit atom pairs) and those in different subunits (intersubunit atom pairs). In addition, we examined the same set of atoms in the protomer state of the individual subunits to reveal the change in the correlated motions on dimer formation.
Knowledge of the correlated fluctuations of atoms at the interfaces may be important for understanding the dynamics of protein–protein interactions and is useful for characterizing individual interfaces from the perspective of a wide range of dimers.
Results and Discussion
ACCs between atoms in dimer interfaces
We analyzed NMA results of 517 nonredundant homodimer interfaces and focused on the fluctuations of atoms at the interfaces in the dimer and protomer states. In the dimer state, the (total) motion of an atom can be divided into two motions, that is, internal and external motions, whereas in the protomer state only the internal motion is considered. For each of the three motions (total, internal, and external motions), we calculated the motion vectors of atoms for each of the several thousand normal modes of a given dimer and then obtained the inner products of these vectors between any two atoms. Subsequently, the inner products (correlation coefficients of motions between paired atoms) were averaged over all normal modes for every atom pair and then averaged over atom pairs in the interface. This averaged correlation coefficient is referred to as ACC in this article. As described in full detail in the Materials and Methods section and in the Supporting Information, we considered intrasubunit and intersubunit atom pairs in the interface separately. We also calculated ACCs separately for the two kinds of sets of atom pairs, that is, close atom pairs (separated by a distance shorter than 4 Å) and distant ones (separated by a distance of 4 Å or longer); they are referred to as ACC4S and ACC4L, respectively. Consequently, we defined seven types of ACCs, ACC4Ss, and ACC4Ls for each dimer as summarized in Table I. The properties of ACC given in Table I may facilitate understanding of the results and discussion described below. Although there exist various ACCs, we mainly discuss the following five ACCs: intrasubunit and intersubunit atom pairs for the internal motion, that is, intra_int-ACC and inter_int-ACC, and those for the external motion, that is, intra_ext-ACC and inter_ext-ACC, and ACC for the protomer state, that is, proto-ACC. These ACC values can range from −1 to 1, where large positive or negative ACC values indicate that paired atoms tend to move in the same or in the opposite direction, respectively, on average. On the other hand, a small ACC value indicates that paired atoms move independently on average or those moving in the same and in the opposite directions are mixed. Consequently, the ACCs are assigned to describe an individual dimer. Our principal interest is to determine how the ACC values for the 517 representative homodimers distribute and how the positioning of the individual dimers in the distribution is associated with their 3D structures.
Table I.
Properties of ACCsa
| (1) Total, internal, and external motion vectors |
| • A total motion vector of an atom obtained for the whole dimer can be decomposed into internal and external motion vectors in the subunit to which it belongs. The internal motion is defined as a motion changing the shape of the subunit, and the external one is a rigid-body motion changing mutual position against the counterpart subunit. |
| (2) Motion vectors of atom pairs considered in ACC calculations |
| ACC is an average of time-averaged inner products of two motion vectors over atom pairs specified below. |
| • intra_tot-ACC: Total motion vectors of two atoms in the interface of the same subunit |
| • intra_int-ACC: Internal motion vectors of two atoms in the interface of the same subunit |
| • intra_ext-ACC: External motion vectors of two atoms in the interface of the same subunit |
| • intra_x-ACC: Internal and external motion vectors of the same atom in the interface of the same subunit |
| • proto-ACC: Internal motion vectors of two atoms in the interface of a protomer |
| • inter_tot-ACC: Total motion vectors of two atoms in the interfaces of different subunits |
| • inter_int-ACC: Internal motion vectors of two atoms in the interfaces of different subunits |
| • inter_ext-ACC: External motion vectors of two atoms in the interfaces of different subunits |
| ACC4S and ACC4L are ACCs of atom pairs with a distance shorter than 4.0 Å and that of atom pairs with a distance of 4.0 Å or longer, respectively. The sum of ACC4S and ACC4L is identical to ACC; for example, intra_tot-ACC = intra_tot-ACC4S + intra_tot-ACC4L. |
| (3) Implication of positive and negative ACCs |
| ACC is defined between −1.0 and 1.0. It indicates the following situations. |
| • The positive larger the ACC value is, the more atom pairs move in the similar direction in the set of atom pairs specified. |
| • The smaller (nearer zero) the ACC value is, the less correlative are the movements of atom pairs in the set of atom pairs specified, or ACC is a mixture of atom pairs moving in the similar direction and in the opposite direction. |
| • The negative larger the ACC value is, the more atom pairs move in the opposite directions in the set of atom pairs specified. |
See Materials and Methods section and Supporting Information for details.
Relationship between ACC and the ratio of interface area to entire surface area
We examined the relationship of the five types of ACCs with the ratio of the interface area to the entire surface area of the component subunits in the 517 homodimer interfaces. The ratio of areas is hereafter referred to as the r-value. As some PDB data of homodimers have two subunits with different sizes as a result of missing residues, the entire surface area of an individual subunit and the average over the entire surface area of two subunits are used against intra-ACCs and inter-ACCs, respectively, in the determination of r-values. Figure 1(A) shows this relationship for intra_int-ACC, intra_ext-ACC, and proto-ACC, and Figure 1(B) shows that for inter_int-ACC and inter_ext-ACC. The regression curves calculated for these ACCs are also shown. The parameters for the regression curves are summarized in Table II. Most of the ACC values decrease exponentially with increasing r-value, except for inter_int-ACC, whose parameter c value is significantly smaller than that of the other ACCs.
Figure 1.
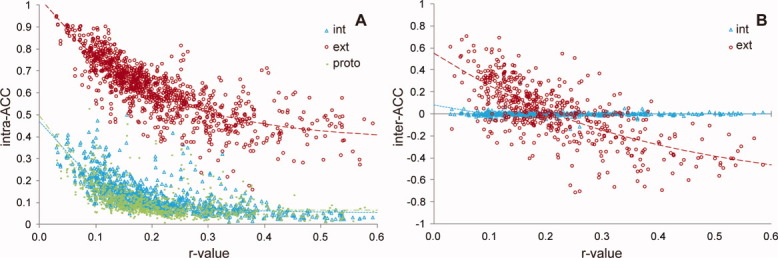
Correlation between ACCs and r-value. A: intra_int-ACC, intra_ext-ACC, and proto-ACC plotted against r-value. B: Same as (A), but for inter_int-ACC and inter_ext-ACC. The data points for internal and external motions of dimers are indicated in cyan triangles and red circles, respectively, whereas those for the protomer state are indicated by yellow-green dots. The regression curves for internal and external motions are represented by the cyan dotted line and red broken line, respectively. The curve for the protomer state is represented by the yellow-green dotted and dashed lines.
Table II.
The Parameters Obtained from the Nonlinear Regression Analysis of the Correlations Between ACCs and r-Value and Between ACCs and Interface Area
| ACC against X (= r-value) | |||||
|---|---|---|---|---|---|
| intra_int | intra_ext | proto | inter_int | inter_ext | |
| a | 0.0556 | 0.381 | 0.0636 | 1.60 × 10⁻³ | −0.718 |
| b | 0.415 | 0.649 | 0.432 | 0.0779 | 1.27 |
| c | 0.0996 | 0.186 | 0.0688 | 0.0205 | 0.374 |
| ACC against X (= interface area) | |||||
|---|---|---|---|---|---|
| intra_int | intra_ext | proto | inter_int | inter_ext | |
| a | 0.0707 | 0.405 | 0.0709 | 3.02 × 10⁻⁴ | −0.393 |
| b | 0.416 | 0.536 | 0.501 | 0.175 | 0.889 |
| c | 595 | 1.43 × 10³ | 403 | 187 | 1.80 × 10³ |
Regression function used: ACC = a + be-X/c.
As shown in Figure 1(A), intra-ACCs and proto-ACC are positive for all dimers and decay with an increase of r-value. Intra_int-ACC and proto-ACC values rapidly decay with increasing r-values in a similar fashion (parameter c in Table II indicates a decay rate), whereas intra_ext-ACC values are much larger and decay less rapidly, approaching a positive finite value at large r-value [parameter “a” indicates an asymptotic value at infinite value of X in Eq. (3)]. In the case of inter-ACCs, most of the inter_int-ACC values are very low, which indicates that the internal motions of atoms in individual subunits are independent of those in the other subunit on average [Fig. 1(B)]. In contrast, inter_ext-ACCs can be both positive and negative and approach a negative finite value as the r-values increase.
We focused on the relationships of ACCs with the ratio of the interface area to the entire surface area of the subunits (r-value) rather than the interface area itself. This is because there are some instances where dimers with similar interface areas can have significantly different ACC values, which may result in noise in the fitting of ACC against interface area, although, in general, ACCs decrease with an increase in interface area as shown in Supporting Information Figure S1. For example, 1e0b-AB and 1sww-AB (where the dimer is represented by the PDB code and the component chain identifiers) have similar interface areas (684 Å2 for 1e0b-AB and 691 Å2 for 1sww-AB), but their inter_ext-ACC values differ significantly (−0.021 for 1e0b-AB and 0.574 for 1sww-AB); however, at the same time, their molecular sizes are also quite different [68 residues for 1e0b-AB and 267 residues for 1sww-AB; for the complex structures of these dimers, see Supporting Information Fig. S2(A,B)]. In a similar way, 1pug-CD and 1g8t-AB have similar interface areas (900 and 905 Å2) but highly different ACC values [inter_ext-ACC = −0.082 and 0.592; Supporting Information Fig. S2(C,D)]. These data suggest that not only interface area but also molecular size in terms of the entire surface area and number of residues can be a key determinant of ACC values.
On the contrary, as seen in Supporting Information Table S-I, the inter_ext-ACC and intra_ext-ACC values of 1e0b-AB, 1sww-AB, 1pug-CD, and 1g8t-AB are more correlated with their r-values. In general, the ACCs are more correlated with the r-values than interface area. As a matter of fact, the residual sums of squares of the regression curves in the ACC versus r-value plots (2.9, 5.8, 2.8, 0.2, and 17.8 for intra_int-, intra_ext-, proto-, inter_int-, and inter_ext-ACCs, respectively) are significantly smaller than those in the ACC versus interface area plots (3.6, 9.4, 3.1, 0.2, and 24.2, respectively).
Relationship between r-value and nature of dimer formation
As shown in Supporting Information Figure S2, the dimer structures with the larger r-values, 1e0b-AB [Supporting Information Fig. S2(A)] and 1pug-CD [Supporting Information Fig. S2(C)], are more compact and of a more globular appearance than the dimers with the smaller r-values, that is, 1sww-AB [Supporting Information Fig. S2(B)] and 1g8t-AB [Supporting Information Fig. S2(D)]. Moreover, by comparing the dimer with the lowest r-value in the dataset, 2p1r-AC, with the dimers of medium r-values, 2oqm-AB and 2dt5-AB, and the highest r-value, 1ihr-AB [Table III; shown in Supporting Information Fig. S3(A–D)], we tentatively conclude that dimers with small r-values may have large intra_ext- and inter_ext-ACC values and that their complex structures are nonglobular and possess nontight and simple interfaces. In contrast, dimers with large r-values might have small or negative ACC values, whereas their interfaces seem tighter and have intersubunit entanglements.
Table III.
Relevant PDB Data of the Protein Dimers Discussed in the Text
| PDB ID | Chains | Interface area (Å2) | r-value | inter_int-ACC | inter_ext-ACC | Figures in Supporting Information |
|---|---|---|---|---|---|---|
| 1e0b | AB | 684.2 | 0.204 | 0.018 | −0.021 | S2(A) |
| 1g8t | AB | 904.9 | 0.103 | −0.001 | 0.592 | S2(D) |
| 1ihr | AB | 3247.0 | 0.584 | 0.017 | −0.460 | S3(D) |
| 1pug | CD | 899.6 | 0.209 | 0.008 | −0.082 | S2(C) |
| 1s0p | AB | 726.8 | 0.097 | 0.003 | −0.072 | S10(A) |
| 1sww | AB | 691.2 | 0.072 | −0.006 | 0.574 | S2(B) |
| 1x8d | AB | 1780.6 | 0.311 | −0.003 | 0.092 | S10(B) |
| 2a9u | AB | 1954.2 | 0.245 | −0.025 | −0.469 | S11(B) |
| 2arv | AB | 1355.9 | 0.220 | −0.045 | −0.395 | S4(A) |
| 2ay0 | AB | 1582.5 | 0.524 | 0.007 | −0.184 | S4(C) |
| 2dt5 | AB | 3165.7 | 0.300 | −0.013 | −0.424 | S3(C) |
| 2oqm | AB | 2355.4 | 0.293 | 0.002 | −0.185 | S3(B) |
| 2p1r | AC | 330.8 | 0.029 | 0.002 | 0.614 | S3(A) |
| 3c90 | AX | 1977.5 | 0.427 | 0.002 | −0.181 | S4(D) |
To investigate the relationship between the r-values and the shape of interface or dimer, we identified 53 interwinding dimers in this dataset by using the classification method developed in our previous study.23 The r-values of the interwinding interfaces range from 0.220 [2arv-AB; Supporting Information Fig. S4(A)] to 0.584 [1ihr-AB; Supporting Information Fig. S3(D)], with the majority of these interfaces having an r-value larger than 0.35 [Supporting Information Fig. S4(B)]. Although there are some exceptions in that a few noninterwinding interfaces have r-values > 0.35, these also have a low degree of intersubunit entanglements, such as is the case for 2ay0-AB and 3c90-AX [Supporting Information Fig. S4(C,D)]. Therefore, most of the entanglements can be identified by their r-values [Supporting Information Fig. S4(B)]. In addition, we analyzed the distribution of ACC values of dimers with and without entanglements and found that they have distinct distributions [Supporting Information Fig. S4(E–H)]. The largest differences can be seen in inter_ext-ACCs, where almost all the interwinding interfaces have highly negative inter_ext-ACC values. These findings suggest that the r-value reflects the shape of interface or dimer, that is, the manner of contact, and that the manner of contact can be an important determinant of ACC values and thus of the dynamics of dimer interfaces.
To facilitate understanding of the ACC and r-value relationship, the examples discussed above as well as those that will be discussed later on in the text and the Supporting Information are superimposed onto a plot of inter_ext-ACC versus r-value in Figure 2. The data of these entries are summarized in Table III and Supporting Information Table S-I. Similar plots for intra_ext-ACC and inter_ext-ACC are shown in Supporting Information Figure S5.
Figure 2.
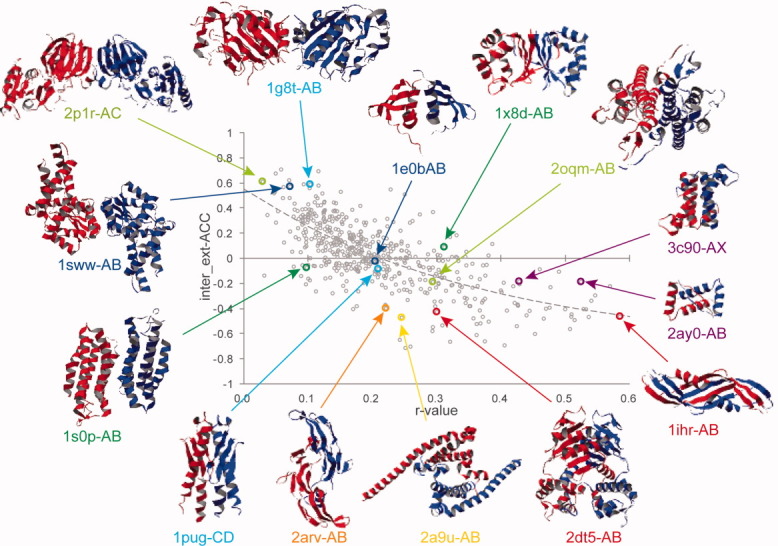
Dimer conformations examined in this study shown superimposed on their respective inter_ext-ACC values of Figure 1(B). The PDB codes are colored as follows: blue and cyan indicate dimers with similar interface areas but of different molecular size and correspond to Supporting Information Figure S2(A–D); yellow-green and red indicate dimers with the smallest [Supporting Information Fig. S3(A)] or medium r-value [Supporting Information Fig. S3(B)], and with the medium [Supporting Information Fig. S3(C)] or largest r-value [Supporting Information Fig. S3(D)] having intersubunit entanglements; orange and purple stand for interwinding [Supporting Information Fig. S4(A)] and noninterwinding dimers [Supporting Information Fig. S4(C,D)]; green corresponds to α-rich and β-rich dimers shown in Supporting Information Figure S10(A,B); and yellow indicates the dimer with a large negative intra_x-ACC [Supporting Information Fig. S11(B)]. For α-rich and β-rich dimers and intra_x-ACC, see Supporting Information Figures S10 and S11, respectively.
Exponential decay of ACC with increasing r-value
As described above, ACCs decay with increasing r-values. Here, we discuss two possible reasons for the ACC decay, that is, the possibility of a rigid-body motion involved in the external motions or a lower correlation between distant atoms.
The rigid-body motion of each subunit comprises both translational and rotational motions, even though such a motion of the entire dimer is eliminated. If only translational motions apply, intrasubunit atom pairs move to the same direction and ACC should be 1.0, and intersubunit atom pairs move to the opposite direction to each other and ACC should be −1.0. In the latter case, the two subunits move to the opposite direction to each other because the center of mass of the entire dimer remains fixed. However, because the rigid-body motion in fact contains a rotational component, some intrasubunit atom pairs move in different directions and some intersubunit atom pairs in the similar direction. Consequently, intra_ext-ACC and inter_ext-ACC will deviate from 1 and −1, respectively, and thus have a wide range of values. Although the percentage of atom pairs moving in different or similar directions strongly depends on factors such as the ratio of rotational motion in the total one, the direction of the rotational axis, the shapes of the dimers and their interfaces, and r-values, ACCs of the external motions can be good indicators for the coherence of the interface.
In fact, the results show that if r-value is small, inter_ext-ACCs are large and hence the interface atoms of two subunits can be considered to move collectively. For example, 2p1r-AC has an inter_ext-ACC of 0.614 and possesses a well-collective interface by rotational motion dominant over translational one [Supporting Information Fig. S3(E)]. In contrast, if r-value is large, inter_ext-ACCs are more negative and hence the interface atoms of two subunits can be considered to move in the opposite direction. For example, 1ihr-AB with an inter_ext-ACC of −0.460 has a negatively correlated interface, which results from the large and complex rotational motions of the interwinding interface [Supporting Information Fig. S3(F)]. As seen in the cases of 2p1r-AC and 1ihr-AB, rotational motion is a main component of the rigid-body motions rather than the translational one in most of the homodimer interfaces, which is the reason why inter_ext-ACCs can be positive in many of the interfaces and decay with an increase of r-values.
It is possible to discuss the r-value dependence of ACCs from a different point (see Supporting Information Fig. S6). As the external motions of the whole dimer is eliminated in NMA, the translational motions of the centers of mass of the two subunits and the rotational motions around some axes through the centers of mass should be in the opposite direction to each other. As a result, when the interfaces are located near to the center of mass, they have a high likelihood of moving in the opposite direction to each other (inter_ext-ACC is negative). On the other hand, when the interfaces are located far from the center of mass, they can move together (inter_ext-ACC is positive). Actually, as shown in Supporting Information Figure S6(A,B), ACCs are negative for short distance between the center of mass and the interface (DCI) and then increase to a positive value with increasing DCI. However, it should be noticed that ACCs are widely distributed for larger DCI. It indicates that the interfaces far from the center of mass have a variety of motions, according to a variety of directions of rotational axes, the shapes of the dimers and their interfaces, and so forth.
Although this point of view with DCI seems to differ so much from the abovementioned r-value dependence of ACCs, DCI is well correlated with r-value [Supporting Information Fig. S6(C)] and either of them is an interesting property to characterize dimer formation and a factor that contributes to the dynamics of interface. However, r-value rather than DCI has been used in this study, because r-value contains information about not only interface area but also dimer formation such as an interwinding dimer.
A second reason is the decay of correlations between atomic motions with an increase in the distance between atoms, and distant atoms contribute more to ACCs in interfaces with large r-values. To clarify the distance dependency of ACC values, we calculated ACCs separately for the two kinds of sets of atom pairs, that is, close atom pairs (separated by a distance shorter than 4 Å) and distant ones (separated by a distance of 4 Å or longer); they are referred to as ACC4S and ACC4L, respectively.
As shown in Supporting Information Figure S7, intra_ext-ACC4L [Supporting Information Fig. S7(A)] and inter_int- and inter_ext-ACC4Ls [Supporting Information Fig. S7(B)] are almost identical to the corresponding ACCs, whereas intra_int- and proto-ACC4Ls [Supporting Information Fig. S7(A)] are slightly smaller than the corresponding ACCs and several of them have negative values.
In Figure 3(A), intra-ACC4Ss are plotted against their corresponding intra-ACC4Ls. As is clear, all intra-ACC4S values are much larger than intra-ACC4L values where especially the intra_ext-ACC4S values are almost equal to 1.0 for any dimer. Figure 3(A) and Supporting Information Figure S7(A) suggest that the decay of correlations between distant atom pairs is responsible for the decay of intra-ACC values. We also evaluated the distance dependency of inter-ACCs. Inter-ACC4Ss are plotted against inter-ACC4Ls in Figure 3(B), which shows completely different features than the relationship between intra-ACC4Ss and ACC4Ls [Fig. 3(A)]. Inter_int-ACC4L is close to zero for any dimer, whereas for inter_int-ACC4S, it can reach 0.8, suggesting that spatially close intersubunit atom pairs move in a positively correlated manner, that is, in a similar direction. In contrast, inter_ext-ACC4S and inter_ext-ACC4L range widely from −1.0 to 1.0 and correlate strongly. Moreover, inter_ext-ACC4S is smaller than inter_ext-ACC4L in the most of the interfaces. These findings indicate that for the external motion, intersubunit distant atom pairs do not contribute to the ACC reduction. It furthermore suggests that while most of the decay in intra-ACCs and inter_int-ACC results from distant atom pairs, the main reason for the decay in inter_ext-ACC is the rotational motion.
Figure 3.
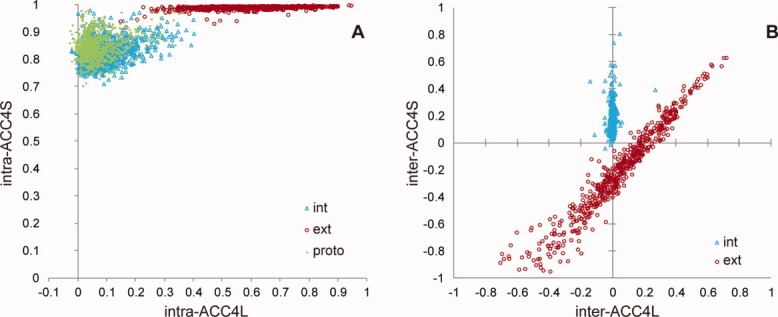
Relationship between ACC4L and ACC4S. A: The relationship between intra-ACC4L and intra-ACC4S. B: The relationship between inter-ACC4L and inter-ACC4S. The data points for internal and external motions of dimers are indicated by cyan triangles and red circles, respectively, whereas those for the protomer state are indicated by yellow-green dots. [Color figure can be viewed in the online issue, which is available at wileyonlinelibrary.com.]
Comparison between ACCs in dimer and protomer states
Figure 4(A,B) plots for each subunit the difference between intra_tot-ACC4L or intra_int-ACC4L and proto-ACC4L and the difference between intra_tot-ACC4S or intra_int-ACC4S and proto-ACC4S against r-values, respectively. The variation of the relative frequency of the dimers with the difference values of ACC4Ls and ACC4Ss are shown in Supporting Information Figure S8(A,B), respectively. These differences suggest a change in correlated motions between atom pairs in the interface on dimer formation.
Figure 4.
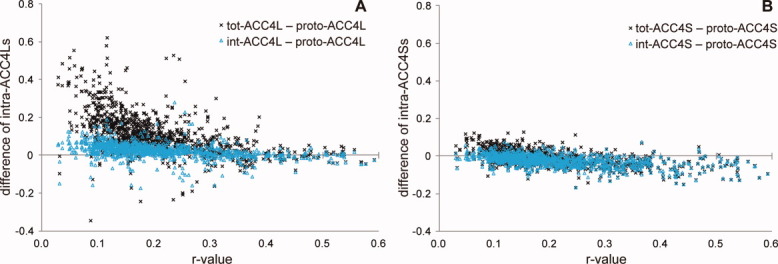
Differences of intra_tot-ACC4L and ACC4S or intra_int-ACC4L and ACC4S from proto-ACC4L and ACC4S. A: The difference between intra_tot-ACC4L or intra_int-ACC4L and proto-ACC4L for individual subunits plotted against r-value. B: The difference between intra_tot-ACC4S or intra_int-ACC4S and proto-ACC4S for individual subunits plotted against r-value. The differences of intra_tot-ACC4L and ACC4S are indicated by black crosses, whereas those of intra_int-ACC4L and ACC4S are indicated by cyan triangles. [Color figure can be viewed in the online issue, which is available at wileyonlinelibrary.com.]
According to Figure 4(A) and Supporting Information Figure S8(A), intra_tot-ACC4L is much larger than proto-ACC4L, whereas intra_int-ACC4L is slightly larger than proto-ACC4L. The same phenomenon as in ACC4Ls is observed in the difference between intra_tot- or intra_int-ACC and proto-ACC as shown in Supporting Information Figure S8(C). The external motions, that is, rigid-body motions, of individual subunits are mainly responsible for this increase because external motion is eliminated in NMA of protomers. On the other hand, intra_tot-ACC4S and intra_int-ACC4S are smaller than proto-ACC4S for many interfaces [Fig. 4(B) and Supporting Information Fig. S8(B)]. They suggest that the dimer formation and the subsequent interaction between the component subunits contribute to the strengthening of the correlation between particularly distant atom pairs in the interface; however, at the same time, they disturb correlated motions for close atom pairs within the same subunit.
The negative values in these figures mean that ACC4L or ACC4S in the protomer state is larger than in the dimer state and, thus, that the atom pairs in the protomer state fluctuate in a more correlated manner than in the dimer state. In the interwinding interfaces, most of the atom pairs are in such a situation [Supporting Information Fig. S8(D,E)], indicating that the dimer formation does not contribute to an improvement in the correlated motion.
Conclusions
A total of 517 representative homodimer interfaces were characterized by the correlated motions of their atoms using various ACCs between motions of intrasubunit or intersubunit atom pairs. It is found that ACCs decay not only with increasing interface area but also with increasing r-values and that ACCs increase with increasing distance between the center of mass of the subunit and interface. It is of interest because they reflect the shape of the dimers and the manner of their contact. The results suggest that a variety in inter_ext-ACC comes from the rotational motions of individual subunits, in particular the directions of rotational axes.
Inter_ext-ACC shows characteristics different from the other ACCs. The values of not only inter_ext-ACCs and ACC4Ls but also ACC4Ss range from −1 to 1, whereas most of the other ACCs are positive. In addition, the inter_ext-ACC4L values are larger than the ACC4S values; it means that distant intersubunit atom pairs fluctuate in a more correlated manner than close atom pairs in the external motion. The reason of the decay of ACCs with increasing r-value is also different; the main reason of the decay in inter_ext-ACC is the rotational motion, whereas the decay in the other ACCs results from less correlative motions of distant atom pairs.
The relationship between ACCs and r-values differs significantly between interwinding and noninterwinding dimer interfaces. These two types of interfaces show different dynamic features. For example, the dimer formation strengthens the correlations of motions, particularly of distant atom pairs, in noninterwinding interfaces, whereas for interwinding dimers, such an increase in correlation by dimer formation is not found. It is also of interest that inter_ext-ACC values are highly negative in almost all interwinding interfaces. These findings suggest that the atoms in intersubunit-entangled regions behave in a more complicated manner.
The homodimers have a variety of interfaces. In such a situation, it is significant to characterize individual homodimer interfaces from a dynamic point of view based on their ACC values, in particular inter_ext-ACC, referring to the distributions of ACCs of various homodimers and the implication of their values discussed in this article (e.g., Fig. 2 and Supporting Information Fig. S5). Furthermore, the study on homodimer is the first step toward a better understanding of heterodimers and more general oligomeric proteins.
The findings in this study may be also useful for distinguishing native dimer interfaces from non-native interfaces in the prediction problem of protein–protein interactions and thus for drug design.
Materials and Methods
Dataset
We searched PDB as of January 2011 for homodimeric interfaces whose structures have been determined by X-ray crystallography at a resolution of 2.5 Å or better and a sequence identity between the component subunits of at least 95%. Of these candidate dimers, we eliminated the dimers that were extremely large in size to perform NMA [i.e., with a total number of atoms including hydrogen atoms in the two component subunits of more than 10,000 (approximately 600 residues)], as well as small dimers of less than 30 residues for each subunit. We then selected the representative structures based on the SCOP family classification so that no pair of dimers belonged to the same family.25 Finally, 517 nonredundant homodimeric interfaces were chosen for analysis.
In choosing homodimeric interfaces from PDB, we primarily referred to the PISA prediction26 for the most probable biologically relevant homodimeric interface with a twofold symmetry and the authors' decision in the primary citation of the PDB data. However, for 41 homodimers in the dataset, as they were composed of more than two subunits, that is, a multimer of homodimers, we chose the dimers with the largest interface area. For another nine homodimers, we gave preference to crystal-packing contacts of two subunits in the adjacent unit cells over the contact of two subunits within the asymmetric unit, because the authors in the primary citation of the PDB data indicate it (1ex2, 1h6p, 1l6r, and 2okg) or because the crystal-packing contact has the largest contact area and is judged as the most probable biologically relevant dimer interface in the crystal by the discrimination method between biological interfaces and crystal contacts developed by Tsuchiya et al.27 (1xma, 1xvh, 2be3, 2cu3, and 2p7j).
Normal-mode analysis
NMA of a dimeric protein was carried out with the program FEDER/228–30 with an ECEPP/3 force field at 310 K.31 FEDER/2 uses dihedral angles as independent variables and takes all constituent atoms into the computation. NMA of the component subunits was carried out separately for comparison.
In NMA, a motion vector Δrα of atom α is obtained for every normal mode. For the time-averaged property over all normal modes, the correlation between motion vectors of atoms α and β, 〈ΔrαΔrβ〉, is a major characteristic property. In particular, the mean-square fluctuation of atom α, 〈(Δrα)2〉, which is the case when α = β, is examined in comparison with a temperature factor provided in the PDB data. In this study, however, we focused on the case where α ≠ β rather than α = β. Such correlations cannot directly be obtained from PDB data without performing NMA or MD simulations.
In addition, we were interested in the motions of individual subunits. A motion vector Δrα of atom α can be written as the sum of its internal and external parts, Δrαi and Δrαe:32
| (1) |
where the superscript t indicates total and is attached to Δrα for convenience. The data pertaining to all 517 homointerfaces were deposited in the ProMode-Oligomer database.2 We expected that the correlation between the total fluctuations in a given dimer, 〈ΔrαtΔrβt〉, and the correlations between internal and external fluctuations in the individual subunits, that is, 〈ΔrαiΔrβi〉, 〈ΔrαeΔrβe〉, and 〈ΔrαiΔrαe〉, for the atoms in a dimer interface region could provide certain aspects of dimer formation from a dynamic point of view. Although the correlations were calculated for every atom pair, in this study, we considered a mean correlation over specified sets of atom pairs in the interface regions to examine the problem comprehensively.
A mean correlation between motion vectors of atoms α and β, referred to as ACC, is defined as follows:
| (2) |
where p and q may indicate t (total), i (internal), and e (external), respectively. The summation is taken over atom pairs in specified sets of atoms S and T, where the normalization factor M indicates the total number of atom pairs involved in the summation. In the actual calculations, only the atoms in the dimer interface region were considered, as defined below for the component subunits A and B. The seven types of ACCs were defined as follows:
intra_tot-ACC: ACC(t, α ∈ A; t, β ∈ A) or ACC(t, α ∈ B; t, β ∈ B)
intra_int-ACC: ACC(i, α ∈ A; i, β ∈ A) or ACC(i, α ∈ B; i, β ∈ B)
intra_ext-ACC: ACC(e, α ∈ A; e, β ∈ A) or ACC(e, α ∈ B; e, β ∈ B)
intra_x-ACC: ACC(i, α ∈ A; e, β = α ∈ A) or ACC(i, α ∈ B; e, β = α ∈ B)
inter_tot-ACC: ACC(t, α ∈ A; t, β ∈ B)
inter_int-ACC: ACC(i, α ∈ A; i, β ∈ B)
inter_ext-ACC: ACC(e, α ∈ A; e, β ∈ B),
where α ∈ A denotes an atom in the interface of subunit A. It should be noted that the correlation between internal and external motion vectors of the same atom has been averaged for intra_x-ACC (Supporting Information Fig. S11 describes intra_x-ACC in detail). In addition, ACC was calculated for atom pairs in the interface (defined in a dimer state) of the individual protomer-state subunits, which we refer to as proto-ACC. In NMA, all motions involved in proto-ACC are attributed to internal motions, as the external motion is eliminated.
An interface region was defined as a set of atoms with a distance of less than 4.0 Å from at least one atom in the subunits' counterpart. For the protomer-state interface region, the same set of atoms was used as those defined for the dimer.
Calculation of the entire surface area and interface area
The entire surface area of a subunit was calculated as the total sum of the areas of all triangles on the molecular surface of the subunit, whereas an interface area was calculated based on the intersubunit contacts between molecular surfaces of the two component subunits.23 The intersubunit contacts between molecular surfaces are defined as a set of intersubunit pairs of triangle vertices separated by a distance of 3.0 Å or shorter. The contact area is defined as the sum of the areas of those triangles of which at least two vertices are involved in intersubunit contacts. We used this contact area as interface area of a dimer.
Regression analysis
Nonlinear regression analysis was performed by the program R to calculate the relationships between ACC and r-value (Fig. 1) and between ACC and interface area (Supporting Information Fig. S1).33
The regression curves have the following form:
| (3) |
where X denotes r-value or interface area, and the parameters a, b, and c are adjustable parameters. The results are summarized in Table II. Here, it should be noted that when c > 0, ACC approaches a with X → ∞, whereas ACC = a + b if X = 0. The parameter c for the decay rate can be interpreted as a scaling factor because ACC − a is reduced to 1/e = 0.368 times its initial value (i.e., at X = 0) at X = c.
Acknowledgments
Super-computing resources were provided by the Human Genome Center, Institute of Medical Science, University of Tokyo, Japan.
Supplementary material
Additional Supporting Information may be found in the online version of this article.
References
- 1.Moritsugu K, Kurkal-Siebert V, Smith JC. REACH coarse-grained normal mode analysis of protein dimer interaction dynamics. Biophys J. 2009;97:1158–1167. doi: 10.1016/j.bpj.2009.05.015. [DOI] [PMC free article] [PubMed] [Google Scholar]
- 2.Wako H, Endo S. ProMode-Oligomer: database of normal mode analysis in dihedral angle space for a full-atom system of oligomeric proteins. Open Bioinformatics J. 2012;6:9–19. [Google Scholar]
- 3.Benson NC, Daggett V. Dynameomics: large-scale assessment of native protein flexibility. Protein Sci. 2008;17:2038–2050. doi: 10.1110/ps.037473.108. [DOI] [PMC free article] [PubMed] [Google Scholar]
- 4.Schuyler AD, Carlson HA, Feldman EL. Computational methods for predicting sites of functionally important dynamics. J Phys Chem B. 2009;113:6613–6622. doi: 10.1021/jp808736c. [DOI] [PMC free article] [PubMed] [Google Scholar]
- 5.Ma J. Usefulness and limitations of normal mode analysis in modeling dynamics of biomolecular complexes. Structure. 2005;13:373–380. doi: 10.1016/j.str.2005.02.002. [DOI] [PubMed] [Google Scholar]
- 6.Zen A, Micheletti C, Keskin O, Nussinov R. Comparing interfacial dynamics in protein–protein complexes: an elastic network approach. BMC Struct Biol. 2010;10:26. doi: 10.1186/1472-6807-10-26. [DOI] [PMC free article] [PubMed] [Google Scholar]
- 7.Brooks B, Karplus M. Harmonic dynamics of proteins: normal modes and fluctuations in bovine pancreatic trypsin inhibitor. Proc Natl Acad Sci USA. 1983;80:6571–6575. doi: 10.1073/pnas.80.21.6571. [DOI] [PMC free article] [PubMed] [Google Scholar]
- 8.Go N, Noguti T, Nishikawa T. Dynamics of a small globular protein in terms of low-frequency vibrational modes. Proc Natl Acad Sci USA. 1983;80:3696–3700. doi: 10.1073/pnas.80.12.3696. [DOI] [PMC free article] [PubMed] [Google Scholar]
- 9.Levitt M, Sander C, Stern PS. Protein normal-mode dynamics: trypsin inhibitor, crambin, ribonuclease and lysozyme. J Mol Biol. 1985;181:423–447. doi: 10.1016/0022-2836(85)90230-x. [DOI] [PubMed] [Google Scholar]
- 10.Horiuchi T, Go N. Projection of Monte Carlo and molecular dynamics trajectories onto the normal mode axes: human lysozyme. Proteins. 1991;10:106–116. doi: 10.1002/prot.340100204. [DOI] [PubMed] [Google Scholar]
- 11.Hayward S, Go N. Collective variable description of native protein dynamics. Annu Rev Phys Chem. 1995;46:223–250. doi: 10.1146/annurev.pc.46.100195.001255. [DOI] [PubMed] [Google Scholar]
- 12.Hinsen K. Analysis of domain motions by approximate normal mode calculations. Proteins. 1998;33:417–429. doi: 10.1002/(sici)1097-0134(19981115)33:3<417::aid-prot10>3.0.co;2-8. [DOI] [PubMed] [Google Scholar]
- 13.Wako H, Endo S. Ligand-induced conformational change of a protein reproduced by a linear combination of displacement vectors obtained from normal mode analysis. Biophys Chem. 2011;159:257–266. doi: 10.1016/j.bpc.2011.07.004. [DOI] [PubMed] [Google Scholar]
- 14.Bakan A, Bahar I. The intrinsic dynamics of enzymes plays a dominant role in determining the structural changes induced upon inhibitor binding. Proc Natl Acad Sci USA. 2009;106:14349–14354. doi: 10.1073/pnas.0904214106. [DOI] [PMC free article] [PubMed] [Google Scholar]
- 15.Hinsen K. Structural flexibility in proteins: impact of the crystal environment. Bioinformatics. 2008;24:521–528. doi: 10.1093/bioinformatics/btm625. [DOI] [PubMed] [Google Scholar]
- 16.Song G, Jernigan RL. vGNM: a better model for understanding the dynamics of proteins in crystals. J Mol Biol. 2007;369:880–893. doi: 10.1016/j.jmb.2007.03.059. [DOI] [PMC free article] [PubMed] [Google Scholar]
- 17.Tobi D, Bahar I. Structural changes involved in protein binding correlate with intrinsic motions of proteins in the unbound state. Proc Natl Acad Sci USA. 2005;102:18908–18913. doi: 10.1073/pnas.0507603102. [DOI] [PMC free article] [PubMed] [Google Scholar]
- 18.Dobbins SE, Lesk VI, Sternberg MJ. Insights into protein flexibility: the relationship between normal modes and conformational change upon protein–protein docking. Proc Natl Acad Sci USA. 2008;105:10390–10395. doi: 10.1073/pnas.0802496105. [DOI] [PMC free article] [PubMed] [Google Scholar]
- 19.Bonvin AM. Flexible protein–protein docking. Curr Opin Struct Biol. 2006;16:194–200. doi: 10.1016/j.sbi.2006.02.002. [DOI] [PubMed] [Google Scholar]
- 20.May A, Zacharias M. Energy minimization in low-frequency normal modes to efficiently allow for global flexibility during systematic protein–protein docking. Proteins. 2008;70:794–809. doi: 10.1002/prot.21579. [DOI] [PubMed] [Google Scholar]
- 21.Smith GR, Sternberg MJ. Prediction of protein–protein interactions by docking methods. Curr Opin Struct Biol. 2002;12:28–35. doi: 10.1016/s0959-440x(02)00285-3. [DOI] [PubMed] [Google Scholar]
- 22.Jones S, Thornton JM. Principles of protein–protein interactions. Proc Natl Acad Sci USA. 1996;93:13–20. doi: 10.1073/pnas.93.1.13. [DOI] [PMC free article] [PubMed] [Google Scholar]
- 23.Tsuchiya Y, Kinoshita K, Nakamura H. Analyses of homo-oligomer interfaces of proteins from the complementarity of molecular surface, electrostatic potential and hydrophobicity. Protein Eng Des Sel. 2006;19:421–429. doi: 10.1093/protein/gzl026. [DOI] [PubMed] [Google Scholar]
- 24.Tsuchiya Y, Kanamori E, Nakamura H, Kinoshita K. Classification of heterodimer interfaces using docking models and construction of scoring functions for the complex structure prediction. Adv Appl Bioinform Chem. 2009;2:79–100. doi: 10.2147/aabc.s6347. [DOI] [PMC free article] [PubMed] [Google Scholar]
- 25.Murzin AG, Brenner SE, Hubbard T, Chothia C. SCOP: a structural classification of proteins database for the investigation of sequences and structures. J Mol Biol. 1995;247:536–540. doi: 10.1006/jmbi.1995.0159. [DOI] [PubMed] [Google Scholar]
- 26.Krissinel E, Henrick K. Inference of macromolecular assemblies from crystalline state. J Mol Biol. 2007;372:774–797. doi: 10.1016/j.jmb.2007.05.022. [DOI] [PubMed] [Google Scholar]
- 27.Tsuchiya Y, Nakamura H, Kinoshita K. Discrimination between biological interfaces and crystal-packing contacts. Adv Appl Bioinform Chem. 2008;1:99–113. doi: 10.2147/aabc.s4255. [DOI] [PMC free article] [PubMed] [Google Scholar]
- 28.Higo J, Seno Y, Go N. Formulation of static and dynamic conformational energy analysis of biopolymer systems consisting of two or more molecules-avoiding a singularity in the previous method. J Phys Soc Jpn. 1985;54:4053–4058. [Google Scholar]
- 29.Wako H, Go N. Algorithm for rapid calculation of Hessian of conformational energy function of protein by supercomputer. J Comput Chem. 1987;8:625–635. [Google Scholar]
- 30.Wako H, Endo S, Nagayama K, Go N. FEDER/2: program for static and dynamic conformational energy analysis of macro-molecules in dihedral angle space. Comput Phys Commun. 1995;91:233–251. [Google Scholar]
- 31.Nemethy G, Gibson KD, Palmer KA, Yoon CN, Paterlini G, Zagari A, Rumsey S, Scheraga HA. Energy parameters in polypeptides. X. Improved geometrical parameters and nonbonded interactions for use in the ECEPP/3 algorithm, with application to proline-containing peptides. J Phys Chem. 1992;96:6472–6484. [Google Scholar]
- 32.Ishida H, Jochi Y, Kidera A. Dynamic structure of subtilisin–eglin c complex studied by normal mode analysis. Proteins. 1998;32:324–333. doi: 10.1002/(sici)1097-0134(19980815)32:3<324::aid-prot8>3.0.co;2-h. [DOI] [PubMed] [Google Scholar]
- 33.R Development Core Team. R: a language and environment for statistical computing. Vienna, Austria: R Foundation for Statistical Computing; 2008. Available from: http://www.R-project.org (Accessed on Sep 18, 2011) [Google Scholar]
Associated Data
This section collects any data citations, data availability statements, or supplementary materials included in this article.