

Abstract
Sensory-motor behavior results from a complex interaction of noisy sensory data with priors based on recent experience. By varying the stimulus form and contrast for the initiation of smooth pursuit eye movements in monkeys, we show that visual motion inputs compete with two independent priors: one prior biases eye speed toward zero; the other prior attracts eye direction according to the past several days' history of target directions. The priors bias the speed and direction of the initiation of pursuit for the weak sensory data provided by the motion of a low-contrast sine wave grating. However, the priors have relatively little effect on pursuit speed and direction when the visual stimulus arises from the coherent motion of a high-contrast patch of dots. For any given stimulus form, the mean and variance of eye speed covary in the initiation of pursuit, as expected for signal-dependent noise. This relationship suggests that pursuit implements a trade-off between movement accuracy and variation, reducing both when the sensory signals are noisy. The tradeoff is implemented as a competition of sensory data and priors that follows the rules of Bayesian estimation. Computer simulations show that the priors can be understood as direction-specific control of the strength of visual-motor transmission, and can be implemented in a neural-network model that makes testable predictions about the population response in the smooth eye movement region of the frontal eye fields.
Introduction
Our actions are guided by sensory signals. However, sensory input alone does not control the accuracy and precision of sensory-guided actions. Instead, movement parameters are determined by a competition of sensory data with prejudices gleaned from the recent history of stimuli or movements (Körding and Wolpert, 2004; Körding et al., 2004; Knill, 2007; Verstynen and Sabes, 2011). Strong sensory data defeat prejudices, while prejudices defeat weak or noisy sensory data. Thus, movement implements an optimal tradeoff between sensory data and past experience. It weights sensory data more strongly when its signal-to-noise ratio is high, but biases actions toward internal priors when low sensory signal-to-noise ratios indicate unreliable information.
The knowledge that the brain performs according to the rules of optimal behavior stops far short of our ultimate goal. The next, necessary step is to understand how neural circuits implement the competition between sensory data and priors. Verstynen and Sabes (2011) made a step toward a neurally plausible implementation. They showed that recurrent connections within a neural network create a Bayesian “prior” through Hebbian plasticity. Their network's prior interacts with sensory data to reproduce experimental observations on how the past history of target location affects the bias and variation of reaching movements.
Existing knowledge about the neural basis for smooth pursuit eye movement (Lisberger, 2010) provides a context for taking the next step by investigating how and where a prior might be implemented in specific neural circuits. Under the simplest conditions, pursuit can be regarded as a nearly reflexive behavior. Sensory estimation of the direction and speed of target motion feeds data to circuits devoted to motor processing (Osborne et al., 2005). Within 100 ms after a target starts to move, pursuit takes smooth eye velocity in the direction of target motion, and quickly creates eye velocity that nearly matches target velocity (Lisberger and Westbrook, 1985). However, sensory estimates of target speed and direction do not have unfettered access to the motor circuitry. The quality of pursuit is determined partly by a neural system that modulates the strength, or gain, of visual-motor transmission (Schwartz and Lisberger, 1994; Nuding et al., 2008). Modulation is directional (Schwartz and Lisberger, 1994), and is under the control of signals that emanate from the smooth eye movement region of the frontal eye fields, or FEFSEM (Tanaka and Lisberger, 2001, 2002b; Nuding et al., 2009).
In the present paper, our data demonstrate a competition between the sensory data that drive movement initiation and two priors about the relative probability of different target motions. One prior is shaped according to the distribution of target directions presented to the subjects, and influences the direction of pursuit initiation. The other prior prejudices pursuit's estimate of target speed toward zero (Weiss et al., 2002). We also show that modulation of the strength of visual-motor transmission by the FEFSEM provides a plausible mechanism for implementation of a Bayesian prior in pursuit eye movements. Our neural network model uses the recurrent network suggested by Verstynen and Sabes (2011) to create priors, and places the model FEFSEM inside a larger architecture based on current thought of the organization of the pursuit circuit (Lisberger, 2010). The model reproduces the competition between priors and sensory data for pursuit initiation and makes testable predictions about the responses of neurons at the locus that forms priors.
Materials and Methods
We conducted experiments on the smooth pursuit eye movements of three male rhesus monkeys weighing 9 and 11 kg. Before experiments, the monkeys underwent sterile surgeries with isoflurane anesthesia to implant a head holder on the skull and a scleral search coil in one eye (Ramachandran and Lisberger, 2005). After recovery from surgery, the monkeys were trained to fixate and track visual targets while they sat with their head fixed to the ceiling of a specially designed primate chair. A droplet of liquid was delivered as a reward for correct behavior. The research was conducted while the authors were at the University of California, San Francisco. All methods had received previous approval from the Institutional Animal Care and Use Committee at the University of California, San Francisco, and conformed to the National Institutes of Health Guide for the Care and Use of Laboratory Animals.
Visual stimuli and experimental design.
Visual stimuli were displayed on a gamma-corrected 24-inch CRT monitor (SONY GDM-FW900) that was positioned 60 cm from the monkey and subtended horizontal and vertical angles of 44° and 29°. The spatial resolution of the monitor was 2304 × 1440 pixels and the vertical refresh rate was 80 Hz. Stimuli were presented on a gray background (29 cd/m2) and themselves covered a luminance range between 0 and 56 cd/m2. We used three types of visual targets. Spots subtended 5 × 5 pixels, or ∼0.1 × 0.1° of visual angle, and were black (0.26 cd/m2). Sine wave gratings had contrasts of 12, 25, 50 or 100% and spatial frequency of 1 cycle per degree, and were vignetted with a two-dimensional Gaussian function to create a small stimulus with a limited spatial frequency content. The bandwidth (SD) of the Gaussian filter was 1°, and the visible part of the stimulus was ∼4° in diameter. Random dot patches were made from 72 spots inside a circular window with a 4° diameter. Patches of dots had the same average luminance as the gray background because we included equal numbers of bright and dark dots inside each patch. The nominal contrast of the dot patches was defined as the difference between the luminance of the bright and dark dots divided by the sum of the luminance of the bright and dark dots, converted into percentages. Thus, a contrast of 100% means that we used maximum luminance for the bright dots and minimum luminance for the dark dots. All experiments occurred in a reasonably dark room with the display monitor as the main source of illumination.
The experiments were divided into trials, and each trial presented the motion of one stimulus form at one speed and direction. Trials with stimulus motion in different directions or with gratings versus dot patches as the motion stimulus could be intermingled in randomized order during a daily experiment. Each trial started with a black spot presented at the center of the screen. After monkeys had fixated within 2° of the spot for a random duration between 800 and 1200 ms, the spot disappeared and a tracking stimulus appeared at the center of the screen and started moving at 10 deg/s. For the first 100 ms, the invisible aperture around the stimulus remained stationary and the dots or grating moved behind the aperture. Then, the texture and the aperture moved together at the same speed and in the same direction. The monkeys received a droplet of fluid if they tracked within a 4 × 4° window around the moving stimulus until it stopped and disappeared. Unfinished trials were discarded. The data presented in this paper were derived from 104 experiments and 87,729 useable pursuit trials in monkey J, 33 experiments and 36,024 useable pursuit trials in monkey N, and 46 experiments and 52,048 useable pursuit trials in monkey U.
We attempted to influence the monkeys' priors for target direction by selecting the directions of stimulus motion to create two different contexts. To achieve a uniform direction context, tracking directions were evenly distributed around the full 360° of a circle with a spacing of 5°. To achieve a narrow direction context, motion directions were equally and narrowly distributed around a chosen “central” axis, such as 45/225°. To balance the tracking, pairs of opposite central directions were always delivered as part of a single experiment. For example, when the central direction was 0°, the full experiments comprised target directions of 0, ±5, ±10, and ±15° as well as 180, 180 ± 5, 180 ± 10, and 180 ± 15°. Our subjects usually completed >50 repetitions per day for each tracking direction under the narrow prior and ∼15 repetitions for each tracking direction under the uniform prior.
Data acquisition and analysis.
We recorded horizontal and vertical eye position and velocity on a millisecond time scale, using the scleral search coil system. Velocity signals were obtained through an analog circuit that differentiates the eye position signals, and filters them with a cutoff frequency of 25 Hz and a roll-off of 20 dB/decade. Trials were selected for an absence of saccades in the interval from 10 ms before to 230 ms after the onset of stimulus motion. Many responses to the same stimuli were aligned and averaged. The onset of pursuit was determined by visual inspection of the averaged traces for eye speed. Then, we used the value of the averaged traces 125 ms after the onset of pursuit to quantify the initial pursuit response; all the same trends appeared 100 ms after the onset of pursuit as well. By quantifying pursuit in the first 125 ms after the onset of pursuit, we avoid any effects of feedback (Lisberger and Westbrook, 1985). Therefore, we were able to probe the sensory-motor transformation for motion signals provided by different stimulus forms and for different contexts established by the daily blend of target directions. To quantify postsaccadic eye speed, we measured eye velocity in the interval from 40 to 90 ms after the time when the down stroke of the saccadic deflection of eye velocity crossed a threshold of 30 deg/s.
We introduced “direction gain” and “speed gain” as measures of the accuracy of pursuit initiation. We computed the difference in eye direction divided by 5° for all pairs of targets with direction differences of 5°. We then averaged across the 6 pairs of target directions within ±15° relative to each central direction to estimate direction gain. This method of computing direction gain has the virtue of being insensitive to the small uniform offsets of eye direction seen in some of our experiments with the 12%-contrast grating. A direction gain of 1 indicates that the difference in eye direction for two target motions is equal to the difference in target direction. We computed the ratio of eye speed divided by target speed (10 deg/s) for each direction of target motion. We then estimated speed gain by averaging across the 7 target directions within ±15° relative to each central direction. A speed gain of 1 indicates the eye speed matches target speed 125 ms after the pursuit. For the uniform context, we treated each of the 72 directions as a central direction and analyzed direction gain and speed gain for each central direction using the data for the surrounding 6 directions of target motion.
To obtain probability distributions of eye direction, we subtracted the uniform shift in eye direction that sometimes appeared across target directions. We increased the number of trials contained in each probability distribution by reflecting and combining the data for symmetrical target directions (i.e., +15 and −15°), and we rotated all experiments as if the central direction of target motion was 0°. Finally, probability distributions of target direction and speed for the “uniform” context actually were obtained on the first day when we presented the narrow context used to cause the monkey to learn a narrow directional prior. For the direction data, it was necessary to use the data from this day, before the direction prior had been learned at all, to obtain enough repetitions of each target direction to make meaningful distributions. For the speed data, we wanted to present quantitative results for the same experimental day used to obtain the direction distributions. In fact, the distributions of eye speed showed the same effects of stimulus form when we pooled across the 72 directions of target motion in experiments that created the uniform context.
Neural network model of pursuit.
We modeled MT neurons as a product of Gaussian direction and speed tunings, with a population that had 60 preferred speeds by 120 preferred directions:
Here, S and D are the speed and direction of target motion, s and d index the population along the axes of preferred speed and direction, and PSs and PDd are the preferred speed and direction of MTs,d. Preferred speeds were distributed evenly on a log2 scale between 0.5 and 512 deg/s. Preferred directions were distributed evenly around a circle between 0 and 360°. Note that the model MT neurons did not have spontaneous activity, a complexity that we chose not to include at this time. We do not think spontaneous activity would have a big impact on our results as long as it is in the experimentally observed range of 10–15% of the peak response (Hohl and Lisberger, 2011).
We used methods and parameters described before (Huang and Lisberger, 2009) to add realistic trial-by-trial variation and neuron-neuron correlations to the simulated MT population response. Tuning parameters were: σsp = 2.5 (monkey J) or 2.0 (monkey U); σD = 45°; A = 1 (grating) or 10 (patch). In our own samples of MT neurons, we found speed tuning widths that averaged 2.0 in log2 units (1.3 in loge units), in reasonable agreement with the data of Nover et al. (2005) showing speed tuning curves with a median of 1.16 loge unit.
The model FEFSEM population also contained 60 times 120 units. We can think of the model FEFSEM population as having columns of preferred directions and rows of preferred speeds. Along each direction column, we set a speed prior by connecting each model neuron to all model neurons with the same preferred direction but lower preferred speeds according to:
where unit s2 is the recipient of the connection, unit s1 is the origin of the connection, and PS1 > PS2. Parameters were: Ws = 0.035 (monkey U) or 0.2 (monkey J); XS = 1 (monkey U) or 0.03 (monkey J). We felt comfortable using quite different parameters for the speed prior in the two monkeys on the basis that the speed data for the two monkeys was modeled best by different priors, and the prior is a learned feature of the neural system and could be very different across subjects. Along each speed row, we set the direction prior by connecting model FEFSEM neurons in a way that created an attractor toward motion in the central direction, defined as 0°:
Here, ΔPDx is the log of the difference in angle between the 0° prior and the preferred direction of neuron x, and σw is the width of the prior. We set the value of σw to be 2° for both monkeys, on the basis that the direction priors appeared to be very similar in the data for the two monkeys.
We computed the responses of each unit in the population through 6 iterations to allow the model FEFSEM population to settle to a stable state that represented the outcome of a competition between the sensory data from MT and the priors established by the recurrent weights. In each iteration, we computed the inputs to each unit as:
 |
In Equation 4 and the subsequent equations, i and j index the preferred speed and direction of the model neurons. The term: collects inputs from the 60 model MT neurons with the full range of preferred speeds, but only one preferred direction, dj. The two terms for the FEFSEM perform summations across preferred direction and preferred speed respectively, holding the other parameter constant. We then computed the response of each model FEFSEM neuron as:
 |
Here, the brackets, 〈 〉, indicate the mean across the internal values of u for model FEFSEM neurons of all preferred speeds and directions. Thus, the denominator performs normalization. Recurrent connections have some advantages as a mechanism to create priors: they create them de novo without passing the buck to an site earlier in the circuit, and the priors can be learned through Hebbian mechanisms that adjust the weights of the recurrent connections (Verstynen and Sabes, 2011). The same effect on the output of our model could have been produced by a negotiation between sensory inputs and a top-down biasing of the neurons in the model FEFSEM that were most active for a given stimulus. Thus, the mechanism that creates the prior is less important in our model than is implementation of the prior through downstream modulation of the gain of visual-motor transmission.
In the “multiplier” population, each model FEFSEM neuron multiplies the visual input from a model MT neuron with a given preferred speed, so that each model FEFSEM neuron has a preferred speed based on its output connection, though not for its inputs or responses:
We decoded the Ms,d units by reading out separate estimates of motion direction and speed:
 |
 |
In Equation 7H the use of the trigonometric relationship obviates problems created by discontinuities in the value of PDd at 0/360. We chose this decoder because it is effectively a “vector averaging” decoder and provides a nearly optimal estimate of the preferred speed and direction of the model multiplier neurons at the peak of the population response (Salinas and Abbott, 1994). Other decoders, such as maximum likelihood (Deneve et al., 1999; Jazayeri and Movshon, 2006) have nearly identical mean behavior in estimating target speed and direction, although the optimal decoders (Deneve et al., 1999) perform somewhat differently in terms of variance. Our other work on decoders indicates that a decoder that “knows” the correlations between neurons in MT and the FEFSEM would not have yielded a different result (S. S. Hohl, K. S. Chaisanguanthum, and S. G. Lisberger, unpublished observations).
The architecture of our model and the use of gain control to implement priors is based on our understanding of the organization of the neural circuit for pursuit (Lisberger, 2010), and the evidence presented in Results showing that we can think of priors as a consequence of gain modulation. Our goal is to demonstrate the feasibility of creating priors in the initiation of pursuit through a mechanism based on gain control operating through the FEFSEM. We accomplish this goal by showing that we can reproduce the pursuit behavior of our monkeys quite well using a model with an architecture based on the neural circuit for pursuit. At the same time, the parameters of our model are not unique, and our goal was not to reproduce the details of the micro-organization of the neural circuits. For example, the recurrent connection weights could take a number of forms and magnitudes in the model FEFSEM, as long as they create the same direction of gradients as in our model. As we mention later, they also could be replaced with top-down modulation of the population response in the FEFSEM.
Bayesian model of pursuit behavior.
According to Bayes rule,
where p(xtrue|xsensed) is the posterior distribution for the estimates of target direction and speed, p(xsensed|xtrue) is the likelihood distribution based on the sensory data, and p(xtrue) is the prior distribution.
If we assume Gaussian distributions for the likelihood and prior distributions, then Equation 8 becomes:
 |
The maximum of the posterior distribution can be obtained by the differentiation of the above equation. The maximum a posteriori (MAP) estimate and the estimate from averaging the distribution will be the same because the posterior distribution will follow the Gaussian. The MAP estimate is:
 |
In Equation 10, σprior and μprior determine the shape and the center of the prior distribution, and xsensed is drawn from a Gaussian distribution that has finite width because of noise in the sensory representation. Because xestimated is a deterministic function of xsensed, we can compute the mean and variance of the estimates of target direction or speed:
 |
 |
We solved Equations 11 and 12 once for speed and once for direction by using a least square procedure to find the parameters of the prior and likelihood distributions that provided the best fits to the distributions found in the data. The fits had only three adjustable parameters: the variance of the likelihood distribution for each of the two stimulus forms, and the variance of the prior distribution. We used a Gaussian function with a huge SD for the uniform direction prior, and do not consider this to be a “free” parameter.
Results
Initiation of pursuit eye movements
Smooth pursuit eye movements react to target motion with a rapid eye acceleration that brings eye velocity close to target velocity within the first 100 ms of the response. Because of the 100 ms latency for visual feedback, the accuracy of the initiation of pursuit arises from an “open-loop” response and relies on two high-fidelity stages of processing. First, the sensory system extracts estimates of target direction and speed that are accurate, at least on average, and also fairly precise (Osborne et al., 2005). Second, using neural computations that appear to add very little noise to the estimates of target motion (Osborne et al., 2005; Medina and Lisberger, 2007; Schoppik et al., 2008; Huang and Lisberger, 2009), the motor system transforms the estimates of target direction and speed into the correct eye acceleration so that eye velocity is nearly equal to target velocity at the end of the first 100 ms of the response.
The main features of the initiation of pursuit appear in Figure 1 for stimulus forms such as a high-contrast patch of dots or a bright spot. First, the average pursuit eye velocity evoked by “step-ramp” target motion nearly matches the target velocity just 200 ms after the onset of stimulus motion, ∼100 ms after the onset of pursuit. Second, the eye velocity in the initiation of pursuit follows variable trajectories on different trials (inset). Third, for any given target motion, the trajectories of eye motion cluster around the vector of the target motion itself. Thus, the initiation of pursuit has finite accuracy and precision, which we will estimate here on the basis of the eye velocity 125 ms after the initiation of pursuit. The values we report are a good index of the eye velocity throughout the initiation of pursuit, because the initiation of pursuit can be accounted for in terms of very few dimensions (Osborne et al., 2005). As a result, eye velocity early in the initiation of pursuit is closely related to eye velocity at the time we have used for measurements. Checking our findings with the quantitative analyses used by Osborne et al. (2005, 2007) did not alter our conclusions.
Figure 1.

Stimulus forms and design of tracking trials. Images at the left show the stimulus forms we used. A, The traces show averages of the eye velocity and position for a target that moved down and right in direction 350° and speed 10 deg/s. Solid and dashed traces show eye and target velocity. The inset plots eye and target velocity as two-dimensional vectors: light gray arrow and black traces show target motion and eye motions for target motion to the right; black arrow and light gray traces show target motion and eye motions for target motion to the right and somewhat downward. Time proceeds from velocities of (0,0) at the left outward along each trace; each trace ends 225 ms after the onset of target motion. B, C, Summary of two experiments using different stimulus forms in the uniform context. D, E, Summary of two experiments using different stimulus forms in the narrow context. Arrows show target velocity and noisy traces show eye velocity. In B–E, time proceeds from velocities of (0,0) outward along each trace and each trace ends 225 ms after the onset of target motion. Symbols on eye velocity traces in D and E indicate 100 ms after the onset of pursuit.
Effect of context and stimulus form on the initiation of pursuit
The quality of monkeys' pursuit eye movement performance depended on the context we created through the blend of target motions in an experiment, and on the form of the moving stimulus. Figure 1B–E shows results from example experiments under a “uniform” versus a “narrow” direction context and a using a moving stimulus consisting of a 100%-contrast patch of coherent random dots versus a 12%-contrast sine wave grating.
We created a “uniform” direction context by presenting target motions selected randomly from 72 directions spaced at 5° intervals around the full 360° of target motion. We present the average performance in a typical experiment as a two-dimensional velocity plot that shows horizontal eye velocity as a function of vertical eye velocity. The two-dimensional plot does not index the passage of time, except that the onset of pursuit is associated with zero eye velocity at the center of the graphs (Fig. 1B,C) and the end of each trace shows the eye velocities 125 ms after the onset of pursuit. When the moving target was a 100%-contrast patch of dots (Fig. 1B), the 72 eye velocity traces fanned out from the center of the graph in fairly uniform directions and reached eye speeds equal to the target speed of 10 deg/s by the end of the traces, 125 ms after the onset of pursuit. When the target was a 12%-contrast sine wave grating (Fig. 1C), the direction of pursuit was appropriate for the moving stimulus for the 72 directions of target motion, but eye speed 125 ms after the onset of pursuit was considerably below the target speed of 10 deg/s. Eye speed also showed an asymmetry favoring the 45/225° axis over the 135/315° axis. Such asymmetries are common in the initiation of pursuit in monkeys, and have been noted by others as well (Grasse and Lisberger, 1992). We will argue below that the low values of eye speed occurred because the weak and/or noisy visual motion inputs from a 12%-contrast sine wave grating were dominated by a prior that target speed is zero. Yet, the distribution of eye directions was fairly uniform because of a uniform prior created by the uniform direction context.
We created a “narrow” direction context by interleaving randomly target motions in directions that were 0, ±5, ±10, or ±15° relative to a single “central” target direction (arrows in Fig. 1D,E). When the moving stimulus was a patch of 100%-contrast, coherent random dots under conditions of a narrow prior (Fig. 1D), the initiation of pursuit was excellent. The eye speed 125 ms after the onset of smooth eye motion (end of the traces) was close to the target speed of 10 deg/s, and the eye directions were spread out according to the spread of the different target directions. In contrast, when the moving stimulus was a 12%-contrast sine wave grating (Fig. 1E), the eye speed 125 ms after the onset of pursuit was well below target speed. The eye directions were squashed together so that the spread of eye directions was narrower than the spread of target directions. In this example, eye direction also showed a general rotation toward upward for all target directions with a leftward component. We saw some direction rotation for 12%-contrast gratings in many of our experiments, but we contrived the quantitative analysis of the data to remain immune to rotation while capturing the squashing of the responses to closely spaced target directions.
Reward contingencies did not interact with the effects of the priors. Integrated over the 100 ms interval of the initiation of pursuit, the effects of stimulus form on eye velocity amount to very small errors in eye position. For example, a 6 deg/s shortfall in eye velocity at the end of the first 100 ms of pursuit amounts to an eye position error of 0.3°. Monkeys were rewarded for their eye position later in the trial, and the errors caused by the 12%-contrast grating stimuli were much smaller than the 3–4° size of the eye position window. Thus, the monkey's good motor performance for 100%-patch stimuli and worse direction and speed performance for 12%-contrast grating had no positive or negative value in terms of the availability of reward.
Quantitative analysis of direction and speed gain
We use “direction gain” and “speed gain” to quantify how closely the initiation of pursuit tracked target direction and speed under different conditions (see Materials and Methods). Speed gain is the ratio of average eye speed to target speed, while direction gain is the ratio of the difference in average eye direction divided by the difference in target direction for target motions that differed in direction by 5°. Figure 2, A–D, quantifies the direction and speed gain in polar coordinates by plotting the data for each of the 72 directions of target motion in the uniform context as a separate symbol to indicate the end of a vector with angle equal to target direction and length equal to either direction or speed gain. Each graph superimposes data from three daily experiments.
Figure 2.

Pursuit behavior for different stimulus forms in a uniform versus a narrow context. A, C, Summary of direction gain as a function of target direction in the uniform context. B, D, Summary of speed gain as a function of target direction in the uniform context. Each symbol in the polar plots indicates the end of a vector, where the length of the vector is the value of direction or speed gain and the angle of the vector indicates the direction of target motion. Open and filled symbols show data for the grating and patch stimuli. Data are from three consecutive experimental days to show the consistency of the effects. E, F, Summary of pursuit performance in the narrow context for monkeys J (E) and N (F). Each symbol shows data for a different experimental day and plots speed versus direction gain. Different symbols indicate different stimulus forms and different values of contrast. Dashed lines indicate equality of speed and direction gain.
For the high-contrast patch stimuli under the uniform context, direction gain was fairly uniform and close to one for all directions of target motion (filled symbols, Fig. 2 A,C) as was speed gain (Fig. 2B,D). For 12%-contrast grating stimuli with the same uniform context (open symbols), direction gain had some minor anisotropies in both monkeys and showed some variation from day to day, especially in monkey U (Fig. 2A,C). In both monkeys, the initiation of pursuit for the 12%-contrast grating showed a slight tendency to underestimate target direction differences for horizontal motion and overestimate target direction differences for vertical motion (open symbols, Fig. 2A,C). As has been found before in human subjects (Krukowski and Stone, 2005), the anisotropies differed subtly between monkey subjects. In contrast to the small and idiosyncratic effects of stimulus form on eye direction, we found a large and consistent effect on eye speed. Speed gain was uniformly low for the 12%-contrast grating (open symbols, Fig. 2B,D). The general findings in the uniform context were the same in both monkeys, even though monkey U had been exposed only to uniform contexts before these data were acquired, while monkey J had extensive experience under the narrow context.
We interpret the low speed performance for the 12%-contrast gratings in the uniform context as evidence that pursuit has a prior for low target speeds. The prior dominates over the weak sensory-data provided by the low-contrast moving grating, as suggested before for motion perception (Weiss et al., 2002). For reasons outlined at the end of the next section, we do not think that the low speed performance for 12%-contrast gratings simply reflects lesser effort or laziness on the part of the monkey.
In a separate series of experiments performed on monkeys J and N at the start of the study, we used moving gratings and patches with contrasts of 12, 25, 50, and 100% under the narrow context. In both monkeys, the overall performance of the initiation of pursuit varied widely across days and stimulus forms. Each symbol in Figure 2, E and F, plots direction gain versus speed gain for one combination of stimulus form and experimental day. Speed and direction gain were significantly correlated with each other (Monkey N: r = 0.62, p ≪ 0.01; Monkey J: r = 0.66, p ≪ 0.01), and both ranged from ∼0.6 to 1.1, with a slightly narrower range in monkey N. A considerable portion of the variance in pursuit performance could be attributed to the form and contrast of the visual stimulus. In general, patches of dots (open symbols) provoked better initiation of pursuit than did gratings (filled symbols); performance improved as contrast moved from 12% (purple symbols) to 25% (blue) to 50% (orange) to 100% (black). ANOVA for the data in Figure 2, E and F, revealed statistically significant effects of both stimulus form and contrast, except for the effect of contrast in monkey N (p = 0.09). There were no significant interactions.
The seeming continuum of performance as a function of stimulus form and contrast motivated us to explore the effect of stimulus form in greater detail by concentrating on pursuit of the two stimulus forms that provided the extremes of performance: 12%-contrast gratings and 100%-contrast patches of dots. We did so with the full knowledge that gratings pose a potential problem for motion estimation because of the “aperture effect” (Movshon et al., 1985; Weiss et al., 2002), but with the thought that we might be able to take advantage of the large difference in the representation of motion for these two extremes of stimulus form and contrast. Because monkey N was involved in unit recording studies, these later experiments were conducted on monkeys J and U.
Acquisition of a narrow direction prior
When we discovered the range of values of direction and speed gain in our early experiments with the narrow context, we were troubled by the day-to-day variation in the initiation of pursuit and the monkeys' poor directional performance on some days. It occurred to us that the poor directional performance might be a directional anisotropy of mysterious origin (Krukowski and Stone, 2005), so we rotated the central direction of target motion in monkey J from horizontal to oblique and discovered the sequence of results shown in Figure 3A. The poor directional performance was remedied immediately on the first day with the new central directions of 45/225°. Direction gain was one, even with the 12%-contrast grating as a pursuit stimulus (points indicated by arrows). However, direction gain then declined on the second and subsequent days to values of ∼0.7. Speed gain was 0.7 and 0.8 for the two directions of target motion on the first day of exposure to the narrow context, and did not change across days. In contrast, for the 100%-contrast patch stimuli, the direction gain and speed gain were close to one even after direction gain had declined for the 12%-contrast grating (filled circle).
Figure 3.

Pursuit behavior for high-contrast patch and low-contrast grating stimuli during acquisition of a narrow prior. A, One set of experiments on monkey J. B–D, Three successive sets of experiments on monkey U. Each symbol shows data from a single experimental day. Filled and open symbols show data for moving patches versus grating stimuli. Arrows in each graph point to the data for the first day of each experimental series. Dashed vertical and horizontal lines indicate direction and speed gains of 1.
In a more systematic set of experiments, we analyzed the behavior of monkey U starting from the first day he experience the narrow context. We used only the 12%-contrast grating as a stimulus form, and chose central motion directions along the axis of 135/315° because the direction gain was close to one for those directions in the uniform context. On his first day of experience with the narrow context (Fig. 3B, points indicated by arrows), the direction gain was one and the speed gain was less than one. The effect of the narrow direction context on direction gain accreted gradually over several days: it moved slowly toward lower values on each successive day in Figure 3B. Speed gain remained essentially constant across days at a value less than one even as direction gain gradually decreased.
In the next set of experiments on monkey U (Fig. 3C), we interleaved randomly an equal number of trials with 100%-contrast patches of dots or 12%-contrast gratings as moving stimuli, but retained the target directions of the narrow context. For the 12%-contrast gratings, direction and speed gain both remained well below one. Even though they increased slightly relative to the experiments included in Figure 3B, the speed and direction gains for the 12%-contrast gratings remained well below those for the interleaved trials with 100%-contrast patches of dots (filled symbols).
In the final set of experiments on monkey U (Fig. 3D), we rotated the central directions of the target motions by 90° to 45 and 225°. Direction gain for the 12%-contrast gratings reverted to a value close to 1 on the first day (points indicated by arrows) and then declined steadily day-over-day, as it had before. For the 100%-contrast patches, direction gain was close to one on all days. As before, speed gain was consistently below one for 12%-contrast gratings, but remained close to one for 100%-contrast patches of dots. Subsequent experiments showed that the gradual, day-over-day decrease in direction gain in the narrow context depended only on the blend of target directions in an experiment. After 5 d of tracking 100%-contrast patch stimuli in the narrow context, direction gain was greatly reduced on the subsequent day for 12%-contrast grating stimuli. Additional experience with 12%-contrast gratings in the narrow context did not reduce direction gain further.
In Figure 3, we observed systematic changes in direction gain as a function of the context provided by the history of target motion, even though the visual stimulus remained the same. We conclude that pursuit can learn, with several days of experience, a prior that attracts the direction of smooth eye motion toward the central direction of a narrow range of target directions. We also conclude that the direction and speed priors are independent, because we were able to modify one without affecting the other. We did not perform companion experiments to determine whether the apparent prior for low target speeds (Weiss et al., 2002) also is modifiable.
We think it would be incorrect to dismiss the effects demonstrated in Figure 3 as “anticipation” (Wells and Barnes, 1998), because our monkeys' smooth eye movements did not start before the normal initiation of pursuit. In addition, several features of the data argue that the effects are not caused by a lack of effort by the monkeys for 12%-contrast grating targets. First, the speed and direction behavior of pursuit were independent. On the first day of experience with the narrow context, we recorded accurate eye direction but low speed gains; direction gain declined day-over-day decline while speed gain remained constant. Second, under the narrow context, we observed low values of speed and direction gain for the 12%-contrast gratings even when they were interleaved with 100%-contrast patches of dots so that the monkey could not anticipate correctly what stimulus would appear on any given trial. Third, the effects in Figure 3 are measured from the first 125 ms of the pursuit response, nominally before there has been time for the monkey to make a cognitive decision about how hard to try in a given trial. Fourth, postsaccadic pursuit was excellent for both stimulus forms, indicating excellent effort at all times. For target motion at 10 deg/s, average postsaccadic eye speed was 9.1–9.4 deg/s for the 12%-contrast gratings and 9.8–10.4 deg/s for the 100%-contrast dot patches. Further, postsaccadic eye velocity increased day-over-day during the acquisition of a narrow directional prior that might otherwise be taken as evidence for lack of effort.
Effect of context and stimulus form on the bias and variance of pursuit performance
We have shown that the stimulus form and context together can affect both the speed and direction performance of pursuit, on average. To move toward a mechanistic understanding of how a neural circuit modulates motor performance depending on the nature of the sensory drive and any priors, we now dissect the effects into changes in the bias and variance of eye speed and direction. For this analysis, we compare data obtained before versus after the instantiation of a narrow prior, and with the extremes of visual motion provided by the 12%-contrast grating and the 100%-contrast patch of dots.
The probability distribution functions of eye speed (Fig. 4A,B) depended strongly on stimulus form and only slightly on whether targets were presented in the narrow or uniform context (dashed versus continuous curves). The distribution of eye speed was narrow and centered near target speed of 10 deg/s when the moving stimulus was a 100%-contrast patch of dots (red curves). The distribution of eye speed was somewhat broader (especially in monkey U) and centered below target speed when the moving stimulus was a 12%-contrast grating (black curves). Statistical analysis (Kruskal–Wallis test for medians, Levene's test for variance) confirmed the effects of stimulus form on both the median and variance of the eye speed, with infinitesimal p-values. Because of the large number of samples used to form each distribution, we also found statistically significant effects of context on the median eye speed in monkey J and on the variance in monkey U, albeit with less significant (i.e., larger) p-values commensurate with the tiny magnitude of the effects of context (dashed versus continuous curves) visible in Figure 4, A and B.
Figure 4.

Effect of context and stimulus form on the variance and bias of eye speed and direction. A, B, Probability distribution of eye speed for two monkeys. C–F, Probability distributions of eye direction for two monkeys for two directions of target motion, where 0° was the central direction in each experiment. C and D show results for the uniform prior for the two monkeys. E and F show results for the narrow prior. In all panels, black and red traces show results for 12%-contrast gratings versus 100%-contrast patches of dots. Dashed versus continuous curves show results for the uniform versus narrow prior conditions. Dashed traces in E and F are the same as those shown in C and D. In C–F, vertical lines indicate target direction. Data were accumulated across 4 experiments in each monkey.
The distributions of eye direction (Fig. 4C–F) revealed large effects of both stimulus form and context on both bias and variance. In the uniform context (Fig. 4C,D), there was little bias: the distributions were centered near target direction (vertical lines) for both stimuli and target directions of both 0 and 15°. In the narrow context (Fig. 4E,F), target motions in a direction of 15° yielded distributions for the 12%-contrast grating (black curves) that were centered at eye directions of 7.5–10°, indicating a bias toward the central direction of target motion. In contrast, the distributions for the 100%-contrast patch (red curves) showed only a small amount of bias for target directions of 15° in the narrow context. Statistical tests of the medians of the distributions in Figure 4 using the Kruskal–Wallis test revealed significant effects of stimulus form on the bias of the eye direction distributions for target directions of 15° in both monkeys, but not for target directions of 0° (p > 0.4). Note that there were some systematic rotations across all target directions in a day's experiment (cf. Fig. 1E), and that these were removed before creating the distributions in Figure 4C–F. In addition, the data for target motion at −15° were reflected and combined with the data for target motion at +15° to create Figure 4C–F. Thus, the large bias for 12%-contrast gratings moving in direction 15° is caused by a compression of eye direction toward the central direction in an experiment, rather than by a uniform rotation of eye direction.
In situations where stimulus context caused direction compression, it also caused a significant decrease in the variance of eye direction. For the grating stimuli, the direction compression caused by changing from the uniform context (black dashed curves, Fig. 4C–F) to the narrow context (black continuous curves, Fig. 4E,F) was associated with a decline in the direction variance from 64.6 to 39.2 deg2 in monkey U and from 34.2 to 25.2 deg2 in monkey J. The difference was statistically significant in both monkeys (Levene's test for variance, p < 0.0001). For the patch stimuli, changing from the uniform context (red dashed curves, Fig. 4C–F) to the narrow context (red continuous curves, Fig. 4E,F) did not cause direction compression, and had only a small, nonsignificant effect on variance. The variance of eye direction declined from 9.8 to 8.5 deg2 in monkey U and from 8.3 to 7.9 deg2 in monkey J (p > 0.1 in both monkeys). We note that the distributions in Figure 4C–F are quite noisy, due to finite data; it is difficult to assess whether any apparent deviations from Gaussian are real.
Linkage of direction gain and variance: signal-dependent noise
In Figure 4, the reduction in direction gain in the narrow context is accompanied by a decrease in the variance of eye direction. Thus, pursuit appears to obey the principle of “signal-dependent noise” (Harris and Wolpert, 1998), as long as target form is kept constant. To understand this better, we analyzed the direction gain and variance under several different conditions.
For the sequence of days as the monkey experienced the narrow direction context and gradually acquired the narrow direction prior, the direction gain and the variance of direction decreased progressively for the 12%-contrast gratings (Fig. 5, open symbols). In the graphs for both monkeys used for this experiment, the first day of exposure to the narrow direction prior plots at the upper-right of the set of open circles, and the data proceed toward lower values of variance and gain as the monkeys acquire the narrow prior. These relationships were highly significant (Monkey U: slope = 47, p = 0.004; Monkey J: slope = 34, p = 0.027). The same relationship between variance and gain appears when we consider the 72 directions of motion for a 12%-contrast grating under conditions of a uniform context (black filled symbols), although there was the subtle effect of context on the vertical offset of the relationship between variance and gain for the 12%-contrast gratings. Again, these relationships were highly significant (Monkey U: slope = 53, p < 0.001; Monkey J: slope = 68, p < 0.001). The relationship between direction variance and gain is qualitatively different for 100%-contrast patches (x'es) versus 12%-contrast gratings (open and filled circles). Patches lead to much lower direction variance for a given value of direction gain, an effect we attribute to the higher signal-to-noise ratio in the sensory representation of motion for the patch stimuli.
Figure 5.

Signal-dependent versus sensory noise in pursuit. Plots of direction variance noise versus direction gain for the two monkeys. Open circles show data from multiple daily experiments during the repetitions used to study the acquisition of the narrow prior. Filled symbols show 72 data points for 12%-contrast gratings averaged across 3–4 experimental days in the uniform prior. Black x'es show 72 data points for 100%-contrast patches averaged across 3–4 experimental days in the uniform prior.
We can understand the relationship between variance and gain and the effect of stimulus form if the pursuit circuit has three features that have been suggested in prior work. First, the variation in pursuit must arise mainly from correlated noise in neurons of area MT, as suggested by Osborne et al. (2005), Medina and Lisberger (2007), and Huang and Lisberger (2009): 12%-contrast gratings should produce a noisier population code than do 100%-contrast patches. Second, the representation of stimulus speed and direction in MT should be close to veridical in the sense that the speed and direction of target motion are encoded reliably across stimulus forms and contrast, by the preferred speed and directions of the most active neurons across the population. Prior work has indicated that this is largely, but not entirely true (Priebe and Lisberger, 2004; Krekelberg et al., 2006). Third, the sensory estimates of target speed and direction must be modulated by a gain control that acts downstream from sensory estimation and has proportional effects on the magnitude and variation of the target motion estimates (Schwartz and Lisberger, 1994; Tanaka and Lisberger, 2001). Under these reasonable conditions suggested by prior studies, speed and direction priors in pursuit could not be attributed to effects on the sensory representation in MT. Instead, the speed and direction gain of pursuit in our experiments appear to be probes for the internal gain of visual-motor transmission under different pursuit conditions.
Figure 5 suggests that the representation of motion for 12%-contrast gratings is indeed noisier than that for 100%-contrast patches of dots, and that the pursuit system sets its gains lower along both the speed and direction axes for the noisier motion representation. Because sensory signal and noise both must be processed through the elements in the brain that control direction gain, lowering the internal gain trades precision for accuracy. It creates biases in eye direction and speed that reduce the accuracy of the first 125 ms of pursuit, but it improves the precision of pursuit performance by mitigating sensory noise. This tradeoff appears in the positive slope of the relationship between variance and gain for grating stimuli in Figure 5.
Simulation of pursuit data with a network model
Our next goal was to understand how a competition between sensory data and priors could be implemented in neural circuits. Our strategy was to start with a model structure (Fig. 6) that represents existing thought about the organization of the neural circuit for pursuit (Lisberger, 2010; Schwartz and Lisberger, 1994). The most important features of the model architecture are: (1) two parallel pathways drive pursuit; (2) one pathway originates in area MT, is responsible for visual-motor drive, and directs sensory estimates of target motion to the motor circuits for pursuit (Churchland and Lisberger, 2000); (3) the second pathway uses signals that emanate from the smooth eye movement region of the frontal eye fields (FEFSEM) to control the strength, or gain, of visual-motor drive (Schwartz and Lisberger, 1994; Tanaka and Lisberger, 2001; Nuding et al., 2008, 2009).
Figure 6.
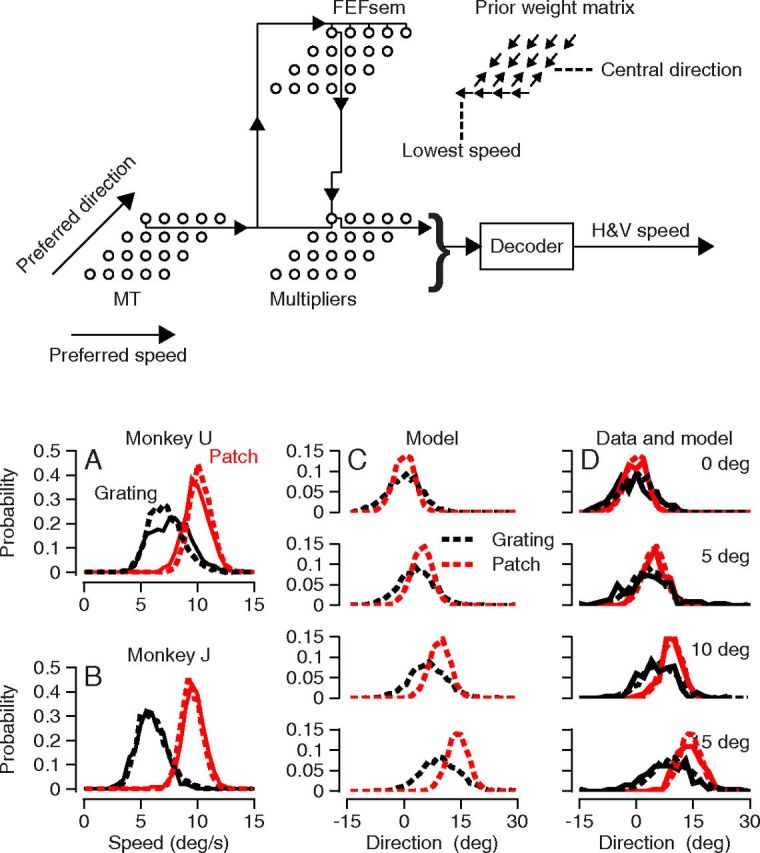
Performance of a network model of the pursuit circuit. The schematic diagram at the top shows the structure of the model network. Arrows in the model network indicate the direction of signal flow for one unit in each model population and provide a caricature of the implementation described with equations in Materials and Methods. The “prior weight matrix” in the upper right indicates that the weights within the model FEFSEM push the population response toward the lowest preferred speed and the central direction of target motion. A, B, Comparison of model performance and distributions of eye speed for monkeys U and J. C, Performance of the model for simulated patch and grating stimuli after instantiation of a narrow prior. D, Comparison on model and monkey performance for the same conditions used in C. In all panels, black and red traces show results for 12%-contrast gratings versus 100%-contrast patches of dots. Dashed versus continuous curves show results for the model versus the data.
We explore neural network implementations of the existing model and attempt to reproduce four features of pursuit illustrated above. (1) Pursuit behaves as if there is a competition between sensory data and prior experience. The competition is nonlinear in the sense that strong sensory data defeat the prior while weak sensory data lose to the prior. (2) Pursuit is subject to two independent priors. One prior biases eye speed toward zero. The other prior compresses eye direction toward the central, or mean, direction in the last few experimental days. (3) Priors appear to be implemented through modulation of the gain of transmission of veridical sensory estimates to the motor system. (4) When the stimulus form is held constant, the variance of eye direction scales with the direction gain of the initiation of pursuit, indicating that most of the variation in the initiation of pursuit arises upstream from locus where the gain of visual-motor transmission is controlled. The details of our data do not constrain tightly the exact parameters of our model. Thus, we emphasize our demonstration that the Bayesian-like behavior of the initiation of pursuit could emerge from a model based on the previously known general architecture of the pursuit circuit.
To create an effect of stimulus form on pursuit, we used a neural model where the responses of MT neurons depend on the form of the moving visual stimulus. Model MT neurons were tuned for the speed and direction of target motion and were given tuning curves, trial-by-trial variation, and neuron-neuron correlations consistent with prior data (Huang and Lisberger, 2009). To change the strength of the motion signal for the two stimulus forms, we modeled MT responses as large versus small for 100%-contrast patches of dots versus 12%-contrast gratings, with the recognition that future data from MT might require a change in this assumption.
Because the gain-control pathway appears to emanate from the FEFSEM (Tanaka and Lisberger, 2001; Nuding et al., 2009), we implemented control of the gain of visual-motor transmission through a network of model FEFSEM units. To be consistent with the responses of FEFSEM neurons, our model units are direction selective but not speed tuned (Tanaka and Lisberger, 2002a); speed priors emerge from the speed specificity of the output connection of each model FEFSEM unit. We have instantiated gain control in a set of “multiplier” neurons that retain a representation of target motion in retinal coordinates. Then, we extracted an estimate of target speed and direction to guide pursuit by population decoding from the activity of the multiplier units. Equations for the model appear in Materials and Methods.
The model uses divisive normalization in the FEFSEM to create competition between a speed and direction tuned input from the model of area MT and a tuned prior created by recurrent connections within the model FEFSEM network (Verstynen and Sabes, 2011). If the MT inputs are stronger than the prior, then the tuning of the output from the model FEFSEM network is the same as that from the model MT network; the population response in the model multiplier network will peak at the same speed and direction as the model MT network, and pursuit will follow the sensory data reliably. If the prior is stronger than the MT inputs, then the output from the model's FEFSEM network will be biased toward the prior along the direction and speed axes. As a result, the center of mass of the population response in the model multiplier neurons will be attracted toward the direction and speed of the priors, and pursuit will show systematic biases. The recurrent connection approach in the FEFSEM is appealing because it creates a model that works and because it can learn priors through Hebbian mechanisms (Verstynen and Sabes, 2011). However, there certainly are other neural circuit mechanisms that could lead to a representation of priors in the output from the FEFSEM.
We set the speed before favor lower speeds and the direction prior for the narrow context to attract the estimate of target direction toward rightward target motion (0°). Then, we tested the model by simulating target motion in the directions 0, 5, 10, and 15°. We repeated each target motion 1000 times and formed probability distribution functions for estimated target speed and direction, for comparison with the same functions based on the data from monkeys.
The model responded to the interaction of motion strength and prior in the same way as we found in the pursuit of our monkeys. In the speed domain (Fig. 6A,B), the model (dashed traces) did a good but imperfect job of reproducing the distributions of eye speed (continuous traces) in our two monkeys. It captured the nearly perfect estimate of target speed for the strong motion signals used to simulate motion of the 100%-contrast patch of dots (red traces), and the bias toward lower speeds for the weaker motion signals used to simulate motion of the 12%-contrast gratings (black traces). It also captured the width of the distributions of target speed for both stimulus forms. However, a model based entirely on Gaussian tuning functions and an exponential function of recurrent weights along the speed axis in the model FEFSEM captured imperfectly the non-Gaussian shape of the speed distribution from monkey U for the 12%-contrast gratings (Fig. 6A, black traces).
In the direction domain, the model again simulated the basic features of the data for the narrow context. Plotting the performance of the model alone (Fig. 6C) shows that the distributions of estimates of target direction were wider for the simulated 12%-contrast grating (black curves) than for the simulated 100%-contrast patch of dots (red curves). For the strong motion signals used to simulate the MT responses to motion of the 100%-contrast patch of dots, the model produced distributions of direction estimates that were centered very close to target direction. For the weak motion signals used to simulate the MT responses to motion of the 12%-contrast gratings, the simulated estimates of direction were biased toward the 0° direction of the prior. Figure 6C shows that simulated distributions agree well with the data from monkey U for the narrow direction context. The direction distributions from monkey J were very similar to those for monkey U, and the model agreed well with them, also. We do not show the comparison of simulations and data for the uniform context, but the design of the network model guarantees that the simulations will lack direction bias and also will match the speed data well.
The model outlined in Figure 6 had three free parameters, defined in Equations 2 and 3 to create the recurrent weights that determine the details of the model's speed and direction priors. Changes in those parameters or in the functions used to create the recurrent weights would change the priors in detail. Thus, the details of model performance could be adjusted by using different functions to create the recurrent weights. However, the general performance of the model would persist, and would reproduce at least the qualitative features of our data. Thus, we wish to emphasize the demonstration that priors emerge in pursuit from a model based on modulation of the gain of visual-motor transmission.
We realize that many of the parameters in our model are not based on biological measurements, and that future experiments will probably alter the model substantially. First, the amplitude of the population response is a free parameter that was set to 1 or 10 to simulate the MT population response for 12%-contrast gratings versus 100%-contrast patch stimuli. Future recordings may force us to change this assumption, perhaps qualitatively. Second, for one of the monkeys, we used a model MT population response with somewhat wider speed tuning than found in our data or that of others (Nover et al., 2005). Decreasing the speed tuning width blunted the effect of the priors slightly and narrowed the distributions of estimates of target speed; the fits were not quite as pretty, but the Bayesian-like performance of the model persisted. Third, the use of recurrent connections to create priors in the model FEFSEM created strong neuron-neuron correlations between model neurons with similar preferred stimuli. The finding of weaker neuron-neuron correlations in the brain's FEFSEM (Schoppik et al., 2008) calls into question the specific mechanism we have used to create priors. Still, it is worth remembering for future experiments a prediction made by the model: larger neuron-neuron correlations in the FEFSEM for the 12%-contrast gratings versus 100%-contrast patches of dots. Perhaps the recurrent connection mechanism should not be taken as literally as our demonstration that priors could emerge from modulation of the gain of visual-motor transmission through the FEFSEM.
Finally, our model makes testable predictions. It predicts that the population response in the FEFSEM should depend on whether the moving stimulus is a 12%-contrast grating or a 100%-contrast patch of dots, and on whether the experimental design comprises the narrow- or uniform-direction prior. The response of an individual neuron in the FEFSEM should depend on the stimulus form in a way that is determined by the neuron's preferred speed and direction, relative to target speed and direction. As mentioned above, the model also makes testable predictions about the effects of stimulus form on neuron-neuron correlations in the FEFSEM. We are happy to share the detailed predictions with interested readers.
Accounting for pursuit behavior with a Bayesian model
Our data suggest that the initiation of pursuit operates in a Bayesian framework. A Bayesian model would estimate the true visual stimulus by using an ideal observer to evaluate a posterior probability distribution that is formed as the product of a likelihood distribution and a prior probability distribution. The likelihood distribution comes from the sensory evidence of the target velocity and the prior probability distribution is determined by the past history of target motions. For each individual trial, the ideal observer selects the most likely value of target velocity from the posterior probability distribution. In our experiments, we presented the same stimulus many times and assessed the distribution of eye speed and direction. We assume that the motor system tracks its sensory inputs perfectly, so that the eye speed and direction at the end of pursuit initiation report the sensory estimates of target motion on that trial (Osborne et al., 2005; Medina and Lisberger, 2007). Thus, the distribution of the eye velocities we measured across repetitions of the same target motion reports the estimates that should be provided by repeating Bayesian inference many times to estimate target motion from multiple repetitions of the same stimulus. In this formulation, the variation in the Bayesian estimates comes from trial-by-trial variation in the likelihood distribution, although in principle variation in the estimates also could arise from trial-by-trial variation of the prior.
We modeled the likelihood distributions as Gaussian functions of direction and speed centered at the actual target direction and speed, and the prior distribution as Gaussian functions of direction and speed with centers at 0 deg/s in speed and 0° in direction. For direction, we used either uniform or narrow prior probability distributions to match the contexts provided by the blend of target motions in our experiments. For speed, we always used a prior biased toward zero speed. We used only the positive half of the speed prior, so that the function was very similar to the exponential prior used by Stocker and Simoncelli (2006). We created noisy likelihood distributions for each the two stimulus forms and adjusted the bandwidth of each Gaussian distribution to allow Bayesian estimation to provide the best fit to the posterior distributions implied by our data.
For both speed (Fig. 7A,B) and direction (Fig. 7D), we found priors and likelihood functions that yielded excellent agreement between the probability distribution of the Bayesian estimator (dashed lines) and the data. We used the same likelihood functions to reproduce the distributions of eye speed and direction in the uniform and narrow contexts: because it was trivial to reproduce the data from the uniform context we have not shown it in Figure 7. In truth, it is not surprising that we were able to fit our data with a Bayesian model. We include the analysis here because it was deemed “essential” by an anonymous reviewer of a prior version of the paper.
Figure 7.

Comparison of pursuit performance at the initiation of pursuit and the predictions of a Bayesian model. A, B, Eye speed for monkeys U and J. D, Eye direction for monkey U. In A, B, and D, black and red traces show results for 12%-contrast gratings versus 100%-contrast patches of dots. Dashed versus continuous curves show predictions of the Bayesian model versus the actual data. C, Likelihood and prior probabilities used to obtain the Bayesian predictions in A and B. In C, dashed versus continuous curves show model features for monkeys J and U. Red, black, and blue curves show likelihood functions for patches, likelihood functions for gratings, and prior probabilities.
For the Bayesian prediction of eye speed, we used nearly identical likelihood distributions for monkeys U and J (Fig. 7C, red and black curves), in keeping with our expectation that the likelihood distributions are tightly related to the population responses in MT. We used SDs of 2.29 and 2.41 deg/s for the 12%-contrast grating, and 1.05 and 0.77 deg/s for the 100%-contrast patch. The prior probability distributions differed for the two monkeys with SDs of 4.65 deg/s (U) and 2.91 (J) (Fig. 7C, blue curves), but were identical across stimulus forms within each monkey. For the direction analysis, the data were nearly identical in the two monkeys. Therefore, the Bayesian model was tested only for monkey U; the SDs of the likelihood functions were 8.4 and 3.2° for the 12%-contrast grating and the 100%-contrast patch. The SD of the prior probability was 12° for the narrow prior and very large for the uniform prior.
Discussion
The present paper places the initiation of pursuit in a realistic context that is closely aligned with current concepts of motor planning and perception (Weiss et al., 2002; Körding and Wolpert, 2004; Körding et al., 2004; Knill, 2007; Verstynen and Sabes, 2011). The visual signals from a moving object, instead of simply driving a reflexive smooth eye movement, alter the gain of visual-motor transmission so that pursuit behaves as if driven by the product of a sensory likelihood function and a prior probability distribution. We have demonstrated two priors: one for zero target speed that agrees with similar priors in speed perception (Weiss et al., 2002; Stocker and Simoncelli, 2006), and a second, independent prior for target direction.
Our paper shows that the initiation of pursuit is consistent with the Bayesian framework that has become a popular metaphor for understanding brain function. It also shows that Bayesian-like behavior emerges from a circuit model for pursuit that is based on a large body of previous work. The model incorporates (and elaborates) (1) MT as the source of sensory data for pursuit (Churchland and Lisberger, 2000; Osborne et al., 2005; Huang and Lisberger, 2009) and (2) modulation of the gain of visual-motor transmission by the FEFSEM (Schwartz and Lisberger, 1994; Tanaka and Lisberger, 2001; Nuding et al., 2009). The model was not designed to perform optimal “Bayesian” estimation, but by developing a representation of priors in the FEFSEM, it emits Bayesian-like behavior as an emergent property.
Implementation of priors and likelihoods in a sensory-motor circuit
In pursuit, the competition between the sensory stimulus and the priors can be understood in terms of modulation of the gain of visual-motor transmission from extrastriate visual area MT (Newsome et al., 1985; Groh et al., 1997; Born et al., 2000) to the motor system. In our model, the priors are implemented by gain modulation at a location that is effectively in the population decoder, downstream from the likelihood function created by the sensory representation of visual motion (Ma et al., 2006; Rao et al., 2012). One feature of our data mitigates strongly in favor of instantiation of the prior downstream from the sensory representation: the parallel changes in the gain and variance of pursuit direction during acquisition of a narrow direction prior.
We understand that the implementation in the brain may look quite different from the equations used in our model. For example, we chose a population decoding computation that finds the preferred speed and directions of the most active neurons in the population because pursuit seems to use this approach to estimate target speed and direction (Churchland and Lisberger, 2001). Many implementations are possible (Groh, 2001; Jazayeri and Movshon, 2006; Chaisanguanthum and Lisberger, 2011). Our use of recurrent connections in the FEFSEM as the mediator of priors (Verstynen and Sabes, 2011) is convenient and works, but is not supported (or contradicted) by the experimental literature. Finally, the prior need not arise in the FEFSEM. It also could arise in the supplementary eye fields, area LIP, and/or unknown pursuit areas of the cerebral cortex. Indeed, we expect other network models to have the same performance as ours, as long as they retain two key features: (1) a sensory origin for motor noise and (2) prior instantiation through downstream gain modulation.
What is optimized by the priors in pursuit?
It is common to think of priors as a means of optimizing performance. We think that the relationship between variance and gain in our data provides a clue about what is optimized in pursuit initiation. We assume that the sensory representation of a moving 100%-contrast patch of dots probably provides strong, low-noise signals, while the representation of a moving 12%-contrast grating is weaker and noisier. Given that variation in the initiation of pursuit seems to be caused mainly by noise in sensory processing (Osborne et al., 2005; Medina and Lisberger, 2007; Schoppik et al., 2008; Huang and Lisberger, 2009), it follows that the endpoint noise for pursuit of a moving 12%-contrast grating is at risk for rather high variance. We propose that the brain regulates the gain of visual-motor transmission as a way of using the principle of “signal-dependent noise” to damp motor variation.
Reduction of motor variance through gain control has the adverse side effect of reducing the eye speed and/or biasing direction behavior during the initiation of pursuit. This prolongs the time until eye velocity reaches target velocity. We imagine that this tradeoff is optimal for overall performance, although we do not have access to the cost function that would quantify optimal behavior.
Priors create features of pursuit initiation not found in visual motion signals
The initiation of pursuit is controlled by a competition between the prior and the sensory estimate of target speed, and need not move in lock-step with either. The existence of priors for pursuit initiation requires some pullback from our prior assumption that the properties of the initiation of pursuit are a direct probe for features of visual motion processing. Instead, we now can understand some paradoxical mismatches in the existing literature between the representation of visual motion and the features of pursuit.
Our interpretation that pursuit uses a prior for zero target speed resolves a problem raised by Krekelberg et al. (2006). They showed that changes in stimulus contrast change the tuning curves of MT neurons such that the population response for low-contrast gratings of a given speed tends to be shifted toward neurons defined by higher preferred speeds; the resulting estimate of target speed should be too high. Yet, low-contrast gratings evoke slower pursuit initiation (Priebe and Lisberger, 2004; Spering et al., 2005; present paper). A Bayesian prior of zero speed offers an explanation: it would drag the estimate of target speed toward zero for the weak/noisy motion signals provided by low-contrast targets, even if the population response in MT has shifted toward higher preferred speeds. The prior for zero speed also might explain the reduction in the strength of pursuit initiation for the weak/noisy motion signals provided by isoluminant chromatic stimuli (Braun et al., 2008).
The existence of directional priors in pursuit might explain directional anisotropies in pursuit, as well as those in perception and some discrepancies across the literature. Directional anisotropies in perception have been called the “oblique effect” (Ball and Sekuler, 1980; Gros et al., 1998). Krukowski and Stone (2005) reported that pursuit and perception have similar directional anisotropies, whereas Churchland et al. (2003) found much smaller directional anisotropies in the initiation of pursuit than previously reported in perception. These two studies used similar target forms, so we presume that the differences in the pursuit anisotropy may lie in the strengths of the subjects' priors. If priors are the cause of anisotropies, then it would be easy to understand how different studies could show different anisotropies. If pursuit and perception implement priors through different neural mechanisms, then we also can understand how different behavioral endpoints may show different anisotropies. Recordings from area MT have failed to reveal a sensory cause for direction anisotropies in pursuit (Churchland et al., 2003), suggesting that priors are implemented downstream from MT for both perception and action (Krukowski and Stone, 2005; Rao et al., 2012).
Broader implications
The Bayesian framework unifies our data with a large body of previous data on perception and action driven by visual motion. The formalism of Bayesian behavior is characterized by a series of precise equations that depend on the probability distributions of “likelihood” and “prior.” Ma et al. (2006) made a persuasive case that neural population responses represent the likelihood probabilities that contribute to Bayesian estimation. We agree with this assessment, and with Weiss et al. (2002) that the population responses in area MT for 12%-contrast gratings and 100%-contrast patches of dots will fit this characterization. Fetsch et al. (2011) showed that a subset of neurons in area MST combine the sensory inputs from two different sensory modalities according to the rules of Bayesian estimation, in agreement with the predictions of Ma et al. (2006). Our work, however, addresses a quite different problem, namely implementation of internal priors and their competition with the sensory likelihood.
We agree with many that Bayesian behavior is a natural mode of operation for the brain. However, we do not think that the brain needs to have circuit that implement Bayes' equations explicitly. Instead, we suggest that Bayesian-like behavior may be implemented with the circuits that mediate a given behavior. Thus, our neural network simulation starts from a neural circuit organization that exists to drive pursuit eye movements (Lisberger, 2010), and the behavior described by the standard Bayesian equations emerges seamlessly. We are suggesting that pursuit's priors for target speed and direction are created within the framework of pursuit's essential circuit. If this is true for all behaviors, and if priors are implemented downstream from the sensory representation (Rao et al., 2012), then each behavioral endpoint might implement Bayesian behavior through its own neural mechanism. The broad neural mechanism might be similar for different actions and different perceptions, but perception and action more generally could employ different neural mechanisms for prior formation. It would still be plausible for perception and action to exhibit similar priors (i.e., zero speed) because they are responding to the same external influences.
Footnotes
Research was supported by the Howard Hughes Medical Institute and NIH Grant EY03878. We thank Philip Sabes for commenting on an earlier version of the paper, and Tony Movshon, Miriam Spering, Jeff Beck, and Carlos Brody for helpful conversations and advice. We are grateful to Karen MacLeod, Elizabeth Montgomery, Stefanie Tokiyama, Scott Ruffner, Dirk Kleinhesselink, David Wolfgang-Kimball, Ken McGary, and Darrell Floyd for technical assistance.
References
- Ball K, Sekuler R. Models of stimulus uncertainty in motion perception. Psychol Rev. 1980;87:435–469. [PubMed] [Google Scholar]
- Born RT, Groh JM, Zhao R, Lukasewycz SJ. Segregation of object and background motion in visual area MT: effects of microstimulation on eye movements. Neuron. 2000;26:725–734. doi: 10.1016/s0896-6273(00)81208-8. [DOI] [PubMed] [Google Scholar]
- Braun DI, Mennie N, Rasche C, Schütz AC, Hawken MJ, Gegenfurtner KR. Smooth pursuit eye movements to isoluminant targets. J Neurophysiol. 2008;100:1287–1300. doi: 10.1152/jn.00747.2007. [DOI] [PubMed] [Google Scholar]
- Chaisanguanthum KS, Lisberger SG. A neurally efficient implementation of sensory population decoding. J Neurosci. 2011;31:4868–4877. doi: 10.1523/JNEUROSCI.6776-10.2011. [DOI] [PMC free article] [PubMed] [Google Scholar]
- Churchland AK, Gardner JL, Chou I, Priebe NJ, Lisberger SG. Directional anisotropies reveal a functional segregation of visual motion processing for perception and action. Neuron. 2003;37:1001–1011. doi: 10.1016/s0896-6273(03)00145-4. [DOI] [PubMed] [Google Scholar]
- Churchland MM, Lisberger SG. Apparent motion produces multiple deficits in visually-guided smooth pursuit eye movements of monkeys. J Neurophysiol. 2000;84:216–235. doi: 10.1152/jn.2000.84.1.216. [DOI] [PMC free article] [PubMed] [Google Scholar]
- Churchland MM, Lisberger SG. Shifts in the population response in the middle temporal visual area parallel perceptual and motor illusions produced by apparent motion. J Neurosci. 2001;21:9387–9402. doi: 10.1523/JNEUROSCI.21-23-09387.2001. [DOI] [PMC free article] [PubMed] [Google Scholar]
- Deneve S, Latham PE, Pouget A. Reading population codes: a neural implementation of ideal observers. Nat Neurosci. 1999;2:740–745. doi: 10.1038/11205. [DOI] [PubMed] [Google Scholar]
- Fetsch CR, Pouget A, DeAngelis GC, Angelaki DE. Neural correlates of reliability based cue weighting during multisensory integration. Nat Neurosci. 2011;15:146–154. doi: 10.1038/nn.2983. [DOI] [PMC free article] [PubMed] [Google Scholar]
- Grasse KL, Lisberger SG. Analysis of a naturally occurring asymmetry in vertical smooth pursuit eye movements in a monkey. J Neurophysiol. 1992;167:164–179. doi: 10.1152/jn.1992.67.1.164. [DOI] [PubMed] [Google Scholar]
- Groh JM. Converting neural signals from place codes to rate codes. Biol Cybern. 2001;85:159–165. doi: 10.1007/s004220100249. [DOI] [PubMed] [Google Scholar]
- Groh JM, Born RT, Newsome WT. How is a sensory map read out? Effects of microstimulation in visual area MT on saccades and smooth pursuit eye movements. J Neurosci. 1997;17:4312–4330. doi: 10.1523/JNEUROSCI.17-11-04312.1997. [DOI] [PMC free article] [PubMed] [Google Scholar]
- Gros BL, Blake R, Hiris E. Anisotropies in visual motion perception: a fresh look. J Opt Soc Am A Opt Image Sci Vis. 1998;15:2003–2011. doi: 10.1364/josaa.15.002003. [DOI] [PubMed] [Google Scholar]
- Harris CM, Wolpert DM. Signal-dependent noise determines motor planning. Nature. 1998;394:780–784. doi: 10.1038/29528. [DOI] [PubMed] [Google Scholar]
- Hohl SS, Lisberger SG. Representation of perceptually invisible image motion in extrastriate visual area MT of macaque monkeys. J Neurosci. 2011;31:16561–16569. doi: 10.1523/JNEUROSCI.3166-11.2011. [DOI] [PMC free article] [PubMed] [Google Scholar]
- Huang X, Lisberger SG. Noise correlations in cortical area MT and their potential impact on trial-by-trial variation in the direction and speed of smooth pursuit eye movements. J Neurophysiol. 2009;101:3012–3030. doi: 10.1152/jn.00010.2009. [DOI] [PMC free article] [PubMed] [Google Scholar]
- Jazayeri M, Movshon JA. Optimal representation of sensory information by neural populations. Nat Neurosci. 2006;9:690–696. doi: 10.1038/nn1691. [DOI] [PubMed] [Google Scholar]
- Knill DC. Robust cue integration: a Bayesian model and evidence from cue-conflict studies with stereoscopic and figure cues to slant. J Vis. 2007;7:5.1–5.24. doi: 10.1167/7.7.5. [DOI] [PubMed] [Google Scholar]
- Körding KP, Wolpert DM. Bayesian integration in sensorimotor learning. Nature. 2004;427:244–247. doi: 10.1038/nature02169. [DOI] [PubMed] [Google Scholar]
- Körding KP, Ku SP, Wolpert DM. Bayesian integration in force estimation. J Neurophysiol. 2004;92:3161–3165. doi: 10.1152/jn.00275.2004. [DOI] [PubMed] [Google Scholar]
- Krekelberg B, van Wezel RJ, Albright TD. Interactions between speed and contrast tuning in the middle temporal area: implications for the neural code for speed. J Neurosci. 2006;26:8988–8998. doi: 10.1523/JNEUROSCI.1983-06.2006. [DOI] [PMC free article] [PubMed] [Google Scholar]
- Krukowski AE, Stone LS. Expansion of direction space around the cardinal axes revealed by smooth pursuit eye movements. Neuron. 2005;20:315–323. doi: 10.1016/j.neuron.2005.01.005. [DOI] [PubMed] [Google Scholar]
- Lisberger SG. Smooth pursuit eye movements: sensation, action, and what happens in between. Neuron. 2010;66:477–491. doi: 10.1016/j.neuron.2010.03.027. [DOI] [PMC free article] [PubMed] [Google Scholar]
- Lisberger SG, Westbrook LE. Properties of visual inputs that initiate horizontal smooth pursuit eye movements in monkeys. J Neurosci. 1985;5:1662–1673. doi: 10.1523/JNEUROSCI.05-06-01662.1985. [DOI] [PMC free article] [PubMed] [Google Scholar]
- Ma WJ, Beck JM, Latham PE, Pouget A. Bayesian inference with probabilistic population codes. Nat Neurosci. 2006;9:1432–1438. doi: 10.1038/nn1790. [DOI] [PubMed] [Google Scholar]
- Medina JF, Lisberger SG. Variation, signal, and noise in cerebellar sensory-motor processing for smooth pursuit eye movements. J Neurosci. 2007;27:6832–6842. doi: 10.1523/JNEUROSCI.1323-07.2007. [DOI] [PMC free article] [PubMed] [Google Scholar]
- Missal M, Heinen SJ. Facilitation of smooth pursuit initiation by electrical stimulation in the supplementary eye fields. J Neurophysiol. 2001;86:2413–2425. doi: 10.1152/jn.2001.86.5.2413. [DOI] [PubMed] [Google Scholar]
- Movshon JA, Adelson EH, Gizzi MS, Newsome WT. The analysis of moving visual patterns. In: Chagas C, Gattass R, Gross C, editors. Pattern recognition mechanisms. Vol. 54. Rome: Vatican; 1985. pp. 117–151. Pontificiae Academiae Scientiarum Scripta Varia. [Google Scholar]
- Newsome WT, Wurtz RH, Dürsteler MR, Mikami A. Deficits in visual motion processing following ibotenic acid lesions of the middle temporal visual area of the macaque monkey. J Neurosci. 1985;5:825–840. doi: 10.1523/JNEUROSCI.05-03-00825.1985. [DOI] [PMC free article] [PubMed] [Google Scholar]
- Nover H, Anderson CH, DeAngelis GC. A logarithmic, scale-invariant representation of speed in macaque middle temporal area accounts for speed discrimination performance. J Neurosci. 2005;25:10049–10060. doi: 10.1523/JNEUROSCI.1661-05.2005. [DOI] [PMC free article] [PubMed] [Google Scholar]
- Nuding U, Ono S, Mustari MJ, Büttner U, Glasauer S. A theory of the dual pathways for smooth pursuit based on dynamic gain control. J Neurophysiol. 2008;99:2798–2808. doi: 10.1152/jn.90237.2008. [DOI] [PMC free article] [PubMed] [Google Scholar]
- Nuding U, Kalla R, Muggleton NG, Büttner U, Walsh V, Glasauer S. TMS evidence for smooth pursuit gain control by the frontal eye fields. Cereb Cortex. 2009;19:1144–1150. doi: 10.1093/cercor/bhn162. [DOI] [PubMed] [Google Scholar]
- Osborne LC, Lisberger SG, Bialek W. A sensory source for motor variation. Nature. 2005;437:412–416. doi: 10.1038/nature03961. [DOI] [PMC free article] [PubMed] [Google Scholar]
- Osborne LC, Hohl SS, Bialek W, Lisberger SG. Time course of precision in smooth-pursuit eye movements of monkeys. J Neurosci, 2007;27:2987–2998. doi: 10.1523/JNEUROSCI.5072-06.2007. [DOI] [PMC free article] [PubMed] [Google Scholar]
- Priebe NJ, Lisberger SG. Estimating target speed from the population response in visual area MT. J Neurosci. 2004;24:1907–1916. doi: 10.1523/JNEUROSCI.4233-03.2004. [DOI] [PMC free article] [PubMed] [Google Scholar]
- Ramachandran R, Lisberger SG. Normal performance and expression of learning in the vestibulo-ocular reflex (VOR) at high frequencies. J Neurophysiol. 2005;93:2028–2038. doi: 10.1152/jn.00832.2004. [DOI] [PMC free article] [PubMed] [Google Scholar]
- Rao V, DeAngelis GC, Snyder LH. Neural correlates of prior expectations of motion in the lateral intraparietal and middle temporal areas. J Neurosci. 2012;32:10063–10074. doi: 10.1523/JNEUROSCI.5948-11.2012. [DOI] [PMC free article] [PubMed] [Google Scholar]
- Salinas E, Abbott LF. Vector reconstruction from firing rates. J Comput Neurosci. 1994;1:89–107. doi: 10.1007/BF00962720. [DOI] [PubMed] [Google Scholar]
- Schoppik D, Nagel KI, Lisberger SG. Cortical mechanisms of smooth eye movements revealed by dynamic covariations of neural and behavioral responses. Neuron. 2008;58:248–260. doi: 10.1016/j.neuron.2008.02.015. [DOI] [PMC free article] [PubMed] [Google Scholar]
- Schwartz JD, Lisberger SG. Modulation of the level of smooth pursuit activation by initial tracking conditions in monkeys. Vis Neurosci. 1994;11:411–424. doi: 10.1017/s0952523800002352. [DOI] [PubMed] [Google Scholar]
- Spering M, Kerzel D, Braun DI, Hawken MJ, Gegenfurtner KR. Effects of contrast on smooth pursuit eye movements. J Vis. 2005;5:455–465. doi: 10.1167/5.5.6. [DOI] [PubMed] [Google Scholar]
- Stocker AA, Simoncelli EP. Noise characteristics and prior expectations in human visual speed perception. Nat Neurosci. 2006;9:578–585. doi: 10.1038/nn1669. [DOI] [PubMed] [Google Scholar]
- Tanaka M, Lisberger SG. Regulation of the gain of visually-guided smooth pursuit eye movements by frontal cortex. Nature. 2001;409:191–194. doi: 10.1038/35051582. [DOI] [PubMed] [Google Scholar]
- Tanaka M, Lisberger SG. Enhancement of multiple components of smooth pursuit eye movement by microstimulation in the arcuate frontal pursuit area in monkeys. J Neurophysiol. 2002a;87:802–818. doi: 10.1152/jn.00409.2001. [DOI] [PMC free article] [PubMed] [Google Scholar]
- Tanaka M, Lisberger SG. Role of arcuate frontal pursuit area of monkeys in smooth pursuit eye movements. I. Basic response properties to retinal image motion and position. J Neurophysiol. 2002b;87:2684–2699. doi: 10.1152/jn.2002.87.6.2684. [DOI] [PMC free article] [PubMed] [Google Scholar]
- Verstynen T, Sabes PN. How each movement changes the next: an experimental and theoretical study of fast adaptive priors in reaching. J Neurosci. 2011;31:10050–10059. doi: 10.1523/JNEUROSCI.6525-10.2011. [DOI] [PMC free article] [PubMed] [Google Scholar]
- Weiss Y, Simoncelli EP, Adelson EH. Motion illusions as optimal percepts. Nat Neurosci. 2002;5:598–604. doi: 10.1038/nn0602-858. [DOI] [PubMed] [Google Scholar]
- Wells SG, Barnes GR. Fast, anticipatory smooth-pursuit eye movements appear to depend on a short-term store. Exp Brain Res. 1998;120:129–133. doi: 10.1007/s002210050385. [DOI] [PubMed] [Google Scholar]