

Abstract
The developmentally regulated myelin basic proteins (MBPs), which arise from the golli (gene of oligodendrocyte lineage) complex, are highly positively charged, intrinsically disordered, multifunctional proteins having several alternatively spliced isoforms and posttranslational modifications, and they play key roles in myelin compaction. The classic 18.5-kDa MBP isoform has a proline-rich region comprising amino acids 92–99 (murine sequence –T92PRTPPPS99–) that contains a minimal SH3 ligand domain. We have previously shown that 18.5-kDa MBP binds to several SH3 domains, including that of Fyn, a member of the Src family of tyrosine kinases involved in a number of signaling pathways during CNS development. To determine the physiological role of this binding as well as the role of phosphorylation of Thr92 and Thr95, in the current study we have produced several MBP variants specifically targeting phosphorylation sites and key structural regions of MBP’s SH3 ligand domain. Using isothermal titration calorimetry, we have demonstrated that, compared with the wild-type protein, these variants have lower affinity for the SH3 domain of Fyn. Moreover, overexpression of N-terminal-tagged GFP versions in immortalized oligodendroglial N19 and N20.1 cell cultures results in aberrant elongation of membrane processes and increased branching complexity and inhibits the ability of MBP to decrease Ca2+ influx. Phosphorylation of Thr92 can also cause MBP to traffic to the nucleus, where it may participate in additional protein–protein interactions. Coexpression of MBP with a constitutively active form of Fyn kinase resulted in membrane process elaboration, a phenomenon that was abolished by point amino acid substitutions in MBP’s SH3 ligand domain. These results suggest that MBP’s SH3 ligand domain plays a key role in intracellular protein interactions in vivo and may be required for proper membrane elaboration of developing oligodendrocytes and, further, that phosphorylation of Thr92 and Thr95 can regulate this function.
Keywords: myelin basic protein (MBP), Fyn, SH3 domain, oligodendrocytes, isothermal titration calorimetry, calcium imaging, myelination
Oligodendrocytes are specialized glial cells of the central nervous system (CNS) that develop from precursor cells and migrate throughout the spinal cord and regions of the brain during mammalian development (Bradl and Lassmann, 2010; Miron et al., 2011). They extend cellular processes that form a multilamellar insulating sheath around developing axons (Bunge et al., 1962; Bunge, 1968; Baumann and Pham-Dinh, 2001). The CNS myelin contains many essential proteins that facilitate the structure, function, and compaction of myelin, including the developmentally regulated myelin basic proteins (MBPs), which arise from the golli (gene of oligodendrocyte lineage) complex (Campagnoni et al., 1993; Pribyl et al., 1993; Givogri et al., 2001; Jacobs et al., 2009; Fulton et al., 2010a). Although the basic proteins play a key role in myelin compaction, they are also highly positively charged, intrinsically disordered proteins having numerous alternatively spliced isoforms and combinatorial posttranslational modifications such as deimination and phosphorylation. They also have a proline-rich region comprising amino acids T92–S99 (murine sequence relative to 18.5-kDa isoform) –T92PRTPPPS99–, which contains an SH3 ligand motif (Polverini et al., 2008). These properties facilitate and regulate a variety of biological interactions with proteins such as actin, tubulin, calmodulin, and SH3 domain proteins (for review see Harauz et al., 2004, 2009; Boggs, 2006, 2008; Harauz and Libich, 2009).
Our group has extensively utilized recombinant hexahistidine-tagged versions of “classical” murine MBP isoforms, such as rmMBP-C1, which emulates the predominant, minimally modified 18.5-kDa C1 component of healthy myelin (Bates et al., 2000), and 21.5-kDa MBP (Hill et al., 2005; Hill and Harauz, 2005), which is expressed earlier in development than the 18.5-kDa isoform. Utilizing purified recombinant MBPs (rmMBPs) for in vitro studies has provided insight into MBP’s multifunctionality and its interactions with actin, tubulin, Ca2+-calmodulin, and SH3 domains (Boggs et al., 2005, 2011; Hill et al., 2005; Hill and Harauz, 2005; Libich and Harauz, 2008; Polverini et al., 2008; Homchaudhuri et al., 2009; Ahmed et al., 2009; Bamm et al., 2010). Moreover, we have constructed green and red fluorescent protein-tagged (GFP- and RFP-tagged) and untagged versions of the 18.5- and 21.5-kDa classical MBP isoforms for cell transfection and investigation of MBP’s multifunctionality in cultured oligodendroglial cells (Smith et al., 2010). We have shown that these MBP isoforms decreased Ca2+ influx through voltage-operated Ca2+ channels (VOCC) in cultured N19 immortalized oligodendroglial cells (OLGs) and primary oligodendroglial progenitor cells (OPCs; Smith et al., 2011), suggesting that classical MBP plays an important role in calcium homeostasis. We have also shown increased co-localization of MBP with actin, tubulin, the SH3-domain-containing actin-remodeling protein cortactin, and the SH3-domain-containing junctional protein ZO-1, during membrane remodeling in N19-OLGs (Smith et al., 2010). For the present study, we generated further variants to examine the role of the highly conserved central segment that encompasses the putative SH3 ligand (Polverini et al., 2008, 2011; Homchaudhuri et al., 2009).
Studies using recombinant murine MBP (rmMBP; Bates et al., 2000, 2002) have assessed the structural and binding properties of MBP to SH3 domains using circular dichroic spectroscopy and dot-blot microarray analyses, respectively (Polverini et al., 2008; Harauz and Libich, 2009; Homchaudhuri et al., 2009). Under physiological conditions, this region forms a poly-proline type II (PPII) conformation in vitro, and MBP bound a number of SH3 domains on a microarray, including that of Fyn (Polverini et al., 2008; Harauz and Libich, 2009). These studies also demonstrated that the PPII conformation in aqueous solution is stabilized by the phosphorylation of Thr92 and Thr95 (murine 18.5-kDa isoform sequence numbering, omitting the N-terminal methionine, which is cleaved), present within and/or adjacent to the helix. Moreover, MBP was shown to bind the Fyn-SH3 domain to lipid vesicles, and in vitro phosphorylation of MBP at Thr92 and/or Thr95 decreased this binding (Homchaudhuri et al., 2009). Molecular dynamics simulations indicate also that phosphorylation at these sites can alter the local conformation of the protein and the degree of penetration of the central membrane-anchoring segment into a lipid bilayer (Polverini et al., 2011). We have thus proposed that this region of the protein constitutes an important molecular switch (Harauz et al., 2009; Harauz and Libich, 2009; Bessonov et al., 2010; Polverini et al., 2011).
Fyn is a member of the Src family of tyrosine protein-specific kinases that is localized primarily to the cytoplasmic leaflet of the OLG plasma membrane, where it can participate in a variety of different signaling pathways via integrins and Ras activation during CNS development (Manié et al., 1997; Resh, 1998) and plays an important role in OLG differentiation and myelination (for review see Krämer-Albers and White, 2011). Mouse knockouts for Fyn have shown significant MBP mRNA attenuation during the most active period of myelinogenesis (P13 and P20), resulting in hypomyelination (Biffiger et al., 2000; Lu et al., 2005). Fyn has been postulated to be a key regulatory element of the myelination process that triggers phosphorylation of hnRNPA2 (heterogeneous nuclear ribonucleoprotein A2), responsible for efficient transport of MBP mRNA to the site of glial–neuronal contact in developing OLGs (Seiwa et al., 2000, 2007; Laursen et al., 2011). Additional studies examining Fyn homologues, such as Src, have shown that members of this kinase family are involved in diverse cellular functions, including adhesion and calcium flux (Laursen et al., 2009).
In this current study, we provide further evidence for the interaction of the SH3 ligand of MBP with the Fyn-SH3 domain, utilizing site-directed SH3 ligand-substituted versions of rmMBP-C1 and biophysical approaches. We also provide evidence for a physiological role of MBP’s SH3 ligand domain in cultured N19-OLGs. In particular, we have constructed recombinant murine 18.5-kDa MBP variants with Pro-to-Gly substitutions to disrupt the PXXP SH3 ligand motif or with Thr-to-Glu substitutions to mimic phosphorylation of Thr92 and Thr95 (see Fig. 1). Using isothermal titration calorimetry (ITC), we show that these variants have a decreased affinity for the Fyn-SH3 domain. Overexpression of GFP-tagged variants in cultured N19-OLGs produced aberrant elongation of membrane processes, increased branching complexity, and in some cases caused the 18.5-kDa MBP isoform to traffic to the nucleus. Furthermore, these substitutions to the SH3 ligand domain inhibited the ability of MBP to decrease L-type VOCC-mediated calcium influx. Coexpression of MBP with a constitutively active form of Fyn kinase caused a remarkable increase in elaboration of membrane processes and stimulated development of N19-OLGs. Substitutions of the SH3 ligand domain of MBP prevented this effect, indicating that interaction of MBP with an SH3 domain protein, most likely Fyn, is responsible for this effect. These results suggest that MBP’s SH3 ligand domain may play a key role in interactions with signaling proteins such as Fyn at the cytoplasmic surface of the plasma membrane that may be required for membrane elaboration of OLGs.
Fig. 1.

A: Schematic of recombinant 18.5-kDa MBP variants used for isothermal titration calorimetry. B: Schematic of the MBP-C1 and SH3 ligand mutagenic constructs produced for immortalized N19/N20.1-OLG cell culture studies. The GFP has been fused to the N-terminus of MBP, and specific substitutions in MBP are numbered (murine 18.5-kDa sequence), showing the exact sequence position. [Color figure can be viewed in the online issue, which is available at wileyonlinelibrary.com.]
MATERIALS AND METHODS
Plasmid Construction
Previously described plasmids coding for either a GFP-tagged version of unmodified rmMBP-C1 possessing a 3′UTR region (pEGFP-C1-rmMBPC1-UTR) or the protein expression vector (pET22b-rmMBP-C1) were used here as template DNAs, from which the SH3 ligand point-substituted constructs were made (Smith et al., 2010, 2011). Briefly, for in vitro studies, recombinant forms of rmMBP-C1 had point substitutions at specific sites and a C-terminal hexahistidine tag to facilitate purification (Bates et al., 2000, 2002; Hill et al., 2003). For in cellulo work, the MBP variants had GFP fused to the amino terminus, and the plasmid encoded a 3′UTR to facilitate proper trafficking of the MBP mRNA to the cell periphery (Barbarese et al., 1999; Carson et al., 2008; Smith et al., 2011). For construction of the tandem-substituted pEGFP-C1-MBP-T92E,T95E-UTR, the construct pEGFP-C1-MBP-T92E-UTR was used as template DNA for polymerase chain reactions (PCRs) to produce this variant. A list of all mutagenic primers that were used to produce point substitutions for these studies can be found in Table I.
TABLE I.
Primers Used for the Construction of Recombinant 18.5-kDa GFP-MBP-C1-UTR Variant Expression Vectors Used Throughout This Study*
| Primer | Sequence (from 5′ to 3′) |
|---|---|
| ΔT92EFp | cttcaagaacattgtggagcctcgaacaccac |
| ΔT92ERp | gtggtgttcgaggctccacaatgttcttgaag |
| ΔT95EFp | cattgtgacacctcgagagccacctccatcccaagg |
| ΔT95ERp | ccttgggatggaggtggctctcgaggtgtcacaatg |
| ΔT92,95EFp | cattgtggagcctcgagagccacctccatcccaag |
| ΔT92,95ERp | cttgggatggaggtggctctcgaggctccacaatg |
| ΔP93GFp | caagaacattgtgacagggcgaacaccacctccatccc |
| ΔP93GRp | gggatggaggtggtgttcgccctgtcacaatgttcttg |
| ΔP96GFp | gtgacacttcgaacagggcctccatccccaggg |
| ΔP96GRp | ccctggggatggaggccctgttcgaagtgtcac |
All primers were ordered from the University of Guelph Laboratory Services Division.
The PCR amplifications were performed with a Bio-Rad thermal cycler PCR system using Pfu Ultra Polymerase (Stratagene, La Jolla, CA) with the following cycling parameters: initial denaturing temperature of 95°C for 2 min; followed by 16 cycles of 95°C for 30 sec, 56°C for 30 sec, 72°C for 45 sec; followed by a final 4°C hold. For small-scale plasmid DNA extractions, the Roche High Pure Plasmid isolation kit (Roche Diagnostics, Indianapolis, IN) was used, and positive clones were confirmed by sequencing (Laboratory Services Division, University of Guelph). For transfection experiments requiring larger quantities of DNA, the PureLink HiPure Plasmid Purification kit (Invitrogen Life Technologies, Burlington, Ontario, Canada) was used. Other reagents used for these studies were purchased from either Thermo-Fisher Scientific (Unionville, Ontario, Canada) or Sigma-Aldrich (Oakville, Ontario, Canada) unless otherwise stated.
Protein Overexpression and Purification
Plasmids (confirmed by sequencing) encoding wild-type, truncated, or SH3 ligand variant recombinant versions of MBP were transformed into BL21-CodonPlus (DE3)pLysS cells (Stratagene) and were expressed and purified as previously described (Bates et al., 2000, 2002). Throughout these investigations, protein concentrations were quantified by measuring the absorbance at 280 nm. The protein extinction coefficients used were as calculated by SwissProt for protein in 6.0 M guanidine hydrochloride, 0.02 M phosphate, pH 6.5. The value was 0.667 lg−1cm−1 for all full-length recombinant proteins. The extinction coefficients for truncation variants rmMBP-ΔN (M0/D57-R168-LEH6) and rmMBP-ΔC (A1-G105-H6) were 0.864 Lg −1cm−1 and 0.674 Lg−1cm−1, respectively (Hill et al., 2003). Protein preparations were routinely analyzed by sodium dodecyl sulfate-poly-acrylamide gel electrophoresis (SDS-PAGE) and staining with Coomassie brilliant blue R250 (Thermo-Fisher Scientific, Unionville, Ontario, Canada). We used these full-length and truncated variants to study the proline-rich region interactions through isothermal titration calorimetry. The plasmid encoding the Fyn-SH3 domain was a generous gift from Dr. Alan Davidson (Toronto), and the protein was expressed and purified as previously described (Maxwell and Davidson, 1998). In some experiments, the MBP variants were coexpressed with the following Fyn constructs that have been previously described (Cooper et al., 1986; Nada et al., 1991): p59Fyn-K299M (which contains a mutation in its kinase domain, and is therefore completely inactive), p59Fyn wild-type (which can exist in either an active or an inactive state), and p59Fyn-Y527F (a C-terminal point substitution mutant that prevents autoinactivation, thereby allowing the kinase to remain constitutively active).
Isothermal Titration Calorimetry
Isothermal titration calorimetry (ITC) experiments were carried out using a VP-ITC instrument from MicroCal (Northampton, MA). The Fyn-SH3 domain was lyophilized and dissolved in solution (50 mM HEPES-NaOH, pH 7.5, 200 mM NaCl) in the 0.75–1.2 mM concentration range and dialyzed against the same solution (at least two 2-L changes). After the dialysis, the protein solution was filtered (0.22-μm pore size), and the concentration was approximated from the absorbance at 280 nm. The protein extinction coefficient used for Fyn-SH3 domain was 1.982 Lg−1cm−1 (as calculated by SwissProt, for protein in 6.0 M guanidine hydrochloride, 0.02 M phosphate, pH 6.5). All rmMBP variants were dissolved in the same solution prior to the experiment in the concentration range of 0.05–0.09 mM. Samples were degassed in a Thermovac (Northampton, MA) at 29.5°C for 10 min.
The Fyn-SH3 domain solution was injected into the sample cell containing the rmMBP wild-type or variants (rmMBP-C1, rmMBP-ΔN, rmMBP-ΔC, rmMBP-C1-P93G, rmMBP-C1-P96G, rmMBP-C1-T92E, and rmMBP-C1-T95E) in the same solution. The titrations all began with a preliminary injection of 2 μl, followed by 27 (twenty seven) 10-μl injections (in the case of rmC1, rmMBP-ΔN, rmMBP-ΔC) or 55 (fifty five) 5-μl injections in the case of all other full-length rmMBP variants. After each injection, a 5-min period until the next injection allowed the calorimeter to return to baseline thermal signal. A heat of dilution experiment was also recorded, wherein the Fyn-SH3 domain was injected into the ITC cell filled with solution lacking MBP. All titrations were integrated and plotted as a function of the molar ratio in Origin 5.0 (MicroCal).
Cell Culture and Transfection
Cell lines, cell culture, transfection, and live-cell imaging were performed as previously described (Smith et al., 2011). Tissue culture reagents were purchased from Gibco/Invitrogen (Burlington, Ontario, Canada). The FuGene HD transfection reagent was purchased from Roche Diagnostics. The N19 and N20.1 immortalized OLG cell lines (Verity et al., 1993; Foster et al., 1995) were grown in DMEM high-glucose media supplemented with 10% fetal bovine serum (FBS) and 1% penicillin/streptomycin, and cultured in 10-cm plates at 34°C/5% CO2. At 70–80% confluence (4–7 days), cells were detached using 0.25% trypsin for 5 min. Using a haemocytometer, live cells were counted, plated at a density of 0.5 × 10⁶ cells/ml, and grown overnight in preparation for transfection experiments. (For specific nuclear relocalization experiments, live cells were also plated at a density of 1.5 × 10⁶ cells/ml.) On the following day, the cells were transfected using 100 μl serum-free media, 2.0 μg plasmid DNA, and 4 μl FuGene HD (Roche Diagnostics). The DNA was allowed to complex for 5 min at room temperature and was directly added to cells following incubation. Cells were cultured for an additional 48 hr at 34°C prior to treatment, fixation, or immunoprocessing.
Immunofluorescence Microscopy and Image Analyses
After protein expression, cells were directly fixed using 4% formaldehyde solution in phosphate-buffered saline solution (PBS) for 15 min with gentle rocking. Samples requiring immunoprocessing were permeabilized using 0.1% v/v Triton X-100 for 20 min and were subsequently washed once with 1 ml PBS. Slides were blocked for 1 hr using 10% normal goat serum (NGS), and, after this incubation, the primary antibody was added and incubated for an additional 1 hr. The slides were then washed three times with 1 ml PBS, and the secondary antibody (1:400 dilution) was applied for 20 min. Once again, the slides were washed four times with 1 ml PBS and were mounted using ProLong Gold Anti-Fade reagent containing 4′,6-diamidino-2-phenylindole (DAPI; Invitrogen). Slides were viewed with either a Leica epifluorescence microscope (DMRA2) or a multiphoton scanning confocal microscope (Leica DM6000 equipped with a TCS SP5 point scanner). Images were processed and analyzed in ImageJ (National Institutes of Health; http://rsb.info.nih.gov/ij/) and were compiled in Adobe Photoshop CS3.
Statistical Analyses
Several cell phenotypic and morphological traits, including number of processes, total area, longest process length, presence of nuclear signal, and extent of process branching, were measured for N19-OLGs expressing different 18.5-kDa MBP SH3 ligand substitutions. Images were imported into ImageJ, and a mask outlining individual cells was produced. Surface area was calculated as the area within the mask and included processes.
For statistical analysis, a set of 30 transfected N19-OLGs expressing each MBP variant at an average level were selected, and their properties were measured and recorded. All cell morphology measurements were performed in duplicate from two separate experiments performed on different days, producing two sample sets, each examining 30 cells (n = 30) for each variant. A paired t-test (P = 0.05) was used to determine that the duplicate sample sets did not differ significantly. Afterward, the recorded measurements from each duplicate were grouped into a larger sample set of n = 60. The N19-OLGs from each experiment were then compared with one another using an ANOVA table (P = 0.05), and the means of each variant and the SEM for each trait were determined. The difference in means was further analyzed using the Tukey means comparison test (P = 0.05) to determine which variants were significantly different from each other for each trait measured. For the Fura-2 experiments, statistical comparison between different experimental groups was performed by analysis of covariance as previously described (Smith et al., 2011).
Immunoblotting
To obtain sufficient material for immunoblotting, HEK293T cells were used. The HEK293T cell cultures grown on 10-cm plates were transfected with 5 μg plasmid DNA coding for various MBP variants. After 48 hr of expression, cells were harvested in 200 μl passive lytic components (PLC) lysis buffer supplemented with fresh protease inhibitors (50 mM HEPES-NaOH, pH 7.5, 150 mM NaCl, 10% glycerol, 1% Triton X-100, 1.5 mM MgCl2, 1 mM EGTA, 10 mM sodium pyrophosphate, 100 mM sodium fluoride, with 1 mM sodium orthovanadate, 1 mM phenylmethylsulfonyl fluoride, 10 μg/ml aprotinin, and 10 μg/ml leupeptin added immediately prior to use). From each transfection, crude lysate was microfuged for 10 min at 13,000 rpm, and the supernatant was mixed 1:1 with 2 × SDS buffer, after which 20 μl from each sample was resolved by SDS-PAGE and transferred using a semidry system (Bio-Rad, Hercules, CA) to a PVDF membrane. The following antibodies were obtained from commercial sources: GFP AB 290, rabbit pAb, 1:1,000, Cell Signaling (catalog No. 4023); anti-Fyn rabbit pAb, 1:1,000; glyceraldehyde phosphate dehydrogenase (GAPDH); ABM, ID4 GO41, mouse mAb 1:1,000. Chemiluminescence detection was performed using Millipore Luminata Crescendo Western horseradish peroxidase (HRP) substrate.
Calcium Imaging
Our methods were similar to those described previously (Colwell, 2000; Michel et al., 2002; Paz Soldan et al., 2003; Smith et al., 2011). Briefly, a cooled CCD camera (ORCA-ER; Hamamatsu, Hamamatsu City, Japan) was added to the Olympus (Melville, NY) spinning disc confocal microscope to measure fluorescence intensity. To load the dye into cells, the coverslips were washed in serum and phenol red-free DMEM, and the cells were incubated for 45 min at 37°C, 5% CO2 in the same medium containing a final concentration of 4 μM Fura-2 AM (TefLabs, Austin, TX) plus 0.08% pluronic F-127 (Invitrogen), washed four times in DMEM, and stored in DMEM for 0–1 hr before being imaged (Paz Soldan et al., 2003). All measurements, including resting calcium levels, were made in serum-free Hank’s buffered salt solution (HBSS) containing 2 mM Ca2+ but no Mg2+. Calcium influx, and resting Ca2+ levels were measured on individual cells and the results pooled from five separate coverslips representing five separate cell preparations for each condition. Thus, the average effect on a population of transfected cells was determined in order to compensate for the possibility that the expression levels of MBP in different cells might vary. The fluorescence of Fura-2 was excited alternatively at wavelengths of 340 nm and 380 nm by means of a high-speed wavelength-switching device (Lambda DG-4; Sutter Instruments, Novato, CA). Image analysis software (Slide-Book 4.1; Intelligent Imaging Innovations, San Diego, CA) allowed the selection of several regions of interest within the field from which measurements were taken. To minimize bleaching, the intensity of excitation light and sampling frequency were kept as low as possible. In these experiments, measurements were normally made once every 2 sec.
Calibration of Ca2+ Signals
The free [Ca2+] was estimated from the ratio (R) of fluorescence intensities at 340 and 380 nm, using the following equation: [Ca2+] = Kd × slope factor × (R − Rmin)/(Rmax −R) (Grynkiewicz et al., 1985). The Kd was assumed to be 140 nM, whereas values for Rmin and Rmax were determined via calibration methods. An in vitro method (Fura-2 Ca2+ imaging calibration kit; Invitrogen) was used to estimate values. With this method, glass coverslips were filled with a high-[Ca2+] (Fura-2 plus 10 mM Ca2+), a low-[Ca2+] (Fura-2 plus 10 mM EGTA), and a control solution without Fura-2. Each solution also contained a dilute suspension of 15 μm of polystyrene microspheres to ensure uniform coverslip/slide separation and facilitate microscope focusing. The fluorescence (F) at 380 nm excitation of the low-[Ca2+] solution was imaged, and the exposure of the camera was adjusted to maximize the signal. These camera settings were then fixed, and measurements were made with 380 and 340 nm excitation of the three solutions. Here, Rmin = (F340 in low-[Ca2+])/(F380 in low-[Ca2+]), Rmax = (F340 in high-[Ca2+])/(F380 in high-[Ca2+]), and Sf = (F380 in low-[Ca2+])/(F380 in high-[Ca2+]).
Correlation Analysis
Correlation studies of GFP-MBP variants with Ca2+ influx kinetics were done by confocal microscopy using an Olympus spinning disc confocal equipment. Time-lapse digital images were analyzed using the Pearson’s correlation coefficient (Rr) facility, which is provided by the image analysis software (SlideBook 4.1; Intelligent Imaging Innovations). The value of Rr ranges between −1.0 (negative correlation) and 1.0 (perfect correlation; Manders et al., 1993).
RESULTS
Purified Recombinant MBP SH3 Ligand Variants and Terminal Deletions of MBP Have Reduced Binding Affinity for Fyn-SH3
Using isothermal titration calorimetry (ITC), we probed the interaction of unmodified 18.5-kDa rmMBP-C1; different rmMBP-C1 point-substituted constructs (rmMBP-C1-P93G, rmMBP-C1-P96G, rmMBP-C1-T92E, and rmMBP-C1-T95E); and the deletion variants rmMBP-ΔC, rmMBP-ΔN, coding for the first 111 amino acid residues or last 121 amino acid residues, respectively, of full-length rmMBP-C1 (176 residues including the C-terminal LEH6 tag; Fig. 1). These truncation variants were previously shown to have a reduced ability to aggregate lipid vesicles in vitro (Hill et al., 2003) and altered interactions with calcium-activated calmodulin and cytoskeletal proteins (Libich et al., 2003; Hill et al., 2005; Hill and Harauz, 2005). In the current study, these deletion variants are of interest because they both still possess MBP’s SH3 ligand motif. For all ITC experiments performed here, each rmMBP protein was individually titrated against a 9.3-kDa Fyn-SH3 domain peptide, and each titration curve presented in Figure 2 represents a typical curve acquired from an ITC experiment reproduced in duplicate.
Fig. 2.
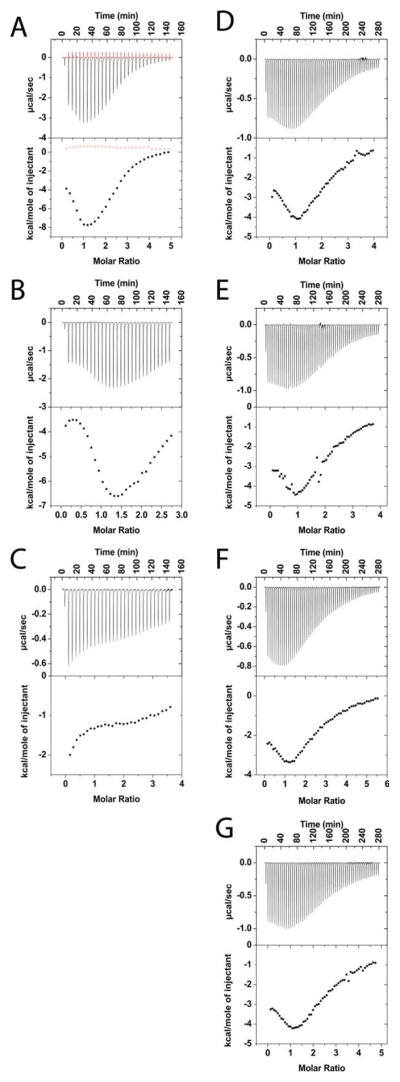
Isothermal titration calorimetry (ITC) of different recombinant murine MBP variants with 9.3-kDa Fyn-SH3 peptide: rmMBP-C1 (black) and heat of dilution (red) (A), rmMBP-C1-ΔC (B), rmMBP-C1-ΔN (C), rmMBP-C1-T92E (D), rmMBP-C1-T95E (E), rmMBP-C1-P93G (F), rmMBP-C1-P96G (G). A 50-mM protein solution (50 mM HEPES-NaOH, pH 7.5, 200 mM NaCl) was titrated with a 1.2-mM solution of Fyn SH3-peptide at 30°C. The top panel of each graph shows the heat evolved from each injection of the calorimeter in microcalories/sec as a function of time. The bottom panel shows the integration of the area under each peak to plot the heat contribution per mole of Fyn as a function of the molar ratio. Terminal (N- and C-) truncation variants and SH3 ligand variants of MBP all show a decreased binding affinity to the Fyn-SH3 peptide compared with the unmodified form. [Color figure can be viewed in the online issue, which is available at wileyonlinelibrary.com.]
Despite the high concentration of salts added to minimize nonspecific electrostatic interactions, the ITC experiments of rmMBP-C1 with Fyn-SH3 domain peptide revealed a nontraditionally shaped curve (Fig. 2A) for an expected 1:1 interaction between the SH3 domain and a binding target (see, e.g., McDonald et al., 2009). The curve showed increasing heats of titration at low molar ratios, giving a peak heat of enthalpy (of approximately –8 kcal/mole at a 1:1 molar ratio) before decreasing to saturation. The observed heat produced from this reaction was within a reasonable range for previously observed SH3 domain protein–protein interactions (McDonald et al., 2009). Because a 1:1 molar ratio was anticipated for the interaction between the SH3 domain and its consensus sequence on MBP, we did not use the Origin software to approximate other thermodynamic properties, except for the enthalpy of the titration. The enthalpy of the interaction provides information pertaining to the strength of the interaction between the Fyn-SH3 domain and MBP (Velazquez-Campoy et al., 2004), but, because of the lack of other parameters necessary for a full thermodynamic analysis, the association constants could not be determined. We are currently using solution NMR spectroscopy to explore this interaction further at the atomic level (De Avila et al., 2011).
Unmodified rmMBP-C1 was compared with the SH3 ligand variants and the truncation variants. The rmMBP-ΔC variant appeared to have an overall binding strength for the Fyn-SH3 domain similar to that of full-length rmMBP-C1, although the peak heat of enthalpy was not reached until a 1:1.5 molar ratio (Fig. 2B). The rmMBP-ΔN variant showed a threefold decrease in heat of enthalpy compared with rmMBP-C1 and rmMBP-ΔC and also showed no change in signal at high molar ratios, in accordance with saturation (Fig. 2C). These results were unexpected, given that both truncated versions of MBP contain the XPXXP consensus sequence for interaction with an SH3 domain. Nevertheless, because full-length rmMBP-C1 bound to the Fyn-SH3 domain, we investigated the effect of substitutions of the MBP SH3 ligand domain. All purified SH3-binding domain P93G, P96G, T92E, and T95E point-substituted variants of MBP demonstrated a reduction in binding strength (of approximately 4 kcal/mol) toward the Fyn-SH3 domain (Fig. 2D–G). These results indicate that the TPRTP segment with an XPXXP motif of MBP is involved in binding the Fyn-SH3 domain and that pseudophosphorylation of Thr92 and Thr95 in this segment inhibits binding.
Overexpression of SH3 Ligand Variant Versions of MBP-C1-UTR in Immortalized N19 and N20.1 OLG Cell Lines Causes Changes in Cell Morphology
We expressed GFP-tagged versions of MBP and variants with point substitutions in its SH3 ligand motif in N19 and N20.1-OLGs to determine whether these substitutions, which inhibit binding to the Fyn-SH3 domain in vitro, alter cell behavior compared with wild-type MBP. The immortalized N19 oligodendroglial line is a relevant stage-specific cell line staining positively with both NG2 and A2B5 antibodies (Foster et al., 1993; Verity et al., 1993). It does not express mRNA for MBP or proteolipid protein. The N20.1-OLG cells are developmentally more advanced, expressing mRNA for both myelin proteolipid protein (PLP) and MBP, although the protein products from these mRNAs are not detectable by Western blotting (Foster et al., 1993). We have previously used live-cell imaging of N19-OLGs to study the influence of golli-MBP and 18.5-kDa MBP-C1 variants on calcium homeostasis as well as MBP-actin and MBP-tubulin interactions during membrane remodeling in PMA-stimulated cells (Paez et al., 2009a–c; Fulton et al., 2010b; Smith et al., 2010, 2011).
Several variants specifically targeted toward mitogen-activated protein kinase (MAPK) phosphorylation sites, as well as structural regions of MBP’s SH3 ligand domain, were generated in an N-terminal-tagged GFP version of MBP-C1, with an additional 3′UTR to direct mRNA trafficking (Fig. 1B). The constructs used for these experiments thus differ from the ones used for ITC (which were C-terminal hexahistidine-tagged). The first variants generated, namely, MBP-C1-T92E-UTR, MBP-C1-T95E-UTR, and MBP-C1-T92E,T95E-UTR, were constructed to examine the effects of mimicking phosphorylation on Thr92 and Thr95, which are established MAPK sites and, in the case of Thr95, also a GSK-3β site (for review see Harauz et al., 2004, 2009; Boggs, 2006). Additional variants, MBP-C1-P93G-UTR and MBP-C1-P96G-UTR, were designed to disrupt the XPXXP SH3 ligand motif and potentially the overall left-handed PPII conformation within that segment of MBP, by substituting glycine for proline (Fig. 1B,C). These proline residues represent key points of interaction between an SH3 domain and its ligand (Polverini et al., 2008; Polverini, 2008).
After expression of these MBP variants, phenotypic changes in cell morphology were evaluated (Figs. 3, 4). Compared with the GFP control, the wild-type 18.5-kDa MBP-C1 protein caused decreases in numbers of membrane processes (Fig. 4A), decreases in surface area (Fig. 4B), increases in process length (Fig. 4C), and no change in amount of process branching (Fig. 4E). The protein was targeted primarily to the cell periphery, as expected by virtue of its 3′UTR (Fig. 4D).
Fig. 3.

Fluorescence micrographs of cultured N19- and N20.1-OLG cell lines 2 days posttransfection expressing different wild-type and variant versions of GFP-tagged MBP-C1-UTR (green) along with nuclei counterstained with DAPI (blue). A: The N19-OLGs expressing site-specific SH3 ligand variant versions of MBP-C1 displayed aberrant membrane processes compared with GFP control. In all MBP overexpressions, an increase in overall membrane elaboration was observed. B: Similar results were observed in the N20.1 cell line, although the phenotypes were, overall, subtler in comparison with the N19 line. Scale bar = 50 μm. [Color figure can be viewed in the online issue, which is available at wileyonlinelibrary.com.]
Fig. 4.

Statistical analyses regarding morphology and protein distribution of N19-OLGs overexpressing GFP-tagged MBP-C1-UTR and MBP-SH3 ligand variants and GFP control in cell culture. Histograms were generated from two separate transfections performed on different days and were analyzed using a paired t-test (P = 0.05) to determine that the duplicate sample sets were not significantly different, followed by ANOVA (P = 0.05). The difference in means was further analyzed using the Tukey means comparison test (P = 0.05). A: Total number of membrane processes. B: Total surface area of cell (μm2). C: Longest process length of cell measured from the cell nucleus using a direct tangent (μm). D: Percentage of cells having GFP or GFP-tagged protein within the nucleus (0 = none, 1 = present), averaged over 30 cells for each experiment. E: Extent of process branching categorized as low (1), medium (2), or high (3) branching. Examples portraying extent of process branching are provided as fluorescence micrographs beside the histogram in E. Statistical analyses were not performed on N20.1-OLGs because this cell line transfected poorly compared with N19-OLGs. [Color figure can be viewed in the online issue, which is available at wileyonlinelibrary.com.]
When variants MBP-C1-P93G-UTR and MBP-C1-P96G-UTR were overexpressed in cultured N19-OLGs, they caused a significant increase in cell surface area and length of process extensions compared with MBP-C1-UTR. The P96G variant also caused an increase in branching complexity, but P93G did not. When expressed in N20.1-OLGs, similar but less pronounced phenotypes for both variants were observed compared with N19-OLGs (Fig. 3B).
The N19-OLGs overexpressing MBP-C1-T95E-UTR had an increase in surface area, overall length of process extensions, and branching complexity. In approximately 25% of transfected cells, the MBP-C1-T95E-UTR protein was redistributed to the nucleus compared with 10% for N19-OLGs expressing unmodified MBP-C1-UTR (Figs. 3A, 4). Overexpression of MBP-C1-T92E-UTR in N19-OLGs caused similar but smaller morphological changes relative to MBP-C1-T95E-UTR; however, nuclear localization of the protein occurred in about 75% of the cells, in contrast to those expressing MBP-C1-UTR and all other SH3 ligand variants (Figs. 3A, 4D). Notably, MBP-C1-T95E-UTR was statistically distinct from all other SH3 ligand variants and controls, with the exception of MBP-C1-P96G-UTR, with respect to increases in branching complexity, having more filopodia at the leading edge of membrane processes (Fig. 4E). When phosphorylation-mimetic C1 variants were expressed in N20.1-OLGs, these phenotypes were also prevalent, although they were not as pronounced visually compared with N19-OLGs (Fig. 3B). The tandem mutation MBP-C1-T92E,T95E-UTR did not express in cultured N19-OLGs.
MBP-C1-T92E-UTR Relocalizes to the Plasma Membrane and Is Excluded From the Nucleus in High-Density N19-OLG Cultures
Previous studies have shown that ectopic expression of the full-length 21.5-kDa classic MBP in HeLa cell cultures causes the protein to localize to the nucleus at low cell confluence and to the cytoplasm at high confluence (Pedraza et al., 1997). These dynamic changes in nuclear trafficking were suggested to correspond to cell–cell contact and hypothesized to be equivalent to similar changes that take place in OLGs during myelin maturation. Further studies using mutagenic approaches determined that there were two separate and distinct regions within golli and classic MBP isoforms that were responsible for their nuclear translocation, and it was suggested that phosphorylation may play a key role in this trafficking (Reyes and Campagnoni, 2002). We have found here that our 18.5-kDa MBP-C1-T92E-UTR pseudophosphorylation variant expresses and localizes to the nucleus of N19-OLGs (at a cell density of 0.5 × 10⁶ cells/ml, grown for 48 hr). To ascertain whether the nuclear trafficking observed for MBP-C1-T92E-UTR was regulated by mechanisms similar to those controlling MBP-21.5 kDa, we next performed a study at different cell confluences of cultured N19-OLGs to see whether MBP-C1-T92E-UTR and MBP-21.5 kDa were localized to the plasma membrane and excluded from the nucleus under similar conditions.
Initially, we expressed the MBP-21.5 kDa splice variant in N19-OLGs and examined its localization in low- and high-density cultures after 24 hr and 48 hr in culture, respectively. We found that, at low-density, the protein was localized almost exclusively to the nucleus, whereas, at high-density, although MBP-21.5 kDa continued to have a nuclear localization, an increased proportion of protein was present in the cytosol and plasma membrane (Fig. 5A). We did not find any significant exclusion of MBP-21.5 kDa from the nucleus as previously described. Nevertheless, there was significantly more protein in the cytosol in high-density cultures compared with low-density cultures. However, the immortalized OLGs expressing MBP-C1-T92E-UTR showed a significantly smaller proportion of cells with protein predominantly in the nucleus in high-density compared with low-density cultured cells (Fig. 5B). Previous studies on MBP-21.5 kDa trafficking were carried out in transfected HeLa cells (Pedraza et al., 1997; Pedraza and Colman, 2000); there may be more cell–cell contacts in those cell cultures than with the N19-OLGs used here, which may be necessary for the greater changes in trafficking seen there.
Fig. 5.

A: Fluorescence micrographs of cultured N19-OLGs 24 and 48 hr posttransfection expressing RFP-MBP-21.5-UTR (red) or 18.5-kDa GFP-MBP-C1-T92E-UTR (green), along with nuclei counterstained with DAPI (blue). Cells were initially plated at a density of 1.5 × 10⁶ cells/ml prior to transfection. In the upper panel, the subcellular distribution of MBP-21.5-UTR at 24 hr, 48 hr, and 72 hr (not shown) is almost the same, with slightly more protein localized outside the nucleus at 48 hr than at 24 hr as shown by relative intensity profiles. In the lower panel, GFP-MBP-C1-T92E-UTR at the 48-hr timepoint, with high cell density, shows a diminution of the number of cells with fluorescent probe predominantly in the nucleus, which we interpret to represent redistribution of the protein to the cytosol and plasma membrane and exclusion from the nucleus, compared with low cell density at the 24-hr timepoint. In the N19-OLG cultures grown to high density (48 hr), there was a significant increase in cytosolic vs. nuclear trafficked protein based on fluorescence intensity profiles compared with the cells grown to low density (24 hr). B: Percentage of cells with GFP predominantly in the nucleus at 48 hr with high cell density. After transfection with GFP-MBP-C1-T92E-UTR, a decreased percentage of the cells had fluorescent probe predominantly in the nucleus at 48 hr with high cell density, compared with low cell density at 24 hr. After transfection with MBP-21.5-UTR, a similar percentage of cells had fluorescent probe predominantly in the nucleus at 24 hr and 48 hr, but slightly more protein was localized outside the nucleus at 48 hr than at 24 hr. C: Time-lapse microscopy of GFP-MBP-C1-UTR or GFP-MBP-C1-T92E-UTR (green), over a 4-hr duration, showing oscillations in protein trafficking from the nucleus to the cytoplasm. Images were acquired at intervals of 6 min, and white arrowheads indicate times when GFP-MBP-C1-T92E-UTR fluorescence intensity was high in the nucleus, whereas black arrowheads indicate times when fluorescence intensity in the nucleus decreased when compared with previous time peak intensities. Supporting Information Videos 1 and 2 show areas with increases in cytoplasmic intensity. Scale bars = 50 μm in A; 15 μm in C. [Color figure can be viewed in the online issue, which is available at wileyonlinelibrary.com.]
To assess further the differential trafficking of MBP-C1-T92E-UTR compared with unmodified MBP-C1-UTR, we performed a time-lapse experiment following 24 hr of posttransfection over a 4-hr period. During this period, a fluorescence image was acquired every 6 min, and spatial protein localization within N19-OLGs was followed. Interestingly, MBP-C1-T92E-UTR demonstrated oscillations in protein trafficking between the nucleus and the cytoplasm or plasma membrane over time, which was not observed with the unmodified protein (Fig. 5C, Supp. Info. Videos 1, 2). The frequency of oscillations was rapid, and changes in fluorescence intensity in some cases could be observed during periods of less than 20 min. These data suggest that phosphorylation of residue Thr92 of MBP may play important roles in regulating MBP localization in OLGs, which, in turn, may alter the potential interacting protein partners and the overall function of MBP.
MBP Colocalizes With Fyn in the Membrane Processes of N19-OLGs
In attempts to distinguish any effects of MBP on Fyn localization in N19-OLGs expressing MBP, we immunostained for endogenous Fyn in N19-OLGs expressing MBP-C1 or SH3 ligand variant versions and found that Fyn was colocalized with MBP in the cell body as well as in the tips of the processes in N19-OLGs (Fig. 6A). Furthermore, compared with control cells expressing GFP alone or with untransfected cells present in the GFP-MBP-C1-UTR-transfected cell culture, MBP-expressing N19-OLGs demonstrated an altered distribution of Fyn within the cell body. The Fyn protein often occurred in inclusions that, in some instances, colocalized with MBP (Fig. 6B). Cells expressing either type of MBP variant, at any overall level of expression, seemed to have similar inclusions: in Figure 6A, arrowheads point to inclusions expressing high levels of MBP, whereas arrowheads with asterisks point to inclusions expressing less MBP. The unmodified MBP-C1-UTR and MBP SH3 ligand variants all resulted in similar changes in Fyn distribution, as ascertained visually (data not shown).
Fig. 6.

A: Fluorescence micrographs of cultured N19-OLGs 2 days posttransfection expressing GFP alone and GFP-tagged MBP-C1-UTR (green). Cells were fixed and immunostained for endogenous Fyn and were detected using secondary Alexa 594 conjugated antibodies (red) along with nuclei counterstained with DAPI (blue). The GFP-transfected cells show a normal heterologous distribution of Fyn within the cytoplasm and plasma membrane of N19-OLGs. B: Confocal laser scanning micrograph reconstructions of the same cell as in A, showing that overexpression of MBP-C1-UTR colocalizes with Fyn in membrane inclusions within the cells. Serial Z-stacks of images were sampled at every 0.3 μm and were compiled and processed and digitally magnified using standard routines written for NIH ImageJ software. See text for details. Scale bar = 20 μm. [Color figure can be viewed in the online issue, which is available at wileyonlinelibrary.com.]
To assess the impact of the recombinant wild-type and mutant forms of MBP on the overall level of endogenous Fyn in cultured cells, we performed a Western blot on the total lysate recovered from transiently transfected HEK 293T cells. Relative densitometric quantification of band intensities revealed that Fyn expression in cells transfected with the unmodified MBP-C1-UTR and the four MBP-C1-UTR SH3 ligand variants varied by a factor of two as with transfection of GFP alone (Table II), within the range of variation that could be expected in such transfection experiments, suggesting that these proteins were not differentially regulating Fyn expression.
TABLE II.
Quantification of Western Blot Analysis of the Effect of 18.5-kDa GFP-MBP-C1-UTR and Variants on Levels of Endogenous Fyn Protein*
| MBP variant | Ratio of endogenous Fyn relative to GAPDH |
|---|---|
| Unmodified MBP-C1-UTR | 0.8 |
| P93G | 1.1 |
| P96G | 1.7 |
| T92E | 0.9 |
| T95E | 0.8 |
| GFP control | 1.8 |
The HEK 293T cells were transfected at 80% confluence using Lipofect-amine 2000 to achieve robust DNA uptake and expression. Relative amounts of the five MBP species and of Fyn were assessed by immunoblotting and normalized to the protein GAPDH (glyceraldehyde phosphate dehydrogenase). The variation of Fyn expression was as expected, for such transfection experiments, a factor of two. The presence of GFP-tagged MBP-C1-UTR; mutants P93G, P96G, T92E, and T95E; and GFP alone thus have no significant effect on the expression of Fyn protein in these cells.
Overexpression of SH3 Ligand Variant Versions of MBP Alters Its Ability To Regulate VOCC Calcium Influx in N19-OLGs
We have previously shown that, in contrast to early developmental golli proteins, classic MBP isoforms significantly decrease calcium influx into N19-OLGs and primary OPCs (Smith et al., 2011). This previous study showed that overexpression of 18.5-kDa MBP-C1-UTR decreased the intracellular Ca2+ concentration by approximately 45% in responding cells compared with controls. Calcium influx via VOCCs in developing OLGs plays an important role in process extension and retraction and cell migration both in vitro and in vivo and may be regulated by Src kinases such as Fyn (Strauss et al., 1997; Klein et al., 2002; Crosby and Poole, 2003; Fitzner et al., 2006; Paez et al., 2009c, 2010).
Using fluorescence microscopy and immunostaining, we have demonstrated here a three-way colocalization of MBP-C1-UTR, Fyn, and L-type VOCCs at the cytosolic surface of the plasma membrane of N19-OLGs (Fig. 7A,C). We should caution, however, that these results do not prove binding per se within the cells, a point to which we return below. After a 5-min treatment with the phorbol ester 12-myristate-13 acetate (PMA), a potent activator of the PKC pathway, we did not observe any change in colocalization of MBP-C1-UTR, Fyn, and L-type VOCCs. The Fura-2-based calcium imaging also revealed that site-directed SH3 ligand point substitutions significantly reduced MBP’s ability to modulate calcium influx when stimulated with high-[K+], compared with unmodified MBP (Fig. 7B). Specifically, we have shown that these substituted variants decrease L-type VOCC calcium influx by only 5–30%, compared with 50% for wild-type MBP-C1-UTR. This could be a result of the reduced interaction of these variants with Fyn or other SH3 domain proteins. This altered function of MBP variants suggests that interaction of 18.5-kDa MBP with proteins such as Fyn is an important step in the modulation of oligodendrocyte Ca2+ uptake by classic MBP isoforms. Furthermore, phosphorylation of MBP might thus result in an increase in calcium concentration in OLG processes. Local increases in calcium concentrations at the process extremities of developing OLGs would provide an explanation for the phenotypic differences in process extension and branching complexity observed in cells expressing SH3 ligand variants of 18.5-kDa MBP.
Fig. 7.

A: Fluorescence micrographs of cultured N19-OLGs immunostained for endogenous Fyn (red) and L-type VOCCs (green), along with nuclear-stained DAPI (blue). Under basal conditions (control, row 1) colocalization of Fyn and VOCCs was observed without introduction of MBP-C1-UTR (arrowheads). After a 5-min treatment with 250 nM PMA, there were no obvious changes in colocalization between Fyn and VOCCs (PMA, row 2). Fluorescence micrographs of cultured N19-OLGs following 48 hr of MBP-C1-UTR expression (red) along with endogenous immunostained Fyn (green) and L-type VOCCs (blue). A three-way colocalization of MBP-C1-UTR, Fyn, and L-type VOCCs at the cytosolic surface of the plasma membrane of N19-OLGs was observed (control, row 3, arrowheads). After a 5-min treatment with 250 nm PMA, there were no obvious changes in colocalization among MBP, Fyn, and VOCCs (PMA, row 4). B: Fura-2 imaging of Ca2+ responses to 20 mM K+ in N19-OLGs overexpressing MBP-C1-UTR and MBP-C1-UTR-SH3 ligand variants. The graph shows the average amplitude calculated from the responding cells, expressed as percentage of change of the emission intensities. Values are expressed as mean ± SEM of at least four independent experiments (n > 100 cells for each experimental condition). *P < 0.05, **P < 0.01 vs. nontransfected N19-OLGs (control). C: Relative intensity profiles of MBP-C1-UTR, Fyn, and L-type VOCCs in unstimulated cells (no PMA), as measured using a line segment (yellow line) from merged images in A. The histogram illustrates that Fyn and VOCCs are at the most leading edge of the plasma membrane along with MBP. Scale bar = 25 μm. [Color figure can be viewed in the online issue, which is available at wileyonlinelibrary.com.]
Coexpression of SH3 Ligand Variant Versions of MBP With Constitutively Active Fyn Reduces Membrane Branching and Elaboration in Contrast to Unmodified MBP in N19-OLGs
Along with other Src family members, Fyn contains an important C-terminal region, which possesses both activating (Y416) and autoinhibitory (Y527) phosphorylation sites that regulate the activity of the kinase (Cooper et al., 1986; Boggon and Eck, 2004). In vivo, Src kinases are phosphorylated on either Y416 (activated state) or Y527 (inactivated state), and the inactivation of the kinase is carried out by the Src-specific kinase Csk (Nada et al., 1991). As a membrane-associated tyrosine kinase, Fyn is an integral part of the process that triggers phosphorylation of hnRNPA2 (heterogeneous nuclear ribonucleoprotein A2), responsible for efficient transport of MBP mRNA to the site of glial–neuronal contact in developing OLGs (Seiwa et al., 2000, 2007; White et al., 2008).
To examine the biological implications of Fyn–MBP binding interactions and their involvement in OLG development, we next performed a series of coexpression experiments using three different constructs coding for forms of Fyn of different activity, in combination with our MBP variants, and unmodified MBP constructs in N19-OLG cultures: 1) p59Fyn-K299M, which is completely inactive because of a mutation in its kinase domain; 2) p59Fyn wild-type, which can be either active or inactive; 3) p59Fyn-Y527F, with a C-terminal point substitution that prevents autoinactivation, thereby allowing the kinase to remain constitutively active.
As expected, coexpression of MBP-C1-UTR and all other MBP-SH3 ligand variants with p59Fyn-K299M in N19-OLGs demonstrated no notable phenotypic differences compared with those shown in Figure 3A. Exogenously expressed Fyn and MBP-SH3 ligand variants still showed significant areas of colocalization within membrane processes (Fig. 8). When MBP-C1-UTR and MBP-SH3 ligand variants were coexpressed with wild-type p59Fyn, there was an observed increase in length and number of process extensions, which was limited but most pronounced in N19-OLGs expressing unmodified MBP-C1-UTR. Coexpression of MBP-C1-UTR and p59Fyn-Y527F, the constitutively active form of Fyn, caused a notable change in cellular morphology, and the majority of cells appeared to have a more developmentally advanced phenotype reminiscent of a mature OLG (Fig. 8, Supp. Info. Fig. 1, Supp. Info. Videos 3, 4). Moreover, MBP-SH3 ligand variants when coexpressed with p59Fyn-Y527F did not cause these same changes in morphology compared with unmodified MBP-C1-UTR, suggesting that MBP-C1 containing an intact SH3 ligand domain is necessary for these changes in membrane complexity and that they are mediated by interactions between MBP’s SH3 ligand domain and some SH3 domain protein, most likely Fyn kinase.
Fig. 8.

A: Fluorescence micrographs of cultured N19-OLGs, 2 days posttransfection, overexpressing wild-type GFP-tagged MBP-C1-UTR and GFP control (green), coexpressing different versions of wild-type (p59Fyn), inactive (p59Fyn-K299M), or constitutively active Fyn (p59Fyn-Y527F; red). Fyn was immunostained and detected using secondary Alexa594-conjugated antibodies, along with nuclei counterstained with DAPI (blue). The asterisks in the bottom row (MBP-C1-UTR with constitutively active Fyn) demonstrate increases in branching complexity compared with GFP control. B: Merged images of cultured N19-OLGs, 2 days posttransfection, overexpressing SH3 ligand variants of GFP-tagged MBP-C1-UTR (green), coexpressing different versions of wild-type (p59Fyn), inactive (p59Fyn-K299M), or constitutively active Fyn (p59Fyn-Y527F; red). Nuclei are counterstained with DAPI (blue). In all cases of exogenous Fyn expression, there was significant colocalization (but not necessarily an interaction) with MBP-C1-UTR and its site-specific SH3 ligand variant versions, particularly at the leading edge of membrane process extensions. The N19-OLGs coexpressing active Fyn, along with site-specific SH3 ligand variants of MBP-C1-UTR, had more processes than GFP control but fewer processes than wild-type MBP-C1-UTR. Scale bars = 25 μm. [Color figure can be viewed in the online issue, which is available at wileyonlinelibrary.com.]
We compared and classified process branching complexity and found that coexpression of MBP-C1-UTR and p59Fyn-Y527F had statistically significantly different effects on cell morphology compared with coexpression with the other MBP SH3 variants (Fig. 9B). Additionally, we noted a decrease in cell motility of N19-OLGs coexpressing MBP-C1-UTR and p59Fyn-Y527F compared with cells expressing exclusively MBP-C1-UTR, perhaps because of the increased number of processes (Fig. 9A, Supp. Info. Videos 1, 2).
Fig. 9.

A: Time-lapse microscopy of N19-OLGs coexpressing MBP-C1-UTR (green), with and without constitutively active Fyn (p59Fyn-Y527F), over a 9-hr duration, showing differences in branching morphology and cell motility. Individual cells were tracked, and paths are provided at different points during the time course. B: Statistical analyses regarding branching complexity of transfected N19-OLGs expressing GFP, GFP-tagged MBP-C1-UTR, and variant versions of GFP-tagged MBP-C1-UTR (green), coexpressing constitutively active Fyn (p59Fyn-Y527F). The degree of process branching complexity was assigned to one of three categories: first-order branching, second-order branching, or third-order or greater than third-order branching, as depicted by the micrograph adjacent to the graphs. Bar graphs showing number of cells, among 150 counted, with different degrees of branching were generated from data acquired from two separate transfections performed on different days (sets = 2, n = 150) and were analyzed using a paired t-test (P = 0.05) to determine that the duplicate sample sets were not significantly different, followed by ANOVA (P = 0.05). The difference in means was further analyzed using the Tukey means comparison test (P = 0.05). Significant increases in process branching complexity were observed with MBP-C1-UTR together with active Fyn but not with any SH3 ligand variant versions of GFP-tagged MBP-C1-UTR. Scale bar = 50 μm. [Color figure can be viewed in the online issue, which is available at wileyonlinelibrary.com.]
DISCUSSION
Classic isoforms of MBP have a X-PX-XP motif in exon IV (exon 8 in golli numbering), namely, T-PR-TP, which was predicted to be an SH3 domain ligand (Moscarello, 1997) and later shown to bind several SH3 domains on a microarray, including that of Fyn, and to bind the Fyn SH3 domain to a lipid bilayer (Homchaudhuri et al., 2009; Polverini et al., 2008). However, it is not known whether this association occurs in vivo. This ligand domain T92PRTPPPS99 (murine sequence) also contains two Thr residues, which are MAPK phosphorylation sites (Hirschberg et al., 2003); Thr95 is also phosphorylated by GSK3-β (Yu and Yang, 1994). These sites are phosphorylated in vivo in OLGs and in myelin, and phosphorylation occurs in myelinated axons in response to the nerve action potential and to extracellular signals applied to OLGs (Atkins et al., 1999; for review see Harauz et al., 2004, 2009; Boggs, 2006, 2008; Harauz and Libich, 2009). Phosphorylation of MBP at Thr95 causes it to be developmentally partitioned into lipid rafts (putative signaling domains) (DeBruin et al., 2005; DeBruin and Harauz, 2007), protects the protein from proteases such as trypsin (Medveczky et al., 2006), and has potential structure-stabilizing effects (Deibler et al., 1990; Polverini et al., 2011; Ramwani et al., 1989). Although phosphorylation of these sites has been shown to have some consequences for interactions of MBP with other proteins in vitro (see, e.g., Boggs et al., 2006, 2011), its effect on the functions of MBP in vivo is not known.
The focus of this study was the physiological role of the SH3 ligand domain of the 18.5-kDa MBP isoform, in particular its interaction with the SH3 domain of Fyn, and physiological effects of pseudophosphorylation of MBP at Thr92 and Thr95 in cultured cells. The 18.5-kDa MBP has previously been shown to localize to detergent-resistant membrane domains from bovine myelin and OLGs, which were enriched in golli-MBP, Fyn, Lyn, MAPK, and CNP (Krämer et al., 1999; Klein et al., 2002; Arvanitis et al., 2005; DeBruin et al., 2005). The detergent-resistant membrane domains from myelin were enriched in the phosphorylated isomer of MBP (DeBruin et al., 2005). Moreover, 18.5-kDa MBP has been shown to tether the Fyn-SH3 domain to a membrane in vitro, which is an interaction that weakens as MBP decreases in charge because of posttranslational modifications, including phosphorylation (Polverini et al., 2008; Homchaudhuri et al., 2009).
The Fyn kinase regulates a number of signal transduction pathways in the CNS and plays an important role in neuronal and OLG differentiation, plasticity, and survival (Umemori et al., 1994, 1999; Osterhout et al., 1999; Seiwa et al., 2000, 2007; Sperber et al., 2001; Sperber and McMorris, 2001; Klein et al., 2002; Lu et al., 2005; White et al., 2008; Perez et al., 2009). Fyn has been identified as an interacting partner for the microtubule-binding protein tau in a neuroblastoma cell line and primary OLGs (Lee et al., 1998; Krämer et al., 1999; Klein et al., 2002). Competitive binding assays utilizing tau variants that contain its SH3-binding motif (XPXXP), but that lack the microtubule (MT)-binding region, have demonstrated a reduction of the process number and process length in OLGs (Klein et al., 2002). In this previous investigation, the authors speculated that these variant versions of tau disrupted the Fyn-tau-tubulin cascade, resulting in the reduction of process number and length. Our experimental design employed the immortalized N19- and N20.1-OLG cell lines, which lack endogenous MBP; as a result, competition of wild-type MBP does not take place with any cellular binding partners. Therefore, any gains of phenotype observed in these immortalized, cultured OLG lines are likely attributable to the expression of the variant version of MBP.
We first showed by ITC that the unmodified 18.5-kDa isoform of MBP binds the Fyn-SH3 domain in a 1:1 ratio, although with an unusual binding curve. To test the hypothesis that the highly conserved TPRTP segment of MBP is involved in binding the Fyn-SH3 domain, we have further shown that Pro-to-Gly substitutions and pseudophosphorylation of Thr92 and Thr95 in this segment inhibit binding. These substitutions may destroy the SH3 ligand motif and/or disrupt the PPII conformation required for binding to an SH3 domain. Deletion of the N- or C-terminal one-third of MBP both diminished the strength of the interaction, but differently, even though both variants contained the putative SH3 ligand. Taken together, these data imply that the interaction of 18.5-kDa MBP with the Fyn-SH3 domain requires residues upstream or downstream from the main SH3 ligand for a synergistic association. It has been shown recently that in other proteins this consensus motif may require the context of other structural regions in order to facilitate its binding to its partner SH3 domain (Stollar et al., 2009).
Additional MBP variants specifically targeted toward MAPK phosphorylation sites as well as structural regions of MBP’s SH3 ligand domain were generated in an N-terminal-tagged GFP version of unmodified MBP-C1, with an additional 3′UTR to direct mRNA trafficking. The wild-type, proline-to-glycine-substituted, and pseudophosphorylated versions of GFP-tagged MBP-C1 were all individually overexpressed in the immortalized N19- and N20.1-OLG cell lines, and phenotypic changes in cell morphology were evaluated. Interestingly, we found a reduction in total number of membrane processes, cell area, and branching, but an increase in process length in N19-OLGs expressing MBP-C1-UTR, compared with GFP alone. The MBP SH3 ligand variants increased surface area, process length, and branching compared with cells expressing the GFP control or unmodified MBP-C1-UTR (Fig. 4). This result suggests that a physiological role of MBP’s association with SH3 domain proteins is to increase process length preferentially to more complex morphological changes. One of MBP’s SH3 domain partners in OLGs may be Fyn. Use of Fyn variants of different activity revealed a dramatic increase in process branching when MBP-C1-UTR was coexpressed with a constitutively active form of Fyn, p59Fyn-Y527F. This effect did not occur with wild-type Fyn or inactive Fyn, nor did it occur with MBP variants with mutations in the SH3 ligand domain. Thus, active Fyn is required for these effects, and association of MBP with some SH3 domain protein, most likely Fyn, is involved, supporting the conclusion that the interaction of MBP’s SH3 ligand domain with SH3 domain proteins plays a physiological role in OLGs.
In addition to pseudophosphorylation of threonines (Thr92Glu and Thr95Glu) having effects on cell morphology, the pseudophosphorylation of Thr92 caused nuclear trafficking of MBP, with pseudophosphorylation of Thr95 having a much smaller effect. In fact, MBP pseudophosphorylated on Thr92 oscillated back and forth between the nucleus and the cytosol, suggesting dynamic changes in interactions with different binding partners. Cell–cell contact, which may mimic membrane interactions that occur in myelin, inhibited its translocation to the nucleus. Phosphorylation of MBP at these sites has previously been speculated to modulate the trafficking of MBP to the nucleus (Reyes and Campagnoni, 2002). In particular, it was shown that PMA stimulation, which might have resulted in phosphorylation of the full-length classic 21.5-kDa transcript at some unknown site, inhibited its nuclear translocation in HeLa cells (Pedraza et al., 1997). Here, however, the opposite effect was observed with the 18.5-kDa isoform pseudophosphorylated at Thr92, but not Thr95, in an immortalized OLG cell line.
The in vitro phosphorylation of 18.5-kDa MBP by MAPK at Thr92 and/or Thr95 was shown previously to decrease the MBP-mediated bundling of actin microfilaments and decrease the binding of actin microfilaments, microtubules, and the Fyn-SH3 domain to lipid bilayers, although it had little effect on MBP’s ability to bind to actin filaments, microtubules, or Fyn-SH3 in aqueous solution in vitro (Boggs et al., 2006, 2011; Polverini et al., 2008; Homchaudhuri et al., 2009). These inhibitory effects on the ability of MBP to tether these proteins to a membrane surface are probably at least partially the result of charge repulsion of the negatively charged proteins from the negatively charged membrane surface, because of less effective charge neutralization by modified MBP. Molecular dynamics simulations have suggested that local perturbations in conformation and in degree of membrane penetration may also occur as a result of these modifications (Polverini et al., 2011).
Modifications to the MBP SH3 ligand domain also inhibited the ability of MBP to decrease Ca2+ influx through VOCCs, indicating that interactions of MBP with some SH3 domain proteins such as Fyn are also responsible for its ability to modulate intracellular Ca2+ concentrations. It has become increasingly clear that calcium regulation via VOCCs in developing OLGs plays an important role in process extension and retraction and cell migration both in vitro and in vivo and can modulate these functions through the activation of multiple kinase pathways, such as protein kinases A and C (PKA and PKC; Paez et al., 2009c, 2010). Aberrant calcium influxes in OLGs can have deleterious effects, so an additional level of control by classic MBP isoforms would be desirable in mature myelin (Fitzner et al., 2006; Harauz and Musse, 2007; Musse et al., 2008).
The Fyn kinase can be activated by PKC, is associated with signaling platforms along with tau and α-tubulin of OLG processes, and has been shown to be an important factor in initiating the recruitment and rearrangement of cytoskeletal components to the site of process outgrowth (Klein et al., 2002; Crosby and Poole, 2003). Microinjection of pp60(c-src), a closely related tyrosine kinase of Fyn, into cultured rat retinal epithelial cells has been shown to regulate L-type VOCCs in an additive manner as detected by whole-cell patch-clamp techniques (Strauss et al., 1997). All in all, then, multiple levels of regulation of VOCC and Fyn kinase activity can be operative in OLGs.
Phosphorylation of MBP may inhibit the ability of MBP to decrease Ca2+ influx through decreased binding of MBP to SH3 domain proteins or through other mechanisms. Changes in intracellular Ca2+ concentration, in addition to changes in tethering of the cytoskeleton to the membrane, may be involved in the changes in cell morphology following phosphorylation of MBP. Taken together, the new data presented here suggest that association of MBP with SH3 domain proteins, such as Fyn, and phosphorylation of MBP at Thr92 and Thr95, by MAP kinases and/or others such as glycogen synthase kinase (Boggs et al., 2008), may play important physiological roles in regulation of OLG intracellular Ca2+ concentration and cell process development. It is reasonable to suggest, then, that MBP may recruit Fyn from the cytosol and tether it to the plasma membrane, where it may facilitate phosphorylation of multiple protein targets responsible for cytoskeletal regulation and/or assembly (cf. Homchaudhuri et al., 2009). Taken as a whole, these interactions between Fyn and MBP at the cytoplasmic leaflet of N19-OLGs may provide essential developmentally regulated cues in vivo, which in turn are responsible for membrane elaboration and axonal ensheathment by OLGs in the CNS. Interference in these normal associations has been suggested to result potentially in myelin instability (Bessonov et al., 2010; Rubenstein, 2008; Tait and Straus, 2008).
Although the 18.5-kDa MBP splice isoform is produced in large quantities in OLG processes in situ in the brain only as they begin to ensheathe the axon (Butt et al., 1997; Barbarese et al., 1999), significant membrane production and process development still must occur before the axon is fully myelinated. Therefore, we suggest that MBP may fulfill these other functions at that time, before it becomes sequestered in compact myelin (Harauz et al., 2009). Previous studies by Perez and colleagues (2009) have shown that apotransferrin (aTf) accelerated the morphological differentiation of N19-OLGs. These studies demonstrated that aTf activates the Fyn kinase pathway, which in turn regulates downstream cytoskeletal targets including tubulin and tau. Moreover, the expression of a tau dominant-negative construct (+XPXXP) blocked this differentiation cascade induced by aTf further, demonstrating that the Fyn-tau interaction is essential for the generation and elaboration of cellular processes. Our current investigation has shown that the expression of MBP with the constitutively active form of Fyn kinase causes extensive membrane elaboration and branching complexity of N19 OLGs. Consistently with previous studies of Fyn-tau interactions (Klein et al., 2002; Perez et al., 2009), the observed morphological changes in N19-OLG differentiation produced here by MBP-Fyn interactions also require the XPXXP SH3 ligand domain of classical 18.5-kDa MBP isoforms.
Supplementary Material
Acknowledgments
G.S.T.S. and M.D.A. are recipients of Doctoral Studentships from the Multiple Sclerosis Society of Canada, and P.M.P is a recipient of a Postdoctoral Fellowship from the National Multiple Sclerosis Society (FG1723A1/1). M.K.B.W. is a recipient of Canadian Institutes of Health Research Vanier Canada Graduate Scholarship and the University of Guelph Brock Doctoral Scholarship. The authors are grateful to Drs. Tony Campagnoni and Vladimir Bamm for many helpful discussions, to Dr. Rui (Ray) Lu for generous use of his epifluorescence microscope, to Ms. Mindy Snyder for assistance with experiments, and to Mrs. Janine Voyer-Grant for superb technical support.
Contract grant sponsor: Canadian Institutes of Health Research; Contract grant number: MOP 86483 (to J.M.B., G.H.); Contract grant sponsor: Natural Sciences and Engineering Research Council of Canada; Contract grant number: RG121541 (to G.H.); Contract grant number: RG327372 (to N.J.).
Footnotes
Additional Supporting Information may be found in the online version of this article.
References
- Ahmed MAM, Bamm VV, Shi L, Steiner-Mosonyi M, Dawson JF, Brown L, Harauz G, Ladizhansky V. Induced secondary structure and polymorphism in an intrinsically disordered structural linker of the CNS: Solid-state NMR and FTIR spectroscopy of myelin basic protein bound to actin. Biophys J. 2009;96:180–191. doi: 10.1016/j.bpj.2008.10.003. [DOI] [PMC free article] [PubMed] [Google Scholar]
- Arvanitis DN, Min W, Gong Y, Heng YM, Boggs JM. Two types of detergent-insoluble, glycosphingolipid/cholesterol-rich membrane domains from isolated myelin. J Neurochem. 2005;94:1696–1710. doi: 10.1111/j.1471-4159.2005.03331.x. [DOI] [PubMed] [Google Scholar]
- Atkins CM, Yon M, Groome NP, Sweatt JD. Regulation of myelin basic protein phosphorylation by mitogen-activated protein kinase during increased action potential firing in the hippocampus. J Neurochem. 1999;73:1090–1097. doi: 10.1046/j.1471-4159.1999.0731090.x. [DOI] [PubMed] [Google Scholar]
- Bamm VV, Ahmed MA, Harauz G. Interaction of myelin basic protein with actin in the presence of dodecylphosphocholine micelles. Biochemistry. 2010;49:6903–6915. doi: 10.1021/bi100308d. [DOI] [PubMed] [Google Scholar]
- Barbarese E, Brumwell C, Kwon S, Cui H, Carson JH. RNA on the road to myelin. J Neurocytol. 1999;28:263–270. doi: 10.1023/a:1007097226688. [DOI] [PubMed] [Google Scholar]
- Bates IR, Matharu P, Ishiyama N, Rochon D, Wood DD, Polverini E, Moscarello MA, Viner NJ, Harauz G. Characterization of a recombinant murine 18.5-kDa myelin basic protein. Prot Expr Purif. 2000;20:285–299. doi: 10.1006/prep.2000.1307. [DOI] [PubMed] [Google Scholar]
- Bates IR, Libich DS, Wood DD, Moscarello MA, Harauz G. An Arg/Lys→Gln mutant of recombinant murine myelin basic protein as a mimic of the deiminated form implicated in multiple sclerosis. Prot Expr Purif. 2002;25:330–341. doi: 10.1016/s1046-5928(02)00017-7. [DOI] [PubMed] [Google Scholar]
- Baumann N, Pham-Dinh D. Biology of oligodendrocyte and myelin in the mammalian central nervous system. Physiol Rev. 2001;81:871–927. doi: 10.1152/physrev.2001.81.2.871. [DOI] [PubMed] [Google Scholar]
- Bessonov K, Bamm VV, Harauz G. Misincorporation of the proline homologue Aze (azetidine-2-carboxylic acid) into recombinant myelin basic protein. Phytochemistry. 2010;71:502–507. doi: 10.1016/j.phytochem.2009.12.010. [DOI] [PubMed] [Google Scholar]
- Biffiger K, Bartsch S, Montag D, Aguzzi A, Schachner M, Bartsch U. Severe hypomyelination of the murine CNS in the absence of myelin-associated glycoprotein and fyn tyrosine kinase. J Neurosci. 2000;20:7430–7437. doi: 10.1523/JNEUROSCI.20-19-07430.2000. [DOI] [PMC free article] [PubMed] [Google Scholar]
- Boggon TJ, Eck MJ. Structure and regulation of Src family kinases. Oncogene. 2004;23:7918–7927. doi: 10.1038/sj.onc.1208081. [DOI] [PubMed] [Google Scholar]
- Boggs JM. Myelin basic protein: a multifunctional protein. Cell Mol Life Sci. 2006;63:1945–1961. doi: 10.1007/s00018-006-6094-7. [DOI] [PMC free article] [PubMed] [Google Scholar]
- Boggs JM. Myelin basic protein. Hauppauge, NY: Nova Science Publishers; 2008. [Google Scholar]
- Boggs JM, Rangaraj G, Hill CMD, Bates IR, Heng YM, Harauz G. Effect of arginine loss in myelin basic protein, as occurs in its deiminated charge isoform, on mediation of actin polymerization and actin binding to a lipid membrane in vitro. Biochemistry. 2005;44:3524–3534. doi: 10.1021/bi0473760. [DOI] [PubMed] [Google Scholar]
- Boggs JM, Rangaraj G, Gao W, Heng YM. Effect of phosphorylation of myelin basic protein by MAPK on its interactions with actin and actin binding to a lipid membrane in vitro. Biochemistry. 2006;45:391–401. doi: 10.1021/bi0519194. [DOI] [PubMed] [Google Scholar]
- Boggs JM, Gao W, Hirahara Y. Signal transduction pathways involved in interaction of galactosylceramide/sulfatide-containing liposomes with cultured oligodendrocytes and requirement for myelin basic protein and glycosphingolipids. J Neurosci Res. 2008;86:1448–1458. doi: 10.1002/jnr.21603. [DOI] [PubMed] [Google Scholar]
- Boggs JM, Rangaraj G, Heng YM, Liu Y, Harauz G. Myelin basic protein binds microtubules to a membrane surface and to actin filaments in vitro: effect of phosphorylation and deimination. Biochim Biophys Acta. 2011;1808:761–773. doi: 10.1016/j.bbamem.2010.12.016. [DOI] [PubMed] [Google Scholar]
- Bradl M, Lassmann H. Oligodendrocytes: biology and pathology. Acta Neuropathol. 2010;119:37–53. doi: 10.1007/s00401-009-0601-5. [DOI] [PMC free article] [PubMed] [Google Scholar]
- Bunge MB, Bunge RP, Pappas GD. Electron microscopic demonstration of connections between glia and myelin sheaths in the developing mammalian central nervous system. J Cell Biol. 1962;12:448–453. doi: 10.1083/jcb.12.2.448. [DOI] [PubMed] [Google Scholar]
- Bunge RP. Glial cells and the central myelin sheath. Physiol Rev. 1968;48:197–251. doi: 10.1152/physrev.1968.48.1.197. [DOI] [PubMed] [Google Scholar]
- Butt AM, Ibrahim M, Berry M. The relationship between developing oligodendrocyte units and maturing axons during myelinogenesis in the anterior medullary velum of neonatal rats. J Neurocytol. 1997;26:327–338. doi: 10.1023/a:1018556702353. [DOI] [PubMed] [Google Scholar]
- Campagnoni AT, Pribyl TM, Campagnoni CW, Kampf K, Amur-Umarjee S, Landry CF, Handley VW, Newman SL, Garbay B, Kitamura K. Structure and developmental regulation of golli-mbp, a 105-kilo-base gene that encompasses the myelin basic protein gene and is expressed in cells in the oligodendrocyte lineage in the brain. J Biol Chem. 1993;268:4930–4938. [PubMed] [Google Scholar]
- Carson JH, Gao Y, Tatavarty V, Levin MK, Korza G, Francone VP, Kosturko LD, Maggipinto MJ, Barbarese E. Multiplexed RNA trafficking in oligodendrocytes and neurons. Biochim Biophys Acta. 2008;1779:453–458. doi: 10.1016/j.bbagrm.2008.04.002. [DOI] [PMC free article] [PubMed] [Google Scholar]
- Colwell CS. Circadian modulation of calcium levels in cells in the suprachiasmatic nucleus. Eur J Neurosci. 2000;12:571–576. doi: 10.1046/j.1460-9568.2000.00939.x. [DOI] [PMC free article] [PubMed] [Google Scholar]
- Cooper JA, Gould KL, Cartwright CA, Hunter T. Tyr527 is phosphorylated in pp60c-src: implications for regulation. Science. 1986;231:1431–1434. doi: 10.1126/science.2420005. [DOI] [PubMed] [Google Scholar]
- Crosby D, Poole AW. Physical and functional interaction between protein kinase C delta and Fyn tyrosine kinase in human platelets. J Biol Chem. 2003;278:24533–24541. doi: 10.1074/jbc.M301847200. [DOI] [PubMed] [Google Scholar]
- De Avila M, Ahmed MAM, Smith GST, Boggs JM, Harauz G. Modes of SH3-domain interactions of 18.5 kDa myelin basic protein in vitro and in oligodendrocytes. Biophysical Journal; Abstract B164, 55th Annual Meeting of the Biophysical Society; Baltimore, MD. March 5–9, 2011.2011. [Google Scholar]
- DeBruin LS, Haines JD, Wellhauser LA, Radeva G, Schonmann V, Bienzle D, Harauz G. Developmental partitioning of myelin basic protein into membrane microdomains. J Neurosci Res. 2005;80:211–225. doi: 10.1002/jnr.20452. [DOI] [PubMed] [Google Scholar]
- DeBruin LS, Harauz G. White matter rafting—membrane microdomains in myelin. Neurochem Res. 2007;32:213–228. doi: 10.1007/s11064-006-9137-4. [DOI] [PubMed] [Google Scholar]
- Deibler GE, Stone AL, Kies MW. Role of phosphorylation in conformational adaptability of bovine myelin basic protein. Proteins. 1990;7:32–40. doi: 10.1002/prot.340070104. [DOI] [PubMed] [Google Scholar]
- Fitzner D, Schneider A, Kippert A, Mobius W, Willig KI, Hell SW, Bunt G, Gaus K, Simons M. Myelin basic protein-dependent plasma membrane reorganization in the formation of myelin. EMBO J. 2006;25:5037–5048. doi: 10.1038/sj.emboj.7601376. [DOI] [PMC free article] [PubMed] [Google Scholar]
- Foster LM, Phan T, Verity AN, Bredesen D, Campagnoni AT. Generation and analysis of normal and shiverer temperature-sensitive immortalized cell lines exhibiting phenotypic characteristics of oligodendrocytes at several stages of differentiation. Dev Neurosci. 1993;15:100–109. doi: 10.1159/000111322. [DOI] [PubMed] [Google Scholar]
- Foster LM, Landry C, Phan T, Campagnoni AT. Conditionally immortalized oligodendrocyte cell lines migrate to different brain regions and elaborate “myelin-like” membranes after transplantation into neonatal shiverer mouse brains. Dev Neurosci. 1995;17:160–170. doi: 10.1159/000111284. [DOI] [PubMed] [Google Scholar]
- Fulton D, Paez PM, Campagnoni AT. The multiple roles of myelin protein genes during the development of the oligodendrocyte. ASN Neuro. 2010a;2:e00027. doi: 10.1042/AN20090051. [DOI] [PMC free article] [PubMed] [Google Scholar]
- Fulton D, Paez PM, Fisher R, Handley V, Colwell CS, Campagnoni AT. Regulation of L-type Ca2+ currents and process morphology in white matter oligodendrocyte precursor cells by golli-myelin proteins. Glia. 2010b;58:1292–1303. doi: 10.1002/glia.21008. [DOI] [PubMed] [Google Scholar]
- Givogri MI, Bongarzone ER, Schonmann V, Campagnoni AT. Expression and regulation of golli products of myelin basic protein gene during in vitro development of oligodendrocytes. J Neurosci Res. 2001;66:679–690. doi: 10.1002/jnr.10031. [DOI] [PubMed] [Google Scholar]
- Grynkiewicz G, Poenie M, Tsien RY. A new generation of Ca2+ indicators with greatly improved fluorescence properties. J Biol Chem. 1985;260:3440–3450. [PubMed] [Google Scholar]
- Harauz G, Libich DS. The classic basic protein of myelin—conserved structural motifs and the dynamic molecular barcode involved in membrane adhesion and protein–protein interactions. Curr Prot Pept Sci. 2009;10:196–215. doi: 10.2174/138920309788452218. [DOI] [PubMed] [Google Scholar]
- Harauz G, Musse AA. A tale of two citrullines—structural and functional aspects of myelin basic protein deimination in health and disease. Neurochem Res. 2007;32:137–158. doi: 10.1007/s11064-006-9108-9. [DOI] [PubMed] [Google Scholar]
- Harauz G, Ishiyama N, Hill CMD, Bates IR, Libich DS, Farès C. Myelin basic protein—diverse conformational states of an intrinsically unstructured protein and its roles in myelin assembly and multiple sclerosis. Micron. 2004;35:503–542. doi: 10.1016/j.micron.2004.04.005. [DOI] [PubMed] [Google Scholar]
- Harauz G, Ladizhansky V, Boggs JM. Structural polymorphism and multifunctionality of myelin basic protein. Biochemistry. 2009;48:8094–8104. doi: 10.1021/bi901005f. [DOI] [PubMed] [Google Scholar]
- Hill CMD, Harauz G. Charge effects modulate actin assembly by classic myelin basic protein isoforms. Biochem Biophys Res Commun. 2005;329:362–369. doi: 10.1016/j.bbrc.2005.01.151. [DOI] [PubMed] [Google Scholar]
- Hill CMD, Haines JD, Antler CE, Bates IR, Libich DS, Harauz G. Terminal deletion mutants of myelin basic protein: new insights into self-association and phospholipid interactions. Micron. 2003;34:25–37. doi: 10.1016/s0968-4328(02)00058-6. [DOI] [PubMed] [Google Scholar]
- Hill CMD, Libich DS, Harauz G. Assembly of tubulin by classic myelin basic protein isoforms and regulation by post-translational modification. Biochemistry. 2005;44:16672–16683. doi: 10.1021/bi050646+. [DOI] [PubMed] [Google Scholar]
- Hirschberg D, Radmark O, Jornvall H, Bergman T. Thr94 in bovine myelin basic protein is a second phosphorylation site for 42-kDa mitogen-activated protein kinase (ERK2) J Prot Chem. 2003;22:177–181. doi: 10.1023/a:1023479131488. [DOI] [PubMed] [Google Scholar]
- Homchaudhuri L, Polverini E, Gao W, Harauz G, Boggs JM. Influence of membrane surface charge and post-translational modifications to myelin basic protein on its ability to tether the Fyn-SH3 domain to a membrane in vitro. Biochemistry. 2009;48:2385–2393. doi: 10.1021/bi8022587. [DOI] [PubMed] [Google Scholar]
- Jacobs EC, Reyes SD, Campagnoni CW, Givogri I, Kampf K, Handley V, Spreuer V, Fisher R, Macklin W, Campagnoni AT. Targeted overexpression of a golli-myelin basic protein isoform to oligodendrocytes results in aberrant oligodendrocyte maturation and myelination. ASN Neuro. 2009;1:e00017. doi: 10.1042/AN20090029. [DOI] [PMC free article] [PubMed] [Google Scholar]
- Klein C, Kramer EM, Cardine AM, Schraven B, Brandt R, Trotter J. Process outgrowth of oligodendrocytes is promoted by interaction of Fyn kinase with the cytoskeletal protein tau. J Neurosci. 2002;22:698–707. doi: 10.1523/JNEUROSCI.22-03-00698.2002. [DOI] [PMC free article] [PubMed] [Google Scholar]
- Krämer EM, Klein C, Koch T, Boytinck M, Trotter J. Compartmentation of Fyn kinase with glycosylphosphatidylinositol-anchored molecules in oligodendrocytes facilitates kinase activation during myelination. J Biol Chem. 1999;274:29042–29049. doi: 10.1074/jbc.274.41.29042. [DOI] [PubMed] [Google Scholar]
- Krämer-Albers EM, White R. From axon-glial signalling to myelination: the integrating role of oligodendroglial Fyn kinase. Cell Mol Life Sci. 2011 doi: 10.1007/s00018-010-0616-z. (in press) [DOI] [PMC free article] [PubMed] [Google Scholar]
- Laursen LS, Chan CW, Ffrench-Constant C. An integrin-contactin complex regulates CNS myelination by differential Fyn phosphorylation. J Neurosci. 2009;29:9174–9185. doi: 10.1523/JNEUROSCI.5942-08.2009. [DOI] [PMC free article] [PubMed] [Google Scholar]
- Laursen LS, Chan CW, Ffrench-Constant C. Translation of myelin basic protein mRNA in oligodendrocytes is regulated by integrin activation and hnRNP-K. J Cell Biol. 2011;192:797–811. doi: 10.1083/jcb.201007014. [DOI] [PMC free article] [PubMed] [Google Scholar]
- Lee G, Newman ST, Gard DL, Band H, Panchamoorthy G. Tau interacts with src-family non-receptor tyrosine kinases. J Cell Sci. 1998;111:3167–3177. doi: 10.1242/jcs.111.21.3167. [DOI] [PubMed] [Google Scholar]
- Libich DS, Harauz G. Backbone dynamics of the 18.5 kDa isoform of myelin basic protein reveals transient α-helices and a calmodulin-binding site. Biophys J. 2008;94:4847–4866. doi: 10.1529/biophysj.107.125823. [DOI] [PMC free article] [PubMed] [Google Scholar]
- Libich DS, Hill CMD, Haines JD, Harauz G. Myelin basic protein has multiple calmodulin-binding sites. Biochem Biophys Res Commun. 2003;308:313–319. doi: 10.1016/s0006-291x(03)01380-9. [DOI] [PubMed] [Google Scholar]
- Lu Z, Ku L, Chen Y, Feng Y. Developmental abnormalities of myelin basic protein expression in fyn knock-out brain reveal a role of Fyn in posttranscriptional regulation. J Biol Chem. 2005;280:389–395. doi: 10.1074/jbc.M405973200. [DOI] [PubMed] [Google Scholar]
- Manders EMM, Verbeek FJ, Aten JA. Measurement of colocalization of objects in dual-color confocal images. J Microsc. 1993;169:375–382. doi: 10.1111/j.1365-2818.1993.tb03313.x. [DOI] [PubMed] [Google Scholar]
- Manié SN, Astier A, Haghayeghi N, Canty T, Druker BJ, Hirai H, Freedman AS. Regulation of integrin-mediated p130(Cas) tyrosine phosphorylation in human B cells. A role for p59(Fyn) and SHP2. J Biol Chem. 1997;272:15636–15641. doi: 10.1074/jbc.272.25.15636. [DOI] [PubMed] [Google Scholar]
- Maxwell KL, Davidson AR. Mutagenesis of a buried polar interaction in an SH3 domain: sequence conservation provides the best prediction of stability effects. Biochemistry. 1998;37:16172–16182. doi: 10.1021/bi981788p. [DOI] [PubMed] [Google Scholar]
- McDonald CB, Seldeen KL, Deegan BJ, Farooq A. SH3 domains of Grb2 adaptor bind to PXpsiPXR motifs within the Sos1 nucleotide exchange factor in a discriminate manner. Biochemistry. 2009;48:4074–4085. doi: 10.1021/bi802291y. [DOI] [PMC free article] [PubMed] [Google Scholar]
- Medveczky P, Antal J, Patthy A, Kekesi K, Juhasz G, Szilagyi L, Graf L. Myelin basic protein, an autoantigen in multiple sclerosis, is selectively processed by human trypsin 4. FEBS Lett. 2006;580:545–552. doi: 10.1016/j.febslet.2005.12.067. [DOI] [PubMed] [Google Scholar]
- Michel S, Itri J, Colwell CS. Excitatory mechanisms in the supra-chiasmatic nucleus: the role of AMPA/KA glutamate receptors. J Neurophysiol. 2002;88:817–828. doi: 10.1152/jn.2002.88.2.817. [DOI] [PMC free article] [PubMed] [Google Scholar]
- Miron VE, Kuhlmann T, Antel JP. Cells of the oligodendroglial lineage, myelination, and remyelination. Biochim Biophys Acta. 2011;1812:184–193. doi: 10.1016/j.bbadis.2010.09.010. [DOI] [PubMed] [Google Scholar]
- Moscarello MA. Myelin basic protein, the “executive” molecule of the myelin membrane. In: Juurlink BHJ, Devon RM, Doucette JR, Nazarali AJ, Schreyer DJ, Verge VMK, editors. Cell biology and pathology of myelin: evolving biological concepts and therapeutic approaches. New York: Plenum Press; 1997. pp. 13–25. [Google Scholar]
- Musse AA, Li Z, Ackerley CA, Bienzle D, Lei H, Poma R, Harauz G, Moscarello MA, Mastronardi FG. Peptidylarginine deiminase 2 (PAD2) expression in a transgenic mouse leads to specific central nervous system (CNS) myelin instability. Dis Models Mech. 2008;1:229–240. doi: 10.1242/dmm.000729. [DOI] [PMC free article] [PubMed] [Google Scholar]
- Nada S, Okada M, MacAuley A, Cooper JA, Nakagawa H. Cloning of a complementary DNA for a protein-tyrosine kinase that specifically phosphorylates a negative regulatory site of p60c-src. Nature. 1991;351:69–72. doi: 10.1038/351069a0. [DOI] [PubMed] [Google Scholar]
- Osterhout DJ, Wolven A, Wolf RM, Resh MD, Chao MV. Morphological differentiation of oligodendrocytes requires activation of Fyn tyrosine kinase. J Cell Biol. 1999;145:1209–1218. doi: 10.1083/jcb.145.6.1209. [DOI] [PMC free article] [PubMed] [Google Scholar]
- Paez PM, Fulton D, Colwell CS, Campagnoni AT. Voltage-operated Ca2+ and Na+ channels in the oligodendrocyte lineage. J Neurosci Res. 2009a;87:3259–3266. doi: 10.1002/jnr.21938. [DOI] [PubMed] [Google Scholar]
- Paez PM, Fulton DJ, Spreuer V, Handley V, Campagnoni CW, Campagnoni AT. Regulation of store-operated and voltage-operated Ca2+ channels in the proliferation and death of oligodendrocyte precursor cells by golli proteins. ASN Neuro. 2009b;1:e00003. doi: 10.1042/AN20090003. [DOI] [PMC free article] [PubMed] [Google Scholar]
- Paez PM, Fulton DJ, Spreuer V, Handley V, Campagnoni CW, Macklin WB, Colwell C, Campagnoni AT. Golli myelin basic proteins regulate oligodendroglial progenitor cell migration through voltage-gated Ca2+ influx. J Neurosci. 2009c;29:6663–6676. doi: 10.1523/JNEUROSCI.5806-08.2009. [DOI] [PMC free article] [PubMed] [Google Scholar]
- Paez PM, Fulton DJ, Spreur V, Handley V, Campagnoni AT. Multiple kinase pathways regulate voltage-dependent Ca2+ influx and migration in oligodendrocyte precursor cells. J Neurosci. 2010;30:6422–6433. doi: 10.1523/JNEUROSCI.5086-09.2010. [DOI] [PMC free article] [PubMed] [Google Scholar]
- Paz Soldan MM, Warrington AE, Bieber AJ, Ciric B, Van KV, Pease LR, Rodriguez M. Remyelination-promoting antibodies activate distinct Ca2+ influx pathways in astrocytes and oligodendrocytes: relationship to the mechanism of myelin repair. Mol Cell Neurosci. 2003;22:14–24. doi: 10.1016/s1044-7431(02)00018-0. [DOI] [PubMed] [Google Scholar]
- Pedraza L, Colman DR. Fluorescent myelin proteins provide new tools to study the myelination process. J Neurosci Res. 2000;60:697–703. doi: 10.1002/1097-4547(20000615)60:6<697::AID-JNR1>3.0.CO;2-U. [DOI] [PubMed] [Google Scholar]
- Pedraza L, Fidler L, Staugaitis SM, Colman DR. The active transport of myelin basic protein into the nucleus suggests a regulatory role in myelination. Neuron. 1997;18:579–589. doi: 10.1016/s0896-6273(00)80299-8. [DOI] [PubMed] [Google Scholar]
- Perez MJ, Ortiz EH, Roffe M, Soto EF, Pasquini JM. Fyn kinase is involved in oligodendroglial cell differentiation induced by apotransferrin. J Neurosci Res. 2009;87:3378–3389. doi: 10.1002/jnr.21962. [DOI] [PubMed] [Google Scholar]
- Polverini E. Molecular modelling of the interaction of myelin basic protein peptides with signalling proteins and effects of post-translational modifications. In: Boggs JM, editor. Myelin basic protein. New York: Nova Science Publishers; 2008. pp. 169–195. [Google Scholar]
- Polverini E, Rangaraj G, Libich DS, Boggs JM, Harauz G. Binding of the proline-rich segment of myelin basic protein to SH3 domains—spectroscopic, microarray, and modelling studies of ligand conformation and effects of post-translational modifications. Biochemistry. 2008;47:267–282. doi: 10.1021/bi701336n. [DOI] [PubMed] [Google Scholar]
- Polverini E, Coll EP, Tieleman DP, Harauz G. Conformational choreography of a molecular switch region in myelin basic protein-Molecular dynamics shows induced folding and secondary structure type conversion upon threonyl phosphorylation in both aqueous and membrane-associated environments. Biochim Biophys Acta. 2011;1808:674–683. doi: 10.1016/j.bbamem.2010.11.030. [DOI] [PubMed] [Google Scholar]
- Pribyl TM, Campagnoni CW, Kampf K, Kashima T, Handley VW, McMahon J, Campagnoni AT. The human myelin basic protein gene is included within a 179-kilobase transcription unit: expression in the immune and central nervous systems. Proc Natl Acad Sci U S A. 1993;90:10695–10699. doi: 10.1073/pnas.90.22.10695. [DOI] [PMC free article] [PubMed] [Google Scholar]
- Ramwani JJ, Epand RM, Moscarello MA. Secondary structure of charge isomers of myelin basic protein before and after phosphorylation. Biochemistry. 1989;28:6538–6543. doi: 10.1021/bi00442a002. [DOI] [PubMed] [Google Scholar]
- Resh MD. Fyn, a Src family tyrosine kinase. Int J Biochem Cell Biol. 1998;30:1159–1162. doi: 10.1016/s1357-2725(98)00089-2. [DOI] [PubMed] [Google Scholar]
- Reyes SD, Campagnoni AT. Two separate domains in the golli myelin basic proteins are responsible for nuclear targeting and process extension in transfected cells. J Neurosci Res. 2002;69:587–596. doi: 10.1002/jnr.10319. [DOI] [PubMed] [Google Scholar]
- Rubenstein E. Misincorporation of the proline analog azetidine-2-carboxylic acid in the pathogenesis of multiple sclerosis: a hypothesis. J Neuropathol Exp Neurol. 2008;67:1035–1040. doi: 10.1097/NEN.0b013e31818add4a. [DOI] [PubMed] [Google Scholar]
- Seiwa C, Sugiyama I, Yagi T, Iguchi T, Asou H. Fyn tyrosine kinase participates in the compact myelin sheath formation in the central nervous system. Neurosci Res. 2000;37:21–31. doi: 10.1016/s0168-0102(00)00100-0. [DOI] [PubMed] [Google Scholar]
- Seiwa C, Yamamoto M, Tanaka K, Fukutake M, Ueki T, Takeda S, Sakai R, Ishige A, Watanabe K, Akita M, Yagi T, Tanaka K, Asou H. Restoration of FcRgamma/Fyn signaling repairs central nervous system demyelination. J Neurosci Res. 2007;85:954–966. doi: 10.1002/jnr.21196. [DOI] [PubMed] [Google Scholar]
- Smith GST, Petley-Ragan LM, Gao W, Boggs JM, Harauz G. Classic isoforms of myelin basic protein associate with the cytoskeleton in oligodendroglial cells during ruffling. Transactions of the American Society for Neurochemistry 41st Annual Meeting; 2010. pp. OP05–01. [Google Scholar]
- Smith GST, Paez PM, Spreuer V, Campagnoni CW, Boggs JM, Campagnoni AT, Harauz G. Classical 18.5- and 21.5-kDa isoforms of myelin basic protein inhibit calcium influx into oligodendroglial cells, in contrast to golli isoforms. J Neurosci Res. 2011;89:467–480. doi: 10.1002/jnr.22570. [DOI] [PMC free article] [PubMed] [Google Scholar]
- Sperber BR, McMorris FA. Fyn tyrosine kinase regulates oligodendroglial cell development but is not required for morphological differentiation of oligodendrocytes. J Neurosci Res. 2001;63:303–312. doi: 10.1002/1097-4547(20010215)63:4<303::AID-JNR1024>3.0.CO;2-A. [DOI] [PubMed] [Google Scholar]
- Sperber BR, Boyle-Walsh EA, Engleka MJ, Gadue P, Peterson AC, Stein PL, Scherer SS, McMorris FA. A unique role for Fyn in CNS myelination. J Neurosci. 2001;21:2039–2047. doi: 10.1523/JNEUROSCI.21-06-02039.2001. [DOI] [PMC free article] [PubMed] [Google Scholar]
- Stollar EJ, Garcia B, Chong PA, Rath A, Lin H, Forman-Kay JD, Davidson AR. Structural, functional and bioinformatic studies demonstrate the crucial role of an extended peptide binding site for the SH3 domain of yeast Abp1p. J Biol Chem. 2009;284:26918–26927. doi: 10.1074/jbc.M109.028431. [DOI] [PMC free article] [PubMed] [Google Scholar]
- Strauss O, Mergler S, Wiederholt M. Regulation of L-type calcium channels by protein tyrosine kinase and protein kinase C in cultured rat and human retinal pigment epithelial cells. FASEB J. 1997;11:859–867. doi: 10.1096/fasebj.11.11.9285484. [DOI] [PubMed] [Google Scholar]
- Tait AR, Straus SK. Phosphorylation of U24 from Human Herpes Virus type 6 (HHV-6) and its potential role in mimicking myelin basic protein (MBP) in multiple sclerosis. FEBS Lett. 2008;582:2685–2688. doi: 10.1016/j.febslet.2008.06.050. [DOI] [PubMed] [Google Scholar]
- Umemori H, Sato S, Yagi T, Aizawa S, Yamamoto T. Initial events of myelination involve Fyn tyrosine kinase signalling. Nature. 1994;367:572–576. doi: 10.1038/367572a0. [DOI] [PubMed] [Google Scholar]
- Umemori H, Kadowaki Y, Hirosawa K, Yoshida Y, Hironaka K, Okano H, Yamamoto T. Stimulation of myelin basic protein gene transcription by Fyn tyrosine kinase for myelination. J Neurosci. 1999;19:1393–1397. doi: 10.1523/JNEUROSCI.19-04-01393.1999. [DOI] [PMC free article] [PubMed] [Google Scholar]
- Velazquez-Campoy A, Leavitt SA, Freire E. Characterization of protein–protein interactions by isothermal titration calorimetry. Methods Mol Biol. 2004;261:35–54. doi: 10.1385/1-59259-762-9:035. [DOI] [PubMed] [Google Scholar]
- Verity AN, Bredesen D, Vonderscher C, Handley VW, Campagnoni AT. Expression of myelin protein genes and other myelin components in an oligodendrocytic cell line conditionally immortalized with a temperature-sensitive retrovirus. J Neurochem. 1993;60:577–587. doi: 10.1111/j.1471-4159.1993.tb03188.x. [DOI] [PubMed] [Google Scholar]
- White R, Gonsior C, Kramer-Albers EM, Stohr N, Huttelmaier S, Trotter J. Activation of oligodendroglial Fyn kinase enhances translation of mRNAs transported in hnRNP A2-dependent RNA granules. J Cell Biol. 2008;181:579–586. doi: 10.1083/jcb.200706164. [DOI] [PMC free article] [PubMed] [Google Scholar]
- Yu JS, Yang SD. Protein kinase FA/glycogen synthase kinase-3 predominantly phosphorylates the in vivo site Thr97-Pro in brain myelin basic protein: evidence for Thr-Pro and Ser-Arg-X-X-Ser as consensus sequence motifs. J Neurochem. 1994;62:1596–1603. doi: 10.1046/j.1471-4159.1994.62041596.x. [DOI] [PubMed] [Google Scholar]
Associated Data
This section collects any data citations, data availability statements, or supplementary materials included in this article.