

Abstract
It has been estimated that 30% of eukaryotic protein and 70% of transcription factors are intrinsically disordered (ID). The biochemical significance of proteins that lack stable tertiary structure, however, is not clearly understood, largely owing to an inability to assign well-defined structures to specific biological tasks. In an attempt to investigate the structural character of ID protein, we have measured the circular dichroism spectrum of the N-terminal region of p53 over a range of temperatures and solution conditions. p53 is a well-studied transcription factor that has a proline-rich N-terminal ID region containing two activation domains. High proline content is a property commonly associated with ID, and thus p53 may be a good model system for investigating the biochemical importance of ID. The spectra presented here suggest that the N-terminal region of p53 may adopt an ordered structure under physiological conditions and that this structure can be thermally unfolded in an apparent two-state manner. The midpoint temperature for this thermal unfolding of the N-terminal region of p53 was at the near-physiological temperature of 39°C, suggesting the possibility of a physiological role for the observed structural equilibrium.
Keywords: p53, intrinsically disordered protein, ID, thermal unfolding
Introduction
Proteins that are intrinsically disordered (ID) and lack stable tertiary structure under physiological conditions are abundant in biological systems.1–3 The physical basis for this odd structural motif, unfortunately, is not clearly understood1,4 and its descriptions are mostly speculative.5,6 Classical descriptions of functional biology stress the importance of ordered chemical structures,7–9 which contrasts dramatically with ID. Further, denaturation of folded protein usually results in a loss of function,10 reinforcing a structural view of biological activity. The observation that ID proteins are common,1–3 biologically active,4 and often have regulatory roles mediating important signaling pathways11 thus was not expected.
An important advance in studying ID protein has been the recognition that naturally occurring osmolytes like trimethylamine N-oxide (TMAO) could force fold proteins that are thermodynamically unstable,12 allowing for their structural and energetic characterization.13–15 The central idea of this strategy is that conformationally flexible proteins, such as those that are ID, could become thermodynamically trapped into their active structures and then investigated in traditional structural terms. Presented here are the results of studying the effects of TMAO and urea on the structure and thermodynamic stability of the N-terminal ID region of the tumor suppressor protein p53. The p53 protein is a conserved transcription factor found in multicellular organisms that mediates a regulatory pathway responsible for maintaining genomic integrity.16–18 Most transcription factors are thought to be ID,11 and p53 likewise contains large domains that lack tertiary structure under physiological conditions.19–21 Thus, this protein may be a model for how the ID motif is used in regulatory processes. In addition, the N-terminal ID region of p53 is rich in proline, a property that has been associated with ID.11
The results of our study suggest that a protein fragment consisting of the N-terminal ID region of p53, p53(1–93), adopts an ordered structure under normal solution conditions. Thermal perturbations applied to this structure appeared to cause two-state unfolding and produced a weakly cooperative denaturation profile. Thermodynamic analysis of the denaturation gave an unfolding enthalpy, heat capacity change, and midpoint temperature of unfolding (Tm) that can be used to quantitate the stability of p53(1–93). With the exception of the Tm value, the uncertainties in the measured thermodynamic parameters were large, limiting their statistical value. It is worth noting that the measured Tm was 39°C, demonstrating that the folding equilibrium for p53(1–93) was most sensitive near physiological temperatures, making the intriguing implication of a possible functional basis or relation.
Results
Human recombinant p53(1–93) was expressed in bacteria and isolated from cell lysate. The purity of the isolated 10.1 kDa protein fragment was judged to be ∼ 95% from sodium dodecyl sulfate polyacrylamide gel electrophoresis (SDS-PAGE) imaged by coomassie stain [Fig. 1(A)]. The electrophoretic mobility of p53 is less than other similarly sized proteins, owing to the high number of proline residues in the N-terminal region.22 A reduced electrophoretic mobility was also observed for p53(1–93), and surprisingly the fragment containing a histidine tag migrated to a lower position in the gel than without the histidine tag. Because of these atypical results using SDS-PAGE, the identity of p53(1–93) was tested using the monoclonal antibody D0-1 (Santa Cruz Biotechnology) whose epitope maps to residues 11–25 of human p53. This antibody was observed to bind p53(1–93), both with and without the histidine tag, using standard Western blot techniques (data not shown), suggesting that the protein isolated from bacterial lysate was indeed p53(1–93). Similarly, the molecular weight of purified p53(1–93), both with and without the histidine tag, was measured by mass spectroscopy using matrix-assisted laser desorption/ionization time-of-flight (MALDI-TOF). The molecular weights measured were 10.103 and 12.068 kDa for p53(1–93), without and with the histidine tag, respectively, and were consistent with molecular weights calculated from amino acid sequence.
Figure 1.
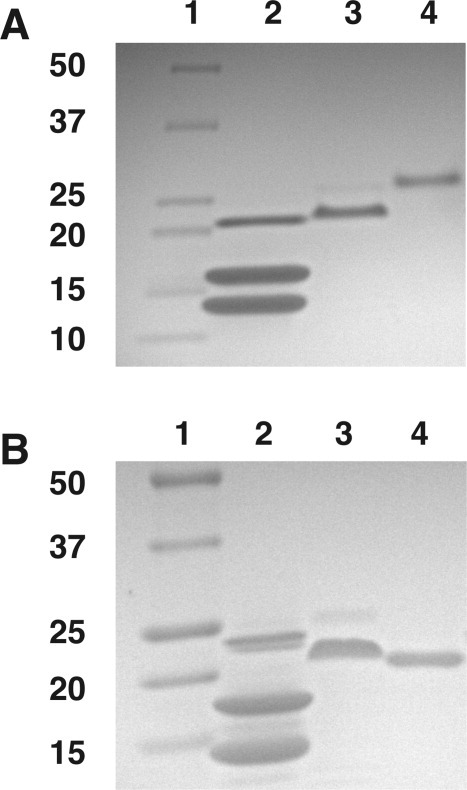
Temperature-dependent electrophoretic mobility of p53(1–93). Shown are gel images obtained by SDS-PAGE performed at (A) 10°C and (B) 40°C. In each gel image, lane 1 contained protein standards with molecular weights in kilodaltons (kDa) as indicated, and lane 2 contained a mixture of purified recombinant human prion protein (22.8 kDa), staphylococcal nuclease (16.8 kDa), and recombinant human lysozyme (14.7 kDa) used as controls. Lane 3 in both images contained purified recombinant p53(1–93) with the N-terminal histidine tag intact, and lane 4 contained purified p53(1–93) after the histidine tag was removed by thrombin digestion.
The electrophoretic mobility of p53(1–93) was temperature dependent. This is shown in Figure 1(B) in which SDS-PAGE was performed at 40°C rather than at 10°C as shown in Figure 1(A). It was apparent in the gel images that p53(1–93) still had reduced mobility relative to similarly sized proteins, but less at elevated temperatures. Also, at higher temperatures, p53(1–93) electrophoresed to a lower gel position relative to its histidine-tagged version. Overall, these data suggest that p53(1–93) adopts an extended structure, causing reduced electrophoretic mobility, but as temperatures were increased, p53(1–93) began to display characteristics more consistent with detergent denatured protein in general.
To test the temperature sensitivity of p53(1–93) structure under more normal solution conditions, its CD spectrum was measured in a phosphate-buffered solution (10 mM sodium phosphate, 100 mM sodium chloride, pH = 7) over the temperature range of 5–85°C. The results of these measurements are shown in Figure 2. A local maximum in the CD spectra was observed at ∼221 nm [Fig. 2(C)], which is typically seen in proteins folded into polyproline II (PII) helix,23–25 suggesting that the PII structure is favored by p53(1–93). This result should not be considered surprising as 24% of the residues in p53(1–93) are proline. Similarly, analysis of the spectrum measured at 5°C using the CDPro software package26 predicted 12–17% PII content, depending on the algorithm (e.g., CONTIN/LL, CDSSTR) and basis set used (data not shown). The measurement of NMR residual dipolar couplings has also shown that p53(1–93) prefers PII,21 and these CD data are consistent with the electrophoretic mobility of p53(1–93) (Fig. 1). Relative to the dimensions typical of denatured protein,27 the PII structure is rigid and extended, with a helical pitch of ∼3.1 Å per residue.28,29
Figure 2.
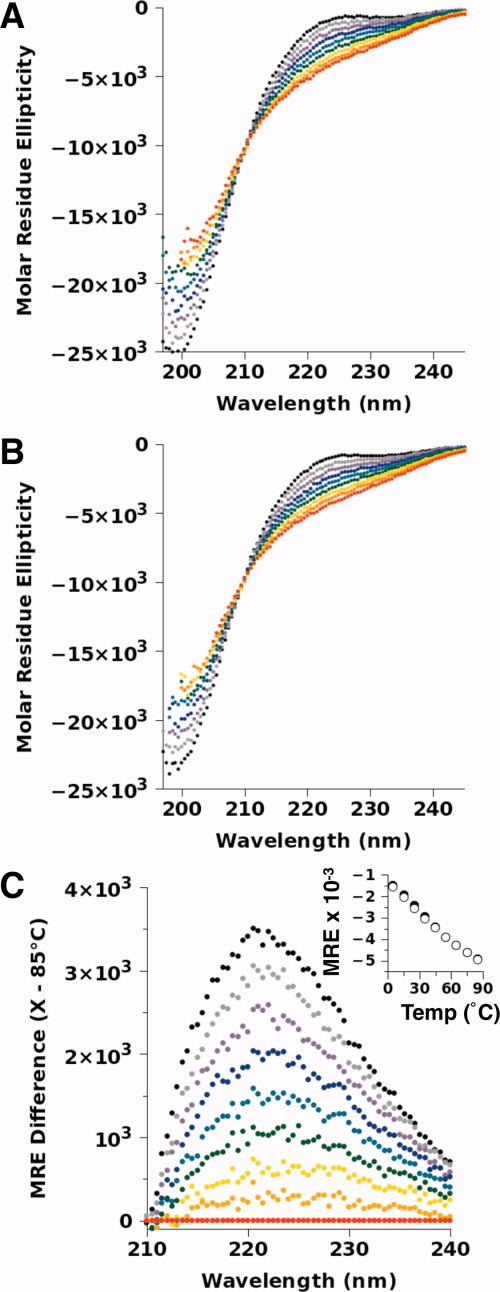
Temperature-dependent CD spectrum of p53(1–93). The spectra for (A) p53(1–93) and (B) p53(1–93) with an N-terminal histidine tag were measured in 10 mM sodium phosphate, 100 mM sodium chloride, pH 7, at the temperatures of 5°C (black), 15°C (gray), 25°C (purple), 35°C (blue), 45°C (blue–green), 55°C (green), 65°C (yellow), 75°C (orange), and 85°C (red). The CD values are reported in molar residue ellipticity using the units of deg cm2 dmol−1 res−1. The concentration of p53(1–93) in each sample was 20 μM (∼ 0.2 mg/mL). (C) The difference in the molar residue ellipticity (MRE) between the p53(1–93) spectra at each temperature relative to the 85°C spectrum, demonstrating that a local maximum occurs at ∼ 221 nm. The temperature dependence of this local maximum, determined by averaging the measured MRE values from 220–222 nm in (A) and (B), is given in the inset for p53(1–93) (open circles) and histidine-tagged p53(1–93) (filled circles).
It was observed that increased temperatures gradually decreased the height of the local maximum at 221 nm (inset, Fig. 2(C)) and gradually increased a minimum at 200 nm. The observed effects of temperature on p53(1–93) were reversible and its CD spectrum displayed an isochromatic point at 210 nm. These results suggest that p53(1–93) may have a preferred, ordered structure that is primarily PII, and phenomenologically behaves as if it is in an apparent two-state equilibrium with a denatured state (or macrostate). At low temperatures, the equilibrium appears to favor a PII-like ordered macrostate, and at higher temperatures, a denatured macrostate is favored. Using the 221-nm peak as a metric (inset, Fig. 2(C)), the temperature-induced decrease in the CD signal was mostly linear and constant throughout the temperature range tested, implying a noncooperative thermal unfolding for the p53(1–93) structure. Only a slight change in the temperature dependence of the 221-nm peak was noted, which is shown in the Figure 2(C) inset data as a slight break in the slope centered at ∼40°C. The presence of the histidine tag, which had pronounced effects on electrophoretic mobility (Fig. 1), had no significant effect on the CD spectrum of p53(1–93).
To test if the peak in the CD data at 221 nm was related to PII structure, the CD spectrum of p53(1–93) was measured in the presence of high urea concentrations (Fig. 3). Urea has been shown to induce PII structure in proteins, in general.25 It was observed that increasing concentrations of urea had the effect of increasing the height of the 221-nm peak, consistent with the idea that this peak is associated with PII structure. In contrast, the natural osmolyte TMAO had the opposite effect. TMAO has been shown to push protein conformational equilibria away from extended, backbone-solvated states, and toward more compact structures.30,31 Consequently, the addition of TMAO should destabilize the PII-like macrostate, reducing the height of the 221-nm peak, which is what was observed.
Figure 3.
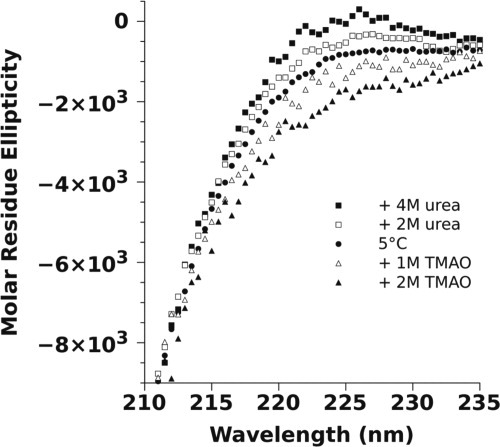
The effect of urea and TMAO on the CD spectrum of p53(1–93). The spectra for p53(1–93) were measured at 5°C in 10 mM sodium phosphate, 100 mM sodium chloride, pH 7, plus urea or TMAO as indicated in the figure. The CD values are reported in molar residue ellipticity using the units of deg cm2 dmol−1 res−1. The concentration of p53(1–93) in each sample ranged from 11 to 22 μM (∼ 0.1–0.2 mg/mL).
The effects on p53(1–93) caused by urea and TMAO appeared to be additive. Figure 4(A) shows that the presence of urea could offset the effects of TMAO, and vice versa, on p53(1–93)'s CD spectrum. Similarly, high temperatures, which seemed to push the structural equilibrium away from the PII macrostate (Fig. 2), could reproduce the p53(1–93) spectrum at lower temperatures, but in the presence of TMAO [Fig. 4(B)]. Also, the addition of urea, which favored PII, mirrored the effect of lowering temperatures, which also seemed to promote PII [Fig. 4(C)]. Surprisingly, these results seemed to suggest that the perturbations of urea, TMAO, and temperature on p53(1–93) structure were individually additive with each other, reinforcing the notion of a phenomenologically two-state equilibrium. Lowering temperatures or adding urea favored the PII macrostate, whereas increasing temperatures or adding TMAO destabilized the PII macrostate in favor of an alternative, denatured macrostate.
Figure 4.
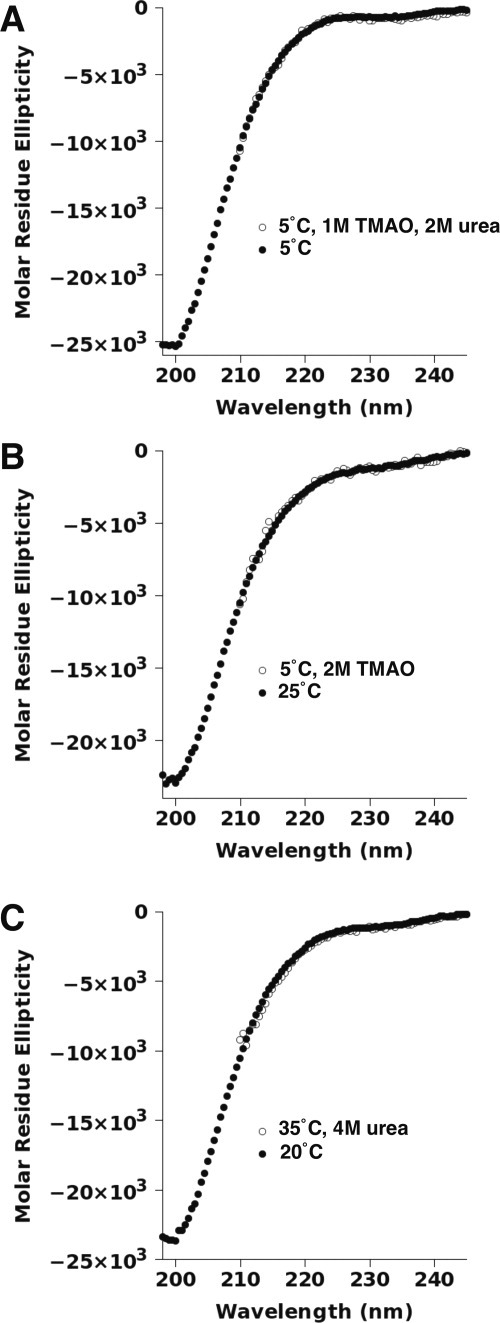
Comparison of solute and temperature effects on the CD spectrum of p53(1–93). The spectra for p53(1–93) shown in (A–C) were measured in 10 mM sodium phosphate, 100 mM sodium chloride, pH 7, at the temperatures and concentrations of urea and TMAO indicated. The CD values are reported in molar residue ellipticity using the units of deg cm2 dmol−1 res−1. The concentration of p53(1–93) in each sample ranged from 11 to 22 μM (∼0.1–0.2 mg/mL).
It is worth noting that the ability of urea and TMAO to affect p53(1–93)'s conformational equilibrium was much greater at lower temperatures than at higher temperatures. This is shown in Figure 5. A possible explanation for this result is that very high temperatures may unfold p53(1–93) to a common denatured macrostate, independent of urea or TMAO concentration. The temperature dependence of the 221-nm CD peak, when measured in the presence of 2M TMAO, however, had a slight sigmoidal shape to the thermally induced transition, an observation that suggested a weakly cooperative unfolding mechanism between the PII macrostate and the denatured macrostate under these conditions. Thermodynamic analysis of this unfolding transition assumed two-state behavior and yielded an unfolding midpoint temperature of 38.7°C (±2.4°C), an unfolding enthalpy of 32.1 kcal/mol (±11.5 kcal/mol), and a heat capacity change of −520 cal/mol (±1274 cal/mol). The large uncertainties in the thermodynamic parameters that were obtained indicate that this analysis may have little statistical value. It is interesting to note, however, that p53(1–93)'s structural equilibrium was centered on physiological temperatures, suggesting a possible physiological role for the observed structure changes.
Figure 5.
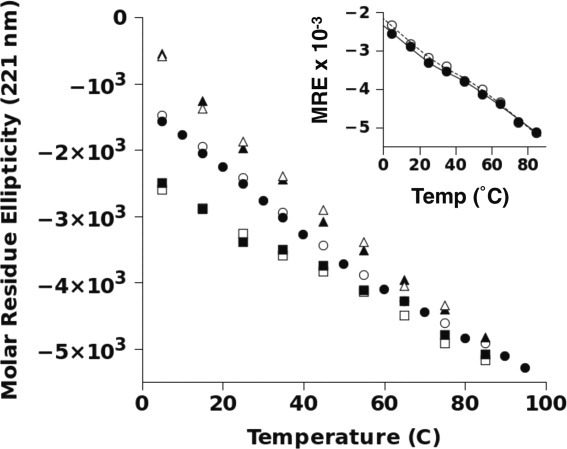
Temperature dependence of the molar residue ellipticity at 221 nm for p53(1–93). The MRE at 221 nm was determined by averaging the measured MRE values from 220–222 nm for p53(1–93) in 10 mM sodium phosphate, 100 mM sodium chloride, pH 7, (circles) plus 4M urea (triangles) or 2M TMAO (squares). The MRE values are reported in units of deg cm2 dmol−1 res−1. The concentration of p53(1–93) in each sample ranged from 11 to 22 μM (∼ 0.1–0.2 mg/mL). The filled and open symbols refer to separate samples of p53(1–93), shown to highlight variability in replicate measurements. The inset reproduces the temperature dependence of the MRE at 221 nm in 2M TMAO for p53(1–93) (filled circles), in which the replicate measurements at each temperature were averaged. The solid line represents a fit of these data to Eq. (1) to extract thermodynamic parameters. These measurements were repeated using histidine-tagged p53(1–93) (open circles), resulting in a fit to Eq. (1) given by the dashed line. The thermodynamic parameters determined from fitting these two datasets are summarized in Table I.
Also interesting was the measurement of a negative heat capacity (ΔCp). Thermal denaturation of folded protein typically yields positive heat capacities, which has been correlated with increased solvent-accessible surface area in the heat-denatured state relative to native structure.32 For p53(1–93), the data presented here are suggestive of a thermally driven transition between an extended PII-like structure and a denatured macrostate more closely resembling a statistical coil. Such a structural transition would likely produce a high-temperature denatured state of smaller dimensions than the low-temperature macrostate. Other ID proteins have been observed to denature by heat to states more compact than their low-temperature counterparts, as measured by small angle X-ray scattering.33 A similar explanation for p53(1–93) thus is certainly possible and may explain the negative ΔCp, as well as its temperature-dependent electrophoretic mobility.
The temperature sensitivity of the CD spectrum of p53(1–93) containing an N-terminal histidine tag was also measured in the presence and absence of urea and TMAO, yielding similar results (data not shown). The inset of Figure 5 summarizes the combined effect of temperature and 2M TMAO on histidine-tagged p53(1–93). The thermodynamic parameters that describe the thermal unfolding of histidine-tagged p53(1–93) in 2M TMAO are given in Table I.
Table I.
Thermodynamic Parameters That Describe the Thermal Unfolding of p53(1–93) and Its Histidine Tagged Variant, Measured in 2M TMAO
| Tm (°C) | ΔH (kcal mol−1) | ΔCp (cal mol−1 K−1) | |
|---|---|---|---|
| p53(1–93) | 38.7 ± 2.4 | 32.1 ± 11.5 | −520 ± 1274 |
| p53(1–93)+HT | 38.9 ± 3.2 | 28.3 ± 10.3 | −67 ± 1615 |
HT, histidine tagged.
Discussion
The molecular mechanisms employed by ID proteins in the performance of their biological functions are largely unknown owing to the practical difficulties associated with quantifying the structure and energetics of proteins that lack tertiary stability. To explore structural properties that may be typical of the ID motif, the N-terminal region of p53 was studied using CD spectroscopy. The p53 protein was chosen for our model system because ID seems to be prominent among transcriptions factors and correlates with high proline content.11 p53 is a well-studied transcription factor that has a large, proline-rich ID region, and thus this protein may use ID in a biologically common manner.
Here, it was shown that the structure and thermodynamics of a proline-rich ID protein could be characterized using CD spectroscopy and the solutes urea and TMAO. The data seemed to suggest that temperature modulates a structural equilibrium between two macrostates: an ordered “native” state with PII-like character and a heat-induced “denatured” state. It has been reported that p53(1–93) has no apparent tertiary structure, as near-UV CD measurements gave negligible readings at 20°C.20 Consequently, the low-temperature structure of p53(1–93) detected at far-UV wavelengths likely reflects ordering of the peptide backbone into an extended state with insignificant folding into compact tertiary structures.
Surprisingly, the temperature-modulated equilibrium for p53(1–93)'s structure appeared to have two-state character and gave a weakly cooperative unfolding transition in the presence of 2M TMAO. A thermodynamic analysis of this unfolding transition resulted in statistically uncertain values, but clearly showed that the equilibrium between the native and the denatured macrostates of p53(1–93) could be affected in the physiological range of temperatures. Specifically, this result demonstrated that the folding equilibrium for p53(1–93) was sensitive to solvent cofactors at normal temperatures. Whether or not such perturbations to p53(1–93) structure mirror physiological events of functional significance, however, have yet to be determined. But such studies may yield important insights on the natural selection of ID as a biological motif1–3 and the observed sequence preference for proline in ID segments of protein.11
Methods
Bacterial expression and purification of p53(1-93)
A gene coding for residues 1–93 of human p53 and including an N-terminal histidine tag and thrombin cleavage site (MRGSHHHHHHSSGLVPRGS-p53(1–93)) was cloned into a plasmid expression vector by DNA 2.0 (Menlo Park, California). Escherichia coli cells transformed with plasmid containing the p53(1–93) gene were incubated overnight at 30°C in 20 mL of sterile lysogeny broth (LB) containing 100 μg/mL of ampicillin and then transferred to 1 L of fresh LB + ampicillin and incubated at 37°C to an optical density of 0.6 at 600 nm. Isopropyl β-d-1-thiogalactopyranoside was then added to a concentration of 1 mM and the culture incubated for an additional 4 h. At that point, the cells were harvested by centrifugation. Pelleted cells were lysed by sonication in 6M guanidine hydrochloride, 10 mM Tris-HCl, 100 mM sodium phosphate, pH 8.0, then centrifuged and the supernatant loaded onto a nickel affinity column pre-equilibrated with the lysis buffer. After washing the column with five bed volumes of lysis buffer, the column was further washed using five bed volumes of 10 mM Tris-HCl, 100 mM sodium phosphate, pH 8.0, followed by an additional five bed volumes of the same buffer containing 10 mM imidazole. p53(1–93) was then eluted from the column using 10 mM Tris-HCl, 100 mM sodium phosphate, 350 mM imidazole, pH 4.3. The eluted protein was dialyzed overnight against 20 mM Tris-HCl, 100 mM sodium chloride, pH 8, at 4°C. Next, p53(1–93) was digested using thrombin to remove the histidine tag and loaded onto a DE52 column equilibrated with 20 mM sodium acetate, 25 mM sodium chloride, pH 4.8. p53(1–93) was eluted off this column using a sodium chloride gradient, and dialyzed overnight against 10 mM sodium phosphate, 100 mM sodium chloride, pH 7, at 4°C.
Sodium dodecyl sulfate polyacrylamide gel electrophoresis
SDS-PAGE experiments used 4–20% precast Tris-HCl polyacrylamide gels purchased from Bio-Rad Laboratories (Hercules, CA) and tank buffer consisting of 25 mM Tris, 192 mM glycine, 0.1% SDS, pH 8.3. Gel and tank buffer in an assembled electrophoresis rig were incubated at 10 or 40°C for 3 h to pre-equilibrate the system to the desired temperature. At both temperatures, electrophoresis caused an increase of ∼8°C in the tank buffer over the course of the experiment (∼1 h). Directly prior to electrophoresis, all samples were mixed at a ratio of 1:1 with a 2× Laemmli buffer solution consisting of 62.5 mM Tris-HCl (pH 6.8), 25% glycerol, 2% SDS, 5% β-mercaptoethanol, and 0.01% bromophenol blue, and then boiled for 5 min.
Western blots
Protein samples were separated using standard SDS-PAGE, as described above but at room temperature and without the 3-h temperature-equilibration step. Following SDS-PAGE, samples were electroblotted into nitrocellulose and probed using the monoclonal antibody D0-1 from Santa Cruz Biotechnology (Santa Cruz, CA) at a 1:5000 dilution. The immunoreactive bands were visualized using an ECL Plus chemiluminescence kit from GE Healthcare (Piscataway, NJ) and imaged with a FOTO/Analyst FX imager from Fotodyne (Hartland, WI).
Mass spectroscopy
Molecular mass determination of protein samples was carried out using MALDI-TOF MS analysis. p53(1–93) with and without the histidine tag was mixed at a ratio of 1:1 with matrix and applied to an AnchorChip target using the overlayer method. The matrix consisted of sinapinic acid saturated acetonitrile and 0.1% trifluoroacetic acid, mixed at a ratio of 1:2. An externally calibrated Autoflex II MALDI TOF/TOF™ (Bruker Daltonics, Bremen, Germany) instrument was utilized in linear mode to collect the mass spectral data.
CD spectroscopy
CD spectra were recorded using a Jasco J-710 spectropolarimeter equipped with a PFD-425S peltier unit (Jasco, Easton, MD) and employed a 1-mm path-length quartz cuvette. Samples were equilibrated at each temperature for 10 min. Spectra were collected with a resolution of 0.5 nm, a scan rate of 20 nm/min, and were the average of eight scans. Reported spectra were baseline corrected for solvent and buffer contributions.
Temperature denaturation analysis
Heat unfolding was analyzed assuming a two-state denaturation transition. For two-state behavior, the measured optical signal can be expressed as,
| (1) |
where yl and yh are linear baselines observed at low and high temperatures, respectively, and,
| (2) |
In Eq. (2), ΔH is the enthalpy of unfolding, ΔCp is the heat capacity change for the unfolding transition, and Tm is the midpoint temperature for the unfolding transition. CD-monitored thermal unfolding was fit to Eq. (1) using the nonlinear least-squares Marquardt–Levenberg algorithm as implemented in the gnuplot computer program (gnuplot.sourceforge.net).
References
- 1.Ward JJ, Sodhi JS, McGuffin LJ, Buxton BF, Jones DT. Prediction and functional analysis of native disorder in proteins from the three kingdoms of life. J Mol Biol. 2004;337:635–645. doi: 10.1016/j.jmb.2004.02.002. [DOI] [PubMed] [Google Scholar]
- 2.Dunker AK, Obradovic Z, Romero P, Garner EC, Brown CJ. Intrinsic protein disorder in complete genomes. Genome Inf Ser. 2000;11:161–171. [PubMed] [Google Scholar]
- 3.Oldfield CJ, Cheng Y, Cortese MS, Brown CJ, Uversky VN, Dunker AK. Comparing and combining predictors of mostly disordered proteins. Biochemistry. 2005;44:1989–2000. doi: 10.1021/bi047993o. [DOI] [PubMed] [Google Scholar]
- 4.Wright PE, Dyson HJ. Intrinsically unstructured proteins: re-assessing the protein structure-function paradigm. J Mol Biol. 1999;293:321–331. doi: 10.1006/jmbi.1999.3110. [DOI] [PubMed] [Google Scholar]
- 5.Hilser VJ, Thompson EB. Intrinsic disorder as a mechanism to optimize allosteric coupling in proteins. Proc Natl Acad Sci USA. 2007;104:8311–8315. doi: 10.1073/pnas.0700329104. [DOI] [PMC free article] [PubMed] [Google Scholar]
- 6.Motlagh HN, Hilser VJ. Agonism/antagonism switching in allosteric ensembles. Proc Natl Acad Sci USA. 2012;109:4134–4139. doi: 10.1073/pnas.1120519109. [DOI] [PMC free article] [PubMed] [Google Scholar]
- 7.Perutz MF. Stereochemistry of cooperative effects in haemoglobin. Nature. 1970;228:726–739. doi: 10.1038/228726a0. [DOI] [PubMed] [Google Scholar]
- 8.Bray D, Duke T. Conformational spread: the propagation of allosteric states in large multiprotein complexes. Annu Rev Biophys Biomol Struct. 2004;33:53–73. doi: 10.1146/annurev.biophys.33.110502.132703. [DOI] [PubMed] [Google Scholar]
- 9.Changeux JP, Edelstein SJ. Allosteric mechanisms of signal transduction. Science. 2005;308:1424–1428. doi: 10.1126/science.1108595. [DOI] [PubMed] [Google Scholar]
- 10.Pace CN. The stability of globular proteins. CRC Crit Rev Biochem. 1975;3:1–43. doi: 10.3109/10409237509102551. [DOI] [PubMed] [Google Scholar]
- 11.Liu J, Perumal NB, Oldfield CJ, Su EW, Uversky VN, Dunker AK. Intrinsic disorder in transcription factors. Biochemistry. 2006;45:6873–6888. doi: 10.1021/bi0602718. [DOI] [PMC free article] [PubMed] [Google Scholar]
- 12.Baskakov I, Bolen DW. Forcing thermodynamically unfolded proteins to fold. J Biol Chem. 1998;273:4831–4834. doi: 10.1074/jbc.273.9.4831. [DOI] [PubMed] [Google Scholar]
- 13.Baskakov IV, Kumar R, Srinivasan G, Ji YS, Bolen DW, Thompson EB. Trimethylamine N-oxide-induced cooperative folding of an intrinsically unfolded transcription-activating fragment of human glucocorticoid receptor. J Biol Chem. 1999;274:10693–10696. doi: 10.1074/jbc.274.16.10693. [DOI] [PubMed] [Google Scholar]
- 14.Mello CC, Barrick D. Measuring the stability of partly folded proteins using TMAO. Protein Sci. 2003;12:1522–1529. doi: 10.1110/ps.0372903. [DOI] [PMC free article] [PubMed] [Google Scholar]
- 15.Li J, Motlagh HN, Chakuroff C, Thompson EB, Hilser VJ. Thermodynamic dissection of the intrinsically disordered N-terminal domain of human glucocorticoid receptor. J Biol Chem. 2012;287:26777–26787. doi: 10.1074/jbc.M112.355651. [DOI] [PMC free article] [PubMed] [Google Scholar]
- 16.Lane DP. p53, Guardian of the genome. Nature. 1992;358:15–16. doi: 10.1038/358015a0. [DOI] [PubMed] [Google Scholar]
- 17.Levine AJ. p53, The cellular gatekeeper for growth and division. Cell. 1997;88:323–331. doi: 10.1016/s0092-8674(00)81871-1. [DOI] [PubMed] [Google Scholar]
- 18.Vousden KH, Lu X. Live or let die: the cell's response to p53. Nat Rev Cancer. 2002;2:594–604. doi: 10.1038/nrc864. [DOI] [PubMed] [Google Scholar]
- 19.Bell S, Klein C, Müller L, Hansen S, Buchner J. p53 Contains large unstructured regions in its native state. J Mol Biol. 2002;322:917–927. doi: 10.1016/s0022-2836(02)00848-3. [DOI] [PubMed] [Google Scholar]
- 20.Dawson R, Müller L, Dehner A, Klein C, Kessler H, Buchner J. The N-terminal domain of p53 is natively unfolded. J Mol Biol. 2003;332:1131–1141. doi: 10.1016/j.jmb.2003.08.008. [DOI] [PubMed] [Google Scholar]
- 21.Wells M, Tidow H, Rutherford TJ, Markwick P, Jensen MR, Mylonas E, Svergun DI, Blackledge M, Fersht AR. Structure of tumor suppressor p53 and its intrinsically disordered N-terminal transactivation domain. Proc Natl Acad Sci USA. 2008;105:5762–5767. doi: 10.1073/pnas.0801353105. [DOI] [PMC free article] [PubMed] [Google Scholar]
- 22.Wang P, Reed M, Wang Y, Mayr G, Stenger JE, Anderson ME, Schwedes JF, Tegtmeyer P. p53 Domains: structure, oligomerization, and transformation. Mol Cell Biol. 1994;14:5182–5191. doi: 10.1128/mcb.14.8.5182. [DOI] [PMC free article] [PubMed] [Google Scholar]
- 23.Woody RW. Circular dichroism and conformation of unordered polypeptides. Adv Biophys Chem. 1992;2:37–79. [Google Scholar]
- 24.Rucker AL, Creamer TP. Polyproline II helical structure in protein unfolded states: lysine peptides revisited. Protein Sci. 2002;11:980–985. doi: 10.1110/ps.4550102. [DOI] [PMC free article] [PubMed] [Google Scholar]
- 25.Whittington SJ, Chellgren BW, Hermann VM, Creamer TP. Urea promotes polyproline II helix formation: implications for protein denatured states. Biochemistry. 2005;44:6269–6275. doi: 10.1021/bi050124u. [DOI] [PubMed] [Google Scholar]
- 26.Sreerama N, Woody RW. Estimation of protein secondary structure from CD spectra: comparison of CONTIN, SELCON and CDSSTR methods with an expanded reference set. Anal Biochem. 2000;287:252–260. doi: 10.1006/abio.2000.4880. [DOI] [PubMed] [Google Scholar]
- 27.Kohn JE, Millett IS, Jacob J, Zagrovic B, Dillon TM, Cingel N, Dothager RS, Seifert S, Thiyagarajan P, Sosnick TR, Hasan MZ, Pande VS, Ruczinski I, Doniach S, Plaxco KW. Random-coil behavior and the dimensions of chemically unfolded proteins. Proc Natl Acad Sci USA. 2004;101:12491–12496. doi: 10.1073/pnas.0403643101. [DOI] [PMC free article] [PubMed] [Google Scholar]
- 28.Arnott S, Dover SD. The structure of poly-L-proline II. Acta Cryst. 1968;B24:599–601. doi: 10.1107/s056774086800289x. [DOI] [PubMed] [Google Scholar]
- 29.Sasisekharan V. Structure of poly-L-proline II. Acta Cryst. 1959;12:897–903. [Google Scholar]
- 30.Wang A, Bolen DW. A naturally occurring protective system in urea-rich cells: mechanism of osmolyte protection of proteins against urea denaturation. Biochemistry. 1997;36:9101–9108. doi: 10.1021/bi970247h. [DOI] [PubMed] [Google Scholar]
- 31.Auton M, Bolen DW. Predicting the energetics of osmolyte-induced protein folding/unfolding. Proc Natl Acad Sci USA. 2005;102:15065–15068. doi: 10.1073/pnas.0507053102. [DOI] [PMC free article] [PubMed] [Google Scholar]
- 32.Myers JK, Pace CN, Scholtz JM. Denaturant m values and heat capacity changes: relation to changes in accessible surface areas of protein unfolding. Protein Sci. 1995;4:2138–2148. doi: 10.1002/pro.5560041020. [DOI] [PMC free article] [PubMed] [Google Scholar]
- 33.Kjaergaard M, Nørholm AB, Hendus-Altenburger R, Pedersen SF, Poulsen FM, Kragelund BB. Temperature-dependent structural changes in intrinsically disordered proteins: formation of alpha-helices or loss of polyproline II? Protein Sci. 2010;19:1555–1564. doi: 10.1002/pro.435. [DOI] [PMC free article] [PubMed] [Google Scholar]