

Abstract
The ribosome is a ribozyme. However, in bacterial ribosomes, the N-terminus of L27 is located within the peptidyl transfer center. The roles of this protein in real time remain unclear. We present single-molecule fluorescence resonance energy transfer (FRET) studies of tRNA dynamics at the peptidyl transfer center in ribosomes containing either wild type (WT) L27, or L27 mutants with A2H3, A2H3K4 or nine N-terminal residues removed. Removing L27's first three N-terminal residues or mutating a single residue, K4, reduces the formation of a stable peptidyl tRNA after translocation. These results imply that L27 stabilizes the peptidyl tRNA and residue K4 contributes significantly to the stabilization.
Keywords: single-molecule FRET, peptidyl transfer center, ribosomal protein L27, tRNA hybrid state, ribozyme
Introduction
The ribosome is a universal molecular machine that synthesizes proteins in all living cells. It consists of two subunits that are composed of three RNA scaffolds (120–4500 nucleotides) and 50–80 ribosomal proteins (25 to 300 amino acids).1 The ribosome catalyzes the peptidyl transfer reaction in which the α-amino group of the amino acid attached to the A-site tRNA attacks the ester bond between the polypeptide chain and the P-site tRNA. In this reaction, the peptidyl chain with one amino acid added is transferred from the P- to the A-site tRNA, yielding the pretranslocation complex. The elongation factor EF-G catalyzes the subsequent translocation process to ensure that the ribosome, together with its bound tRNAs, moves exactly one codon. The ribosome then reaches the post-translocation stage. Both the large (50S for bacterial ribosomes) and small (30S for bacterial ribosomes) subunits interact with the tRNAs. For this reason, each tRNA configuration is expressed as two letters separated by a slash, for example, A/A. The first and second letters refer to the tRNA binding site in the 30S and 50S, respectively.
In the pretranslocation complex, the ribosome undergoes an inter-subunit ratcheting motion.2 At the same time, tRNAs fluctuate between the “A/A-P/P “A/P-P/E” configurations, in which the peptidyl chain is attached on the A/A or A/P tRNA. The hybrid state, “A/P-P/E”, is the intermediate state between the pre- and the post- translocation ribosomes.3 In the post-translocation complex, the tRNAs are in the “P/P-E/E” configuration in which the peptidyl chain is attached to the P/P tRNA. Because the peptidyl tRNA moves into the P-site in the post-translocation complex, the ribosome's inter-subunit ratcheting and the tRNAs fluctuations are suppressed, which is referred to as ribosome “locking.”4,5 These alternative ribosome dynamics are essential to the ribosome's interactions with the proper protein factors and tRNA substrates and to translocation.6 However, the mechanism by which the ribosome detects the peptidyl tRNAs location to lock its conformation change is unknown. A recent Cryo-EM study at elevated temperature shows that the originally observed ribosome inter-subunit “locking” at 4°C disappears at 37°C.7 This observation indicates that at physiological conditions, the inter-subunit ratcheting is persistent in the elongation cycle. However, although the 30S subunit samples various inter-subunit angles, the peptidyl P-tRNA remains at a defined configuration, in contrast to the diverse configurations of deacylated P-site tRNA in the pretranslocation complex.7 This observation is in excellent agreement with single molecule observations at room temperature showing that peptidyl tRNA fluctuation and inter-subunit ratcheting are indeed persistent in the post-translocation complex, but the static peptidyl tRNA and nonratcheted configurations are most highly populated.5,8,9
Recent X-ray studies indicate that the L27s N-terminus protrudes into the peptidyl transfer center of bacterial ribosomes,10,11 which contrasts with the structure of archaeal ribosomes.12,13 The proximity of L27 to the tRNAs implies that it has a possible role in monitoring or regulating tRNA dynamics (Supporting Information Figure S1). However, how these interactions coordinate tRNA dynamics with the ribosome global conformational changes in real time is not known.
We have recently developed a single-molecule fluorescence resonance energy transfer (FRET) system that tethers one of two FRET-paired dyes on L27 with the other on a tRNA molecule (Supporting Information Figure S1).8,14 Consistent with the intrinsic heterogeneity of ribosomes, we have observed inhomogeneous ribosome subpopulations that are distinguished by their dynamics and FRET efficiency histograms. In the pretranslocation complex, the presences of deacylated tRNA at the P-site allows the classical-hybrid state fluctuation of the A-site tRNA (A/A ⇔ A/P), whereas in the post-translocation complex, the major ribosome subpopulation is static in the “P/P” configuration. These observations are consistent with the ribosome “locking” process discussed above.4
In this report, we studied the role of L27 in real time by mutagenesis. Specifically, we have systematically removed the N-terminal residues of L27 because these residues are within H-bonding distances to the A- and P-site tRNAs. In the pretranslocation complex, the tRNAs can adapt at least three configurations: A/A-P/P (the classical state, abbreviated as C state, FRET = 0.47), A/P-P/E (the putative hybrid state, abbreviated as Hy2 state, FRET = 0.68), and A/A-P/E (the additional hybrid state, abbreviated as Hy1 state, FRET = 0.2). In every individual ribosome, the samplings of these FRET states are unique and persistent during the 20-s acquisition period, which implies that ribosomes exist in different subpopulations. This observation is consistent with a time-resolved Cryo-EM study to show that the tRNA hybrid states and the ribosome inter-subunit ratcheting are only loosely coupled.7 Based on this structural information, the subpopulations we observed in this report can be assigned to various tRNA hybrid configurations in ribosomes with various inter-subunit ratcheting angles. The subpopulations can be understood with a rugged energy landscape model8,15: the native ribosome exists in multiple conformations separated by rugged but well-defined energy barriers that are not overcome by thermal fluctuations. Accordingly, we have characterized every ribosome by plotting each particle on 3D-coordinates representing the percentages of the three FRET states. We have found that ribosomes bearing mutated L27 are less likely to form a static configuration of the peptidyl tRNA after translocation. One reason for causing this deficiency is the lack of residue K4 in these mutants.
Results
Location of fluorescent dyes and single molecule data acquisition
Ribosomal protein L27 was labeled with Cy5 dye at the unique Cys residue at position 53,8 whereas tRNAPhe was labeled with Cy3 dye in the D-loop.16 According to the X-ray data,10 the distances between C53 and D16/17 of the A- and P-site tRNAs in the classical A/A and P/P states are 61 Å and 52 Å, respectively (Supporting Information Figure S1). We have measured the FRET efficiencies between the L27 and the A- or P-site tRNA being 0.47 and 0.68, respectively.8 The higher FRET agrees with the shorter distance between L27 (residue C53) and the P-site tRNA (D16/17). The ribosome complexes were tethered via the interaction of mRNA-biotin with a streptavidin-modified cover slip and illuminated by evanescent waves generated by a single-objective based total internal reflection.
Data analysis
All of the single ribosomes that were selected had signal-to-noise ratios higher than 4:1 and bleached in single steps (Supporting Information Figures S2a and S2b). The data were truncated a few points before the bleaching events by computer algorithms to remove artificial FRET signals from the donor crosstalk and baseline fluorescence intensities. The sequential bleaching of the acceptor and the donor, as well as the data cutoff points are highlighted in Supporting Information Figures S2a and S2b. FRET efficiencies were calculated according to the following equation: FRET = Iacceptor/(Iacceptor + Idonor). Therefore, the FRET efficiencies in this report are from the original experimental data without postacquisition modifications. The spectral crosstalk, which was measured with a donor-only labeled ribosome complex or after acceptor bleaching, was 0.045 ± 0.03. Without the removal of data points after donor bleaching, this FRET peak compromises the correct fitting of the true FRET states (Supporting Information Figure S2c). With the removal of these data points, most of the crosstalk and artificial FRET signals were removed (Supporting Information Figure S2d). Both nonfluctuating and fluctuating signals were observed. The fluctuating subpopulation is defined by an anticorrelative fluctuation between the donor and the acceptor fluorescence intensities (the Pearson's correlation coefficient < −0.6, Supporting Information Figure S2a). The nonfluctuating subpopulation is defined by the Pearson's correlation coefficient within ±0.15 between the donor and acceptor fluorescence intensities (Supporting Information Figure S2b).
FRET states assignment
Three FRET states, with values ∼ 0.2, 0.47, and 0.68, have been observed in the ribosome pretranslocation complexes (the A-site tRNA is labeled with the donor dye) corresponding to the: Hy1 (stands for hybrid state 1: A/A-P/E), C (stands for classic state: A/A-P/P), and Hy2 (stands for hybrid state 2: A/P-P/E) states (Fig. 1), respectively.8 After translocation, the labeled tRNA moves into the P/P position, which gives a FRET value of 0.68 (the same as the Hy2 state). However, we have observed that the Hy2 state constantly exchanges with the other FRET states. Therefore, it only exists in the fluctuating ribosomes. In contrast, the static 0.68 FRET state only exists in a dominant percentage in the post-translocation complexes. Therefore, we have assigned the static and fluctuating 0.68 FRET states to be the P/P and Hy2 configurations in the post- and pretranslocation complexes, respectively. About 5% of the ribosomes exhibit static 0.68 FRET state in the pretranslocation complex because of spontaneous translocation.
Figure 1.
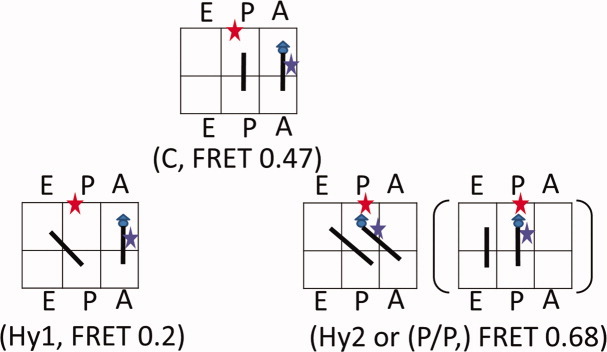
The assignment of tRNA configurations for the FRET states of 0.2, 0.47, and 0.68. The six boxes stand for tRNA binding sites in the 50S (top three) and the 30S (the bottom three), which are labeled with “A,” “P,” and “E,” respectively. The triangle and circle stand for formyl methionine and phenylalanine, respectively. In the Hy1 state, the tRNAs are in the A/A-P/E configuration; in the C state, the tRNAs are in the A/A/-P/P configuration; and in the Hy2 state, the tRNAs are in the A/P-P/E configuration. The FRET values are corresponding to the signals between L27 (residue C53 is labeled with Cy5, the red star) and the A-site labeled tRNA (position D16/17 is labeled with Cy3, the blue star). [Color figure can be viewed in the online issue, which is available at wileyonlinelibrary.com.]
The 0.47 and 0.68 FRET states correspond to labeled tRNAs that are bound at the 50S A- and P- sites because: (a) the FRET efficiencies are consistent with the crystallographic data,10 (b) the transition between the 0.47 and 0.68 FRET states correlates with the translocation process in real-time measurements, and the dynamic changes in the FRET states are consistent with the ribosome “locking” after translocation,8 and (c) the FRET efficiency correlates with the dye label location: labeling the A-site bound tRNAPhe or P-site bound tRNAfMet generates the major peaks at 0.47 or 0.68, respectively.14
Because there are only three stable tRNA binding sites inside the ribosomes,17 only three possible tRNA configurations can be assigned to the pretranslocation complex, as shown in the scheme in Figure 1. The 0.68 and 0.47 FRET states can be unambiguously assigned to the A/P-P/E (Hy2) and the A/A-P/P states (C), as discussed above. Thus, the only possible configuration for the 0.2 FRET state is the A/A-P/E state. Although there is no obvious translational displacement for the A/A-bound tRNA in this configuration, the low FRET value is possible if the tRNA rotates18 or L27 moves away. A recent structural study revealed a swinging motion of the L5/H84 stalk during the formation of some tRNA hybrid states.7 This stalk is located at the 50S central protuberance and networks with L27 via the 5S RNA.7 As shown in Supporting Information Figure S3, the movement of the L5/H84 stalk could propagate to L27 in the Hy1 state to result in the apparently low FRET value (0.2). During the Hy2 state formation, the L5/H84 stalk swings back, probably together with the 5S RNA and L27, restoring its interaction with the A/P tRNA. Consequently, the FRET efficiency in Hy2 is high (0.68).
Several single molecule results support our assignment of the Hy1 state:
The 0.2 FRET state is not due to inhomogeneous sample preparation. This FRET state interchanges with the C and Hy2 states in a single ribosome trace (Supporting Information Figure S2a). Therefore, it is a valid conformation on the ribosome's energy landscape.
In the ribosome complexes disfavoring the formation of the Hy2 state, (for example, when the peptidyl tRNA at the A-site is replaced with uncapped acylated-tRNA or uncharged tRNA, thereby inhibiting A/P tRNA formation), both the C and Hy1 states are promoted.8 In the ribosome complexes favoring the formation of the Hy2 state (for example, in the presence of the antibiotic viomycin to induce inter-subunit ribosome ratcheting), both the C and Hy1 states are diminished.14 These observations indicate that the Hy1 state is a valid tRNA conformation that is in direct competition with the C and Hy2 states.
The 0.2 FRET state is not due to Cy5 blinking because its percentages in different ribosome complexes change even under the exact same physical conditions, such as pH, laser power, and buffer.8,14 In addition, a photo-flickering signal is in constant fluctuation. On the other hand, the static 0.2 FRET state was always present in all of the pretranslocation complexes we studied.
In summary, we have observed three FRET states in the pretranslocation complex. Although more definite experiments, such as X-ray crystallography, are needed to confirm the atomic details of these FRET states, these states nevertheless reflect genuine tRNA configurations in active ribosomes.
Quantification of Rb-WT subpopulations based on the FRET state compositions
In every time-lapse FRET trace of Rb-WT (ribosomes bearing wild type L27), the sampling frequencies of the three FRET states (Hy1, C, and Hy2) are different, indicating the existence of multiple ribosome subpopulations with distinct local dynamics. To characterize the uniqueness of each ribosome, the FRET traces are analyzed by FRET efficiency histograms to determine the normalized composition of the FRET states. Figure 2(a) displays one example of the original fluorescence intensities from both the donor and the acceptor. The calculated FRET efficiencies are shown in Figure 2(b). Figure 2(c) displays the Gaussian fittings of the FRET efficiency histogram. The amount of each FRET state is calculated as the area underneath the Gaussian fitting curve. The composition of the Hy1, C, and Hy2 states are calculated to be 55%, 27.4%, and 17.6%, respectively (the fitting details are described in the Supporting Information and Figure S4). In this ribosome, all three FRET states are sampled. Figure 2(d–f) display another ribosome that only samples the C and Hy2 states (0%, 58.2%, and 41.8% for Hy1, C, and Hy2, respectively). More examples are shown in Supporting Information Figure S5. Therefore, every ribosome can be identified by its signature of FRET state composition. The determinations of these signatures are statistically reliable because of the sufficient data points for each ribosome.
Figure 2.
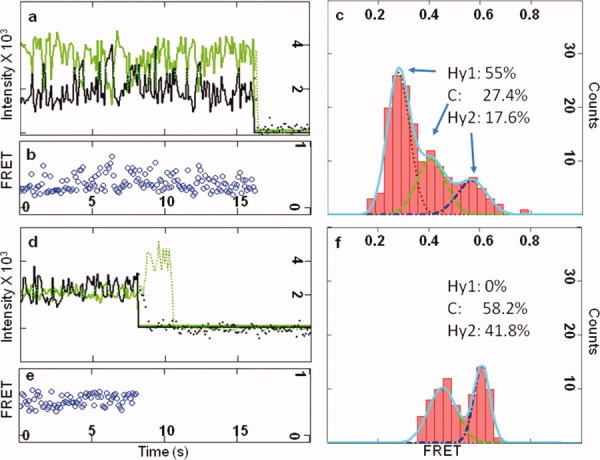
Calculation of the FRET states compositions. (a) One example of a pair of donor-acceptor fluorescence intensities. The presence of a single ribosome is confirmed by single step bleaching. (b) The FRET efficiency based on (a) is calculated as efficiency = Iacceptor/(Iacceptor + Idonor). (c) Histogram analysis of the FRET efficiencies in (b). Regardless of the limited data points (on average 110 points before bleaching), the Gaussian fittings are reasonable. (d), (e), and (f) provide another single ribosome example that are similar to (a), (b), and (c). [Color figure can be viewed in the online issue, which is available at wileyonlinelibrary.com.]
For the Rb-WT, we studied 3695 particles of pretranslocation complexes and plotted them on a three-dimensional (3D) graph [Fig. 3(a)]. The X-, Y-, and Z-axes are the compositions of the Hy1, C, and Hy2 states, respectively. All of the ribosomes are located in the plane of X + Y + Z = 1 because the compositions are normalized to 1. The ribosomes that are located at (1,0,0), (0,1,0), and (0,0,1) are the static subpopulations that only sample one FRET state. For example, ribosomes at (1,0,0) sample 100% of the Hy1 state. Ribosomes at (0,0,1) sample 100% of the P/P state (the Hy2 state only exists in fluctuating ribosomes as discussed above). The ribosomes that lie in the XY, XZ, or YZ planes only sample two of the FRET states. For example, ribosomes in the XY plane only sample the Hy1 and C states, and so on. Ribosomes that sample all three FRET states do not intercept the axis planes. For example, the ribosome trace shown in Figure 2(a) locates at position (X = 0.55, Y = 0.274, Z = 0.176) in Figure 3(a), which means it samples the Hy1, C, and Hy2 state 55%, 27.4%, and 17.6%, respectively. Accordingly, as shown in Figure 3(b), we sort the subpopulations into seven categories based on the ribosomes' locations on the 3D coordinates and calculate the percentages of each subpopulation. Previously, we have sorted the ribosomes into nonfluctuating, fluctuating without the Hy2 state, and fluctuating with the Hy2 state categories based only on their FRET values.8 Here, by assigning a unique 3D identifier to each ribosome, seven subpopulations are visible: ∼ 20% of the Hy1-only and C-only states (nonfluctuating), 25% of the Hy1-C state (fluctuating without the Hy2 state), 5% of the P/P state (spontaneous translocation), and 30% of the rest (fluctuating with the Hy2 state). These results agree well with our previous sorting results.
Figure 3.
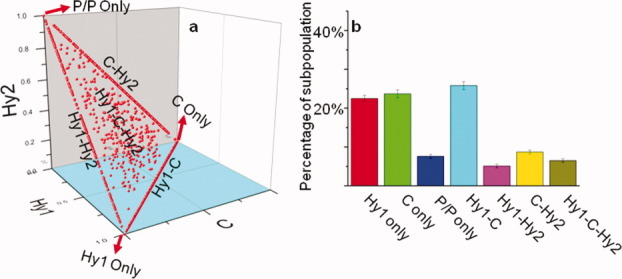
The 3D-plot and subpopulation sorting of the WT ribosome pre-translocation complexes. (a) The 3D-plot of the ribosomes according to their FRET state percentages: X, Y, and Z-axes are the percentages for the Hy1, C, and Hy2 states, respectively. Plot (a) sorts the ribosome into seven subpopulations according to the location of the data points. (b) Normalized ribosome subpopulation distributions for plot (a). The name for each subpopulation is the same as in (a). [Color figure can be viewed in the online issue, which is available at wileyonlinelibrary.com.]
Effect of L27 mutants on ribosome translocation
Ribosomes bearing mutated L27 with an N-terminal truncation of A2H3 (Rb-AH), A2H3K4 (Rb-AHK) or the nine terminal residues (Rb-9 aa) were studied. These ribosomes were prepared by incorporating the different types of L27 protein into the L27-lacking ribosome IW312 (Material and Methods). The N-terminal sequence of L27 was MAHKK AGGST RNGR, etc. The mutated L27 proteins are denoted similarly by substituting “Rb” with “L27.” The N-terminal formyl methionine was removed in L27-WT but was retained in L27-AH, L27-AHK, and L27-9 aa, as reported in the literature.19,20 The specific N-terminal sequences for each of the L27 mutants were unambiguously determined by protein sequencing.
Figure 4(a,b) displays the subpopulation profiles for the pre- and post-translocation complexes. Figure 4(c) displays the subpopulation changes upon translocation (post-translocation complex minus the pretranslocation complex). Each group of bar stands for one subpopulation. Within each subpopulation group, the orders of the bars are: Rb-WT, Rb-AH, Rb-AHK, and Rb-9. For the Rb-WT pretranslocation complexes, the distributions of the subpopulations are relatively diverse, but in the post-translocation complexes, the P/P subpopulation is dominant (60%). The absolute increase in the P/P subpopulation after translocation is 50%. The absolute decreases in the Hy1, C, and Hy1-C subpopulations are between 10 and 22%. The changes for the other subpopulations (C-Hy2, Hy1-Hy2, and Hy1-C-Hy2) are within ±10%. These results suggest that Hy1, C, and Hy1-C subpopulations are the kinetically active subpopulations for translocation. However, the other subpopulations are not inactive ribosomes. Prolonged tracking on the same ribosomes indicates that a native ribosome can sample among all seven subpopulations if given enough time. The subpopulation distributions before and after the long tracking time are similar, indicating that all of these subpopulations are similar in energy.* However, it is possible that some of these subpopulations are kinetically slower or less likely to interact with EF-G.
Figure 4.
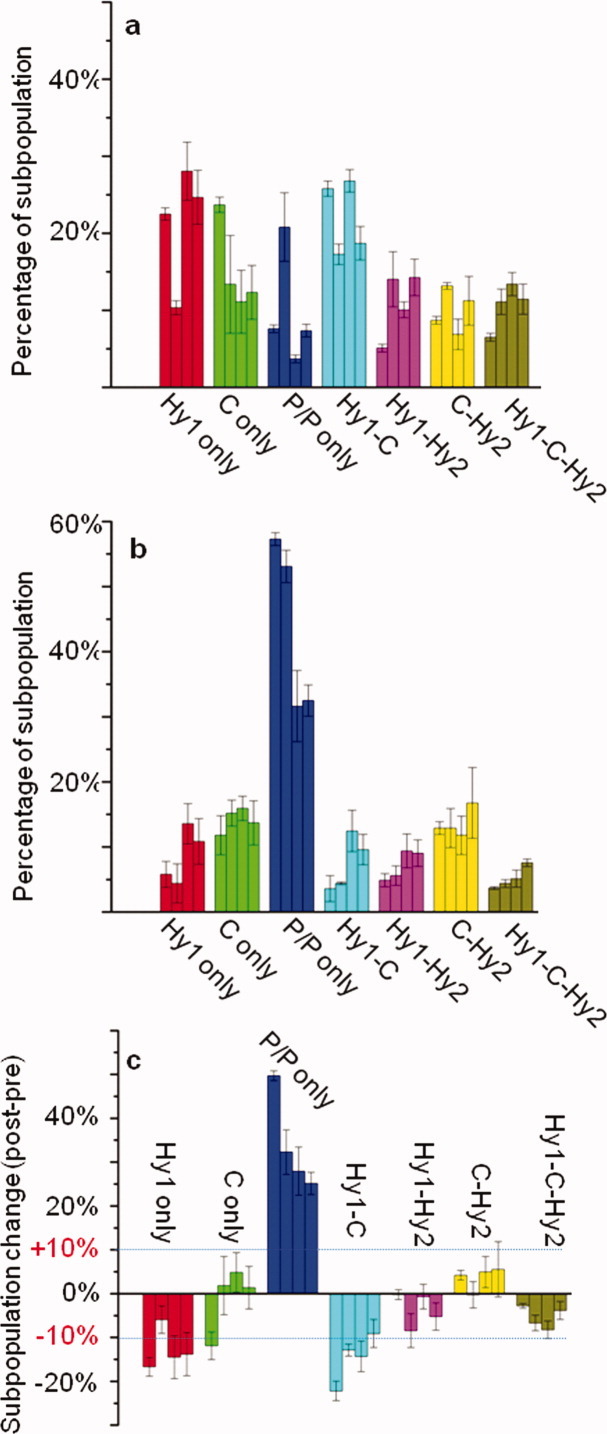
Ribosome subpopulation distributions. (a) The subpopulation distributions in the pre-translocation complexes. In each group of bars, the orders are from the Rb-WT, Rb-AH, Rb-AHK to Rb-9 aa. (b) The subpopulation distributions in the post translocation complex. (c) The subpopulation changes upon translocation (post minus pre). [Color figure can be viewed in the online issue, which is available at wileyonlinelibrary.com.]
Figure 4(b) shows that the P/P subpopulation is ∼ 60% in the Rb-AH that is similar to Rb-WT, but only ∼ 30% in the Rb-AHK and the Rb-9 aa. Accordingly, the absolute increases in P/P subpopulations in these two mutations are 28% and 25%, respectively [Fig. 4(c)]. The P/P subpopulations in the Rb-AHK and the Rb-9 aa are only 50% of those in the Rb-WT and Rb-AH, indicating that either translocation or the stability of the peptidyl tRNA is reduced in Rb-AHK and Rb-9 aa. According to the ribosome “locking” theory, the peptidyl tRNA in the post-translocation complex should be static. However, a single-molecule study found that a small number of ribosomes allowed peptidyl tRNA fluctuation.5 Therefore, the percentage of the P/P subpopulation (static peptidyl tRNA) probably correlates with but is not equal to translocation completeness. Independent of the single-molecule experiments, we have measured the translocation percentage via the puromycin assay.9 The puromycin is an antibiotic that binds to the ribosome 50S A-site and releases the nascent peptidyl chain. It reacts with the post-translocation complex several-thousand-fold faster than it reacts with the pretranslocation complex. Therefore, puromycin assay is a well-established method to measure ribosome translocation completeness.21,22 These experiments showed that the translocation percentages in all of the Rb-WT and mutants are ∼ 70%. This implies that the different P/P subpopulation percentages we observe in single-molecule experiments are likely due to a less stable peptidyl tRNA rather than a less translocation completeness.
Removal of the first three N-terminal residues (A2H3K4) but not the first two residues (A2H3) reduces the P/P subpopulation from 60% (Rb-WT and Rb-AH) to 30% (Rb-AHK). This suggests that residue K4 plays a key role in stabilizing the peptidyl tRNA. To better understand the role of residue K4, a L27 mutant with an intact N-terminal sequence but with the K4 replaced with glutamic acid is studied. The ribosome that carries this mutation (Rb-K4E) reduces the P/P subpopulation to 20% (Supporting Information Figure S6). This result provides direct evidences that residue K4 is critical for stabilizing the peptidyl tRNA. Additional mutations to K4 including amino acids carrying aliphatic side chains are currently being studied.
Discussion
An L27-tRNA interaction model
The presence of L27 at the peptidyl transfer center raised the question about the role of a protein in the catalytic center of a ribozyme. Kinetic studies indicate that the absence of L27 causes a three- to fourfold decrease in peptidyl transferase activity and severe cell growth defects.20,23 Truncation of the three N-terminal residues A2H3K4 is sufficient to cause these deficiencies. However, the precise roles of these residues are not clear, even after the availability of X-ray snapshots at the peptidyl center.10 In this report, we have provided single-molecule data to illustrate the interactions between L27 and the tRNAs in solution and in real time.
Our analysis indicates that residue K4 in L27 probably contributes to stabilizing the peptidyl tRNA. We show that removing either several N-terminal residues of L27 or mutating this residue to glutamic acid reduced the ribosome's ability to form the “P/P only” subpopulation, which is the stable peptidyl tRNA.
Figure 5 displays the possible interaction between K4 and the peptidyl tRNA in the post-translocation complex. In the ribosome mutants without this residue, the peptidyl tRNA loses some extra energy to maintain the “locked” dynamics. This explains the decreased P/P subpopulations in the Rb-AHK, Rb-9 aa, and Rb-K4E. A less stable peptidyl tRNA could cause ribosomes to lose competences in either translocation or the next round peptidyl transfer reaction. We will measure these processes in real-time to further reveal the importance of this residue.
Figure 5.
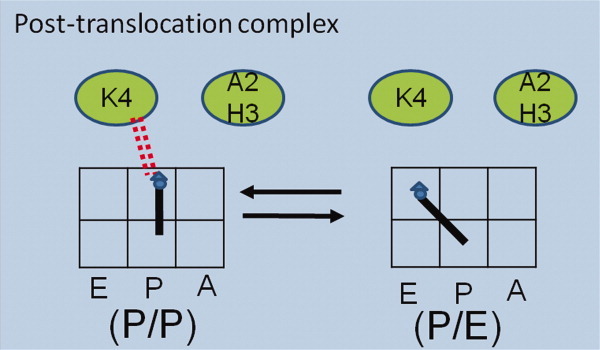
A model to explain the L27 mutagenesis effect on tRNA dynamics. The tRNA binding sites and the dipeptide are represented as the same as in Figure 1. In the Rb-WT post-translocation complex, the K4-peptidyl tRNA interaction stabilizes the peptidyl tRNA (the double dashed line). This explains the decreased P/P subpopulation in ribosomes without the K4 residue (Rb-AHK, Rb-9 aa, and Rb-K4E). [Color figure can be viewed in the online issue, which is available at wileyonlinelibrary.com.]
Materials and Methods
Buffers
All single-molecule experiments were performed in TAM10 buffer: 20 mM Tris, pH 7.5; 30 mM NH4Cl; 70 mM KCl; 10 mM MgCl2; and 1 mM DTT. The ribosomes were purified in B1 buffer: 20 mM Tris, pH 7.5; 100 mM NH4Cl; 10 mM MgCl2; 3 mM BME (2-mercaptoethanol); 0.5 mM EDTA. L27, EF-G, EF-Tu, EF-Ts, and E. coli tRNA synthetase (phenylalanine specific) were stored in storage buffer: 20 mM Tris, pH 7.5; 400 mM KCl; 10 mM MgCl2; 4 mM BME (2-mercaptoethanol); 0.5 mM EDTA. L27 labeling buffer was composed of: 20 mM Tris, pH 7.5; 100 mM NaCl. The reconstituted ribosome with labeled L27 was stored in B2 buffer: 50 mM Tris, pH 7.5; 100 mM NH4Cl; 10 mM MgCl2; 3 mM BME (2-mercaptoethanol); 0.5 mM EDTA.
Material preparation and surface immobilization of ribosomes
Protein preparation
His-tagged Proteins EF-G, EF-Tu, EF-Ts were expressed and purified using standard methods (Qiagen purification kit or Histrap FPLC column from GE healthcare). N-formyl methionine-tRNA was prepared essentially as described.24 5'-biotinylated 032mRNA was purchased from Dharmacon RNAi Technologies, Thermo Scientific. All the reagents were from Sigma unless otherwise stated.
L27 WT and mutant preparation
The rpmA gene encoding E. coli WT L27 was subcloned into the PET-20b plasmid from the PET-3b plasmid (a kind gift from Prof. J. Wower of Auburn University, Auburn AL). The C-terminal His-tagged L27 was expressed and purified according to standard procedures (Histrap FPLC column from GE healthcare). L27 mutant plasmids were generated by QuickChange® Lightning site-directed mutagenesis from Stratagene. The protein sequences were confirmed by DNA sequencing as well as N-terminal protein sequencing at the Office of Biotechnology of the Iowa State University.
Ribosomes, Cy5-L27, and Cy3-tRNAPhe
Ribosomes lacking L27 were isolated from E. coli strain IW312 as described,25 except that in the 10–40% sucrose gradient purification step the 70S is not dissociated. L27 WT and mutants were labeled at the unique C53 position with a Cy5-maleimide mono-reactive dye (GE Healthcare Life Sciences) dissolved in DMSO according to the provided protocol. Yeast tRNAPhe (Sigma) was labeled at the 16/17 position with Cy3-hydrazide (GE healthcare) according to literature.16
L27-Labeled ribosomes
The labeled L27 was incorporated into the 70S ribosomes as described: the purified IW312 ribosomes (1 μM) were incubated with Cy5-labeled L27 (1.2 μM) in TAM10 buffer at 37°C for 25 min.8,26 The solution was then layered on 1:1 volume ratio of 1.1M sucrose and centrifuged at 35,000 rpm at 4°C for 12 h using a Beckman SW 50.1 rotor. The pelleted ribosomes were resuspended in B2 buffer and stored in aliquots at −80°C.
The incorporation efficiency of L27 into the IW312 ribosome was 100%, whereas unspecific uptake of L27 into the MRE600 ribosome was 10%. The correct position of L27 incorporation into the ribosome was confirmed by: (a) the complete recovery of IW312 ribosome activity8; and (b) zero background FRET signal from MRE600 ribosome with the 10% nonspecific L27 uptake; (c) constant FRET values from multiple batches of complex preparation.
Ribosome complex formation
The pretranslocation complex was made as described26 and purified by sucrose cushion ultracentrifuge.8,14 Three mixtures were made. (1) The ribosome mixture contained 1 μM ribosomes, 4 mM GTP, 1.5 μM each of factors IF1, 2, and 3, 4 μM 032mRNA which encoded MFK and six more amino acids and 4 μM formyl-Met-tRNAfMet in TAM10 buffer; (2) the factor mixture contained 3 μM EF-Tu, 4 μM EF-Ts, 1 mM GTP, 1 mM phosphoenolpyruvate/ATP and 0.006 mg/mL pyruvate kinase in TAM10 buffer; (3) the aminoacylation mixture contained 100 mM Tris (pH 7.5), 20 mM MgAc2, 1 mM EDTA, 4 mM ATP, 7 mM BME, 1 mg/mL purified yeast total synthetase, 100 μM phenylalanine and 2 A260/mL Cy3-tRNAphe. All three mixtures were incubated separately at 37°C for 25 min, then mixed at a ratio of 1:2:2 in the order of solutions (1), (2), and (3). The mixture was briefly incubated at 37°C for another 2 min and layered on 1:1 volume ratio of 1.1M sucrose and centrifuged overnight with a SW50.1 rotor at 35,000 rpm. The pretranslocation complex was then stored at −80°C in aliquots. The post-translocation complex was prepared by incubating the purified precomplex (0.2 μM) with EF-G (1.0 μM), GTP (1 mM), phosphoenolpyruvate/ATP (1 mM), and pyruvate kinase (0.02 mg/mL) in an Eppendorf tube for 5 min at 37°C. It was then fractioned and stored at −80°C. The completeness of the translocation process was measured by the “SPARK” assay.27
Surface tethering of ribosomes
Glass cover-slips were cleaned and passivated with Biotin-PEG.28 Streptavidin (0.5 mg/mL) was delivered to the surface before single-molecule acquisition. The ribosome complexes were then tethered to the surface via the streptavidin-biotinylated mRNA interaction.
TIRF measurements
The objective-based TIRF setup was built on a Nikon Eclipse Ti inverted microscope (Nikon Instruments, Lewisville, TX) with heavy modifications, as previously described.8 Total internal reflection of a 6–12 mW, 532-nm laser beam through an objective (Nikon, Apo TIRF, 60×/1.49 oil) generated evanescent waves near the sample chamber surface to excite fluorophores bound to the surface (but not those in the bulk medium). The emitted FRET signals were split by a Dual View apparatus (Optical Insights Corp.), collected by an EMCCD camera (Photometrics, Cascade II: 512) and analyzed with an in-house algorithm based on Mathcad software. The emission maximum for the Cy3 and Cy5 dyes are at 570 nm and 670 nm, respectively.
The data were collected at 100 ms intervals. The final imaging buffer contained an oxygen scavenger cocktail with the following gradients: 3 mg/mL glucose, 100 μg/mL glucose oxidase, 48 μg/mL catalase, and 2 mM trolox.26,29
Acknowledgments
The authors thank Dr. George Fox of University of Houston for his critical reading of our manuscript.
Glossary
Abbreviation
- FRET
fluorescence resonance energy transfer
Footnotes
Xiao M, Li Y, Wang Y. (submitted) Heterogeneity of single molecule FRET signals reveals multiple active ribosome subpopulations. Biophys J.
Supplementary material
Additional Supporting Information may be found in the online version of this article.
References
- 1.Wilson DN, Nierhaus KH. Ribosomal proteins in the spotlight. Crit Rev Biochem Mol Biol. 2005;40:243–267. doi: 10.1080/10409230500256523. [DOI] [PubMed] [Google Scholar]
- 2.Frank J, Agrawal RK. A ratchet-like inter-subunit reorganization of the ribosome during translocation. Nature. 2000;406:318–322. doi: 10.1038/35018597. [DOI] [PubMed] [Google Scholar]
- 3.Moazed D, Noller HF. Interaction of tRNA with 23S rRNA in the ribosomal A, P, and E sites. Cell. 1989;57:585–597. doi: 10.1016/0092-8674(89)90128-1. [DOI] [PubMed] [Google Scholar]
- 4.Valle M, Zavialov A, Sengupta J, Rawat U, Ehrenberg M, Frank J. Locking and unlocking of ribosomal motions. Cell. 2003;114:123–134. doi: 10.1016/s0092-8674(03)00476-8. [DOI] [PubMed] [Google Scholar]
- 5.Cornish PV, Ermolenko DN, Noller HF, Ha T. Spontaneous intersubunit rotation in single ribosomes. Mol Cell. 2008;30:578–588. doi: 10.1016/j.molcel.2008.05.004. [DOI] [PMC free article] [PubMed] [Google Scholar]
- 6.Zavialov AV, Ehrenberg M. Peptidyl-tRNA regulates the GTPase activity of translation factors. Cell. 2003;114:113–122. doi: 10.1016/s0092-8674(03)00478-1. [DOI] [PubMed] [Google Scholar]
- 7.Fischer N, Konevega AL, Wintermeyer W, Rodnina MV, Stark H. Ribosome dynamics and tRNA movement by time-resolved electron cryomicroscopy. Nature. 2010;466:329–333. doi: 10.1038/nature09206. [DOI] [PubMed] [Google Scholar]
- 8.Altuntop ME, Ly CT, Wang Y. Single-molecule study of ribosome hierarchic dynamics at the peptidyl transferase center. Biophys J. 2010;99:3002–3009. doi: 10.1016/j.bpj.2010.08.037. [DOI] [PMC free article] [PubMed] [Google Scholar]
- 9.Xiao M, Wang Y. L27-tRNA interaction revealed by mutagenesis and pH titration. Biophys Chem. 2012;167C:8–15. doi: 10.1016/j.bpc.2012.04.003. [DOI] [PubMed] [Google Scholar]
- 10.Voorhees RM, Weixlbaumer A, Loakes D, Kelley AC, Ramakrishnan V. Insights into substrate stabilization from snapshots of the peptidyl transferase center of the intact 70S ribosome. Nat Struct Mol Biol. 2009;16:528–533. doi: 10.1038/nsmb.1577. [DOI] [PMC free article] [PubMed] [Google Scholar]
- 11.Selmer M, Dunham CM, Murphy FVt, Weixlbaumer A, Petry S, Kelley AC, Weir JR, Ramakrishnan V. Structure of the 70S ribosome complexed with mRNA and tRNA. Science. 2006;313:1935–1942. doi: 10.1126/science.1131127. [DOI] [PubMed] [Google Scholar]
- 12.Nissen P, Hansen J, Ban N, Moore PB, Steitz TA. The structural basis of ribosome activity in peptide bond synthesis. Science. 2000;289:920–930. doi: 10.1126/science.289.5481.920. [DOI] [PubMed] [Google Scholar]
- 13.Ban N, Nissen P, Hansen J, Moore PB, Steitz TA. The complete atomic structure of the large ribosomal subunit at 2.4 A resolution. Science. 2000;289:905–920. doi: 10.1126/science.289.5481.905. [DOI] [PubMed] [Google Scholar]
- 14.Ly CT, Altuntop ME, Wang Y. Single-molecule study of viomycin's inhibition mechanism on ribosome translocation. Biochemistry. 2010;49:9732–9738. doi: 10.1021/bi101029g. [DOI] [PubMed] [Google Scholar]
- 15.Solomatin SV, Greenfeld M, Chu S, Herschlag D. Multiple native states reveal persistent ruggedness of an RNA folding landscape. Nature. 2010;463:681–684. doi: 10.1038/nature08717. [DOI] [PMC free article] [PubMed] [Google Scholar]
- 16.Pan D, Qin H, Cooperman BS. Synthesis and functional activity of tRNAs labeled with fluorescent hydrazides in the D-loop. RNA. 2009;15:346–354. doi: 10.1261/rna.1257509. [DOI] [PMC free article] [PubMed] [Google Scholar]
- 17.Schmeing TM, Ramakrishnan V. What recent ribosome structures have revealed about the mechanism of translation. Nature. 2009;461:1234–1242. doi: 10.1038/nature08403. [DOI] [PubMed] [Google Scholar]
- 18.Agmon I, Bashan A, Zarivach R, Yonath A. Symmetry at the active site of the ribosome: structural and functional implications. Biol Chem. 2005;386:833–844. doi: 10.1515/BC.2005.098. [DOI] [PubMed] [Google Scholar]
- 19.Flinta C, Persson B, Jornvall H, von Heijne G. Sequence determinants of cytosolic N-terminal protein processing. Eur J Biochem. 1986;154:193–196. doi: 10.1111/j.1432-1033.1986.tb09378.x. [DOI] [PubMed] [Google Scholar]
- 20.Maguire BA, Beniaminov AD, Ramu H, Mankin AS, Zimmermann RA. A protein component at the heart of an RNA machine: the importance of protein l27 for the function of the bacterial ribosome. Mol Cell. 2005;20:427–435. doi: 10.1016/j.molcel.2005.09.009. [DOI] [PubMed] [Google Scholar]
- 21.Pan D, Kirillov SV, Cooperman BS. Kinetically competent intermediates in the translocation step of protein synthesis. Mol Cell. 2007;25:519–529. doi: 10.1016/j.molcel.2007.01.014. [DOI] [PMC free article] [PubMed] [Google Scholar]
- 22.Peske F, Savelsbergh A, Katunin VI, Rodnina MV, Wintermeyer W. Conformational changes of the small ribosomal subunit during elongation factor G-dependent tRNA-mRNA translocation. J Mol Biol. 2004;343:1183–1194. doi: 10.1016/j.jmb.2004.08.097. [DOI] [PubMed] [Google Scholar]
- 23.Wower IK, Wower J, Zimmermann RA. Ribosomal protein L27 participates in both 50 S subunit assembly and the peptidyl transferase reaction. J Biol Chem. 1998;273:19847–19852. doi: 10.1074/jbc.273.31.19847. [DOI] [PubMed] [Google Scholar]
- 24.Rodnina M, Semenkov YP, Wintermeyer W. Purification of fMet-tRNA (fMet) by fast protein liquid chromatography. Anal Biochem. 1994;219:380–381. doi: 10.1006/abio.1994.1282. [DOI] [PubMed] [Google Scholar]
- 25.Moazed D, Van Stolk BJ, Douthwaite S, Noller HF. Interconversion of active and inactive 30 S ribosomal subunits is accompanied by a conformational change in the decoding region of 16 S rRNA. J Mol Biol. 1986;191:483–493. doi: 10.1016/0022-2836(86)90143-9. [DOI] [PubMed] [Google Scholar]
- 26.Wang Y, Qin H, Kudaravalli RD, Kirillov SV, Dempsey GT, Pan D, Cooperman BS, Goldman YE. Single-molecule structural dynamics of EF-G--ribosome interaction during translocation. Biochemistry. 2007;46:10767–10775. doi: 10.1021/bi700657d. [DOI] [PubMed] [Google Scholar]
- 27.Mankin AS, Polacek N. SPARK: a new peptidyl transferase activity assay. Methods Mol Med. 2008;142:107–116. doi: 10.1007/978-1-59745-246-5_9. [DOI] [PubMed] [Google Scholar]
- 28.Roy R, Hohng S, Ha T. A practical guide to single-molecule FRET. Nat Methods. 2008;5:507–516. doi: 10.1038/nmeth.1208. [DOI] [PMC free article] [PubMed] [Google Scholar]
- 29.Rasnik I, McKinney SA, Ha T. Nonblinking and long-lasting single-molecule fluorescence imaging. Nat Methods. 2006;3:891–893. doi: 10.1038/nmeth934. [DOI] [PubMed] [Google Scholar]
Associated Data
This section collects any data citations, data availability statements, or supplementary materials included in this article.