

Abstract
LIM-only protein 2, Lmo2, is a regulatory protein that is essential for hematopoietic development and inappropriate overexpression of Lmo2 in T-cells contributes to T-cell leukemia. It exerts its functions by mediating protein–protein interactions and nucleating multicomponent transcriptional complexes. Lmo2 interacts with LIM domain binding protein 1 (Ldb1) through the tandem LIM domains of Lmo2 and the LIM interaction domain (LID) of Ldb1. Here, we present the solution structure of the LIM2 domain of Lmo2 bound to Ldb1LID. The ordered regions of Ldb1 in this complex correspond well with binding hotspots previously defined by mutagenic studies. Comparisons of this Lmo2LIM2–Ldb1LID structure with previously determined structures of the Lmo2/Ldb1LID complexes lead to the conclusion that modular binding of tandem LIM domains in Lmo2 to tandem linear motifs in Ldb1 is accompanied by several disorder-to-order transitions and/or conformational changes in both proteins.
Keywords: Lmo2, Ldb1, NMR structure, modular binding
Introduction
LIM-only protein 2 (Lmo2) is a transcriptional regulator that is essential for normal blood cell development. Mice in which this gene has been disrupted die midway through development (E10.5) without any blood cells.1 Lmo2 is associated with the maintenance of hematopoietic stem cells,2 the differentiation of red blood cells,3,4 and angiogenesis in both normal development and solid tumor formation.5,6 The inappropriate overexpression of Lmo2 in T-cells, through either chromosomal translocations or retroviral insertion of gene therapy vectors, leads to the onset of T-cell acute lymphoblastic leukemia (reviewed in Ref. 7). Tumors with similar properties occur in mice that carry an lmo2 transgene.8 Inhibition of Lmo2, using a specific intracellular antibody or peptide targeted toward the protein, blocks both Lmo2-induced erythropoiesis and tumor formation in a mouse explant model of leukemia.9,10
Lmo2 is a 158-residue protein that contains two closely spaced LIM domains and very little other sequence. LIM domains (named for the first three genes in which the motif was identified (Lin-11, Isl-1, and Mec-3) are zinc fingers that coordinate two zinc ions, and that function as protein–protein interaction motifs (reviewed in Ref. 11). Lmo2 has been found in large transcriptional complexes alongside proteins such as LIM domain binding protein 1 (Ldb1/NLI/CLIM2), Tal1/Scl, E2A proteins, and GATA-family proteins.3,12–14 Of these partner proteins, Lmo2 is found most frequently in association with Ldb1, a widely expressed protein that has been shown to contact, through its LIM-interaction domain (LID), the LIM domains of many LIM-only and LIM-homeodomain proteins.15–17 Ldb1 has essential roles in numerous developmental processes (reviewed in Ref. 18). Homozygous Ldb1 knockout mice die mid gestation (E9.5–E10) with numerous defects, including a lack of blood cells; this phenomenon is thought to indicate an essential role for Ldb1 in Lmo2-containing transcriptional complexes in the yolk sac.19 Although the LIM1 domain from Lmo2 appears to be the primary determinant of Ldb1-binding activity, both LIM domains are required for high affinity binding.16,20,21
Recombinant forms of Lmo2 tend to be insoluble, but it is possible to overcome this problem by creating fusion proteins in which either or both of the LIM domains are tethered to Ldb1LID via a flexible linker.20,21 Using this approach, we have previously determined the solution structure of Lmo2LIM1 in complex with Ldb1LID (Lmo2LIM1–Ldb1LID)22; the crystal structure of the tandem LIM domain construct (Lmo2LIM1+2–Ldb1LID) has also been determined using a similar strategy.23 Here we report the solution structure of Lmo2LIM2–Ldb1LID and compare this structure and the solution structure of Lmo2LIM1–Ldb1LID with the crystal structures of Lmo2LIM1+2–Ldb1LID to gain a better understanding of how modular binding between the tandem LIM domains of Lmo2 and tandem linear motifs in Ldb1 facilitate complex formation.
Results and Discussion
We determined the solution structure of Lmo2LIM2–Ldb1LID using standard NMR methods (Table I; Fig. 1). The structured regions of the complex, as defined by angle order parameters of ϕ > 0.9 and ψ > 0.9, are made up of residues Lmo2L93–G156 and Ldb1D300–L309, with the exceptions of Lmo2A103–M106 and Lmo2C97/D98. Residues Ldb1E317–L321 are also ordered, but do not form part of the Lmo2LIM2/Ldb1LID complex. The root mean square deviation (R.M.S.D) of atoms in the structured regions of the 20 lowest energy models is 0.85 Å for all backbone atoms and 1.28 Å for all heavy atoms. Together these parameters indicate that the solution structure of Lmo2LIM2–Ldb1LID is of medium to high resolution.24
Table I.
NMR and Refinement Statistics for Lmo2LIM2–Ldb1LID
| Lmo2LIM2– Ldb1LID | |
|---|---|
| NMR distance and dihedral constraints | |
| Distance constraints | |
| Total NOE | 1066 |
| Intra-residue | 283 |
| Inter-residue | |
| Sequential (|i – j| = 1) | 329 |
| Medium-range (1<|i – j| < 5) | 138 |
| Long-range (|i – j| ≥ 5) | 316 |
| Inter-residue H-bonds | 0 |
| Total dihedral angle restraints (TALOS) | |
| ϕ | 54 |
| ψ | 53 |
| HNHA-derived 3-bond J-coupling constants | 45 |
| Structure statistics | |
| Violations | |
| Upper limits > 0.5 Å | 0 |
| Upper limits, R.M.S. (Å) | 0.016 |
| Dihedral angle constraints, R.M.S. (°) | 0.499 |
| Max. distance constraint violation (Å) | 0.4 |
| Max. dihedral angle violation (°) | 4.79 |
| Deviations from idealized geometry | |
| Bond lengths (Å) | 0.0070 ± 0.0003 |
| Bond angles (°) | 0.76 ± 0.03 |
| Impropers (°) | 0.35 ± 0.06 |
| Pairwise R.M.S.D. (Å) | |
| Lmo2LIM2-Ldb1LID complexa | |
| Heavy | 1.28 ± 0.46 |
| Backbone | 0.85 ± 0.46 |
| Ramachandran (PROCHECK) statisticsb | |
| Most favored | 85.4% |
| Additionally allowed | 14.6% |
| Generously allowed | 0.1% |
| Disallowed | 0% |
R.M.S.D. was calculated among 20 refined structures using the structured regions of Lmo2 (93–102/107–155) and Ldb1 (300–309). The isolated helical region in Ldb1 (residues 317–321) gave rise to R.M.S.D. values of 1.10 ± 0.26 and 0.24 ± 0.19 Å for all heavy atoms and backbone atoms, respectively.
For the structured residues in Lmo2 (residues 93–102/107–155) and Ldb1 (residues 300–309/317–321). Note that residues 1–72 in the construct correspond to Lmo2 (residues 83–155), and residues 84–123 in the construct correspond to Ldb1 (residues 300–339).
Figure 1.
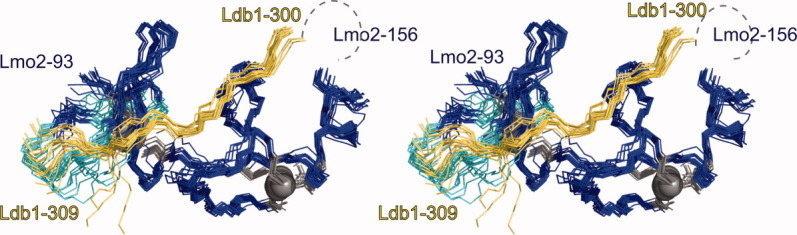
Solution structure of Lmo2LIM2-Ldb1LID. Backbone overlay of the 20 lowest energy members of the NMR ensemble shown in stereo. The complex shown is formed by the structured regions in Lmo2 (blue) and Ldb1 (yellow) along with a less ordered loop in Lmo2 (103–106; cyan). Zinc ions are shown as gray spheres and zinc-coordinating sidechains are shown as gray sticks. The position of the unstructured tether between the Lmo2156 and Ldb1300 is indicated (black dashed line). The largely unstructured C-terminal region of Ldb1LID is not shown.
The structure of this tethered complex closely resembles that of other LIM–Ldb1LID complexes,22,23,25–27 [e.g. Fig. 2(A)]. Ldb1LID binds in a head-to-tail fashion (i.e., with the N-terminus of Lmo2LIM2 close to the C-terminus of the structured region of Ldb1LID and the C-terminus of Lmo2LIM2 to the N-terminus of Ldb1LID). The LIM domain fold comprises two closely packed GATA-like zinc-binding modules (referred throughout as Zn1 and Zn2), each of which contains two orthogonally arrayed β-hairpins followed by a segment of helical structure of variable length.11,28 For Lmo2LIM2–Ldb1LID, only a few regions of regular secondary structure were well defined in all members of the NMR ensemble: the final β-hairpin (Lmo2R134–L137/I142–V143) and the C-terminal α-helix (Lmo2I148–N155). The N-terminal part of Ldb1LID (Ldb1D300–L309) packs against Lmo2LIM2. A short β-strand in Ldb1 (Ldb1M302–V303) augments the well-defined β-hairpin in Lmo2LIM2 (Lmo2R134–L137/I142–V143) to form a small three-stranded anti-parallel β-sheet [Fig. 2(A)]. On average, ∼1500 Å2 solvent accessible surface is buried through the interaction of Lmo2LIM2 and Ldb1LID.
Figure 2.
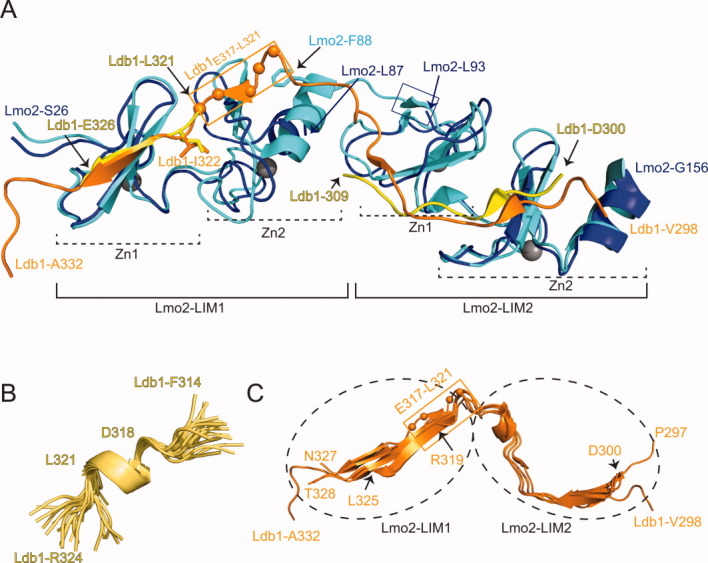
Structural comparisons and details of binding. A: Single conformers from the solution structure ensembles of Lmo2LIM1–Ldb1LID (PDB accession code 2JTN) and Lmo2LIM2–Ldb1LID (PDB accession code 2LXD) and the single molecule from the X-ray structure of Lmo2LIM1+2–Ldb1LID (PDB accession code 2XJY) are shown in ribbon format. The structures are overlaid over the backbone residues of each LIM domain as follows: LIM1, residues 30–54; LIM2, residues 94–147. The single domain NMR structures are in blue (Lmo2) and yellow (Ldb1) and the tandem LIM domain X-ray structure is in cyan (Lmo2) and orange (Ldb1). Zinc ions are shown as gray spheres. The two GATA-type zinc binding modules in each LIM domain are indicated (Zn1 and Zn2). The Cα carbons of Ldb1E317–L321 are shown as orange spheres and the region is bounded by an orange box. This region forms a helix in Lmo2LIM2–Ldb1LID but an extended structure when bound to Lmo2LIM1. The blue box indicates residues in Lmo2LIM2 that form a β-strand in Lmo2LIM1+2-Ldb1LID but which are disordered in Lmo2LIM2–Ldb1LID. B: Detail of the ordered segment Ldb1E317–L321 from the Lmo2LIM2–Ldb1LID structure; all 20 conformers were overlaid over the backbone atoms of residues 317–321, and residues 318–321 form a turn of α-helix. C: Alignment of Ldb1LID portions from the Lmo2LIM1+2–Ldb1LID X-ray structures (one molecule from 2XJY, and five molecules from 2XJZ). The ends of Ldb1 from each molecule are labeled and the position of Ldb1E317–L321 is indicated as in (A). The approximate positions of the LIM domains from Lmo2 are indicated by dashed ovals.
Both angle order parameters and a low abundance of non-sequential NOEs indicate that, overall, Ldb1322–339 is not well ordered. This conclusion is supported by both TALOS+ predictions and the Random Coil Index prediction of protein flexibility, which is based on an analysis of backbone chemical shifts29 (Supporting Information data). Within this region, however, residues Ldb1E317–L321 are ordered, containing a single turn of helix (Ldb1D318–L321) [Fig. 2(B)]; order angle parameters >0.9, TALOS+, and random coil index (RCI) analysis all support structure in this region and chemical shift index analysis and the presence of non-sequential NOEs indicate helical structure (Supporting Information data). In related complexes that contain the LIM1 domains from Lmo2, Lmo4, or Lhx3 in complex with Ldb1, these same residues form extended or β structure22,23,25–27 [e.g., Fig. 2(A,C), orange boxes], indicating that for these residues in Ldb1 a conformational change is brought about through binding to the LIM1 domains of Lmo2 and related proteins.
Isothermal titration calorimetry and competition ELISA data showed that Ldb1LID binds Lmo2LIM1 with KD ≍ 2 × 10⁻⁷ M−1, and Lmo2LIM1+2 with KD ≍ 2 × 10⁻⁸ M−1, respectively.21 That is, the binding affinity increases by ∼10-fold when the LIM2 domain is present. The availability of structures of both the individual LIM-LID modules (Lmo2LIM1–Ldb1LID and Lmo2LIM2–Ldb1LID, both determined by NMR spectroscopy), and the double LIM–LID complex (Lmo2LIM1+2–Ldb1LID) gives us an opportunity to consider how the tandem binding domains from both proteins synergistically facilitate interactions in this complex. In the structure of Lmo2LIM1–Ldb1LID (PDB accession code 12JO) Zn1 is well defined (backbone R.M.S.D. of 0.39 Å for the 20 conformers in the ensemble), but substantially more variation exists between conformers in Zn2 (backbone R.M.S.D. 1.24 Å).22 Lmo2LIM1-Zn1 and the relevant binding residues in Ldb1LID are essentially identical in both the single and double LIM constructs. Lmo2LIM1-Zn2 has the same topology in all structures, but whereas this module is poorly defined in the NMR structure of the LIM1 construct, it is well defined in the crystal structures of the double LIM construct; the six different molecules in the asymmetric units of the two X-ray structures (PDB accession codes 2XJY and 2XJZ) are identical in this region.
The difference in structure of Lmo2LIM1-Zn2 between the double LIM constructs in the X-ray structures and the single LIM construct in our earlier NMR structure likely stems from a difference in construct design. The LIM1 domain was truncated at L87 in the Lmo2LIM1–Ldb1LID construct, but examination of the crystal structures shows that the sidechain of Lmo2F88 [Fig. 2(A)], the final helical residue in Lmo2LIM1, makes contacts with numerous other residues in the helix and the adjacent β-hairpin. This phenylalanine residue is highly conserved in all other LIM-only and LIM-homeodomain proteins, and adopts the same conformation in all of the known structures from this group of LIM domain proteins (Lmo4, Lhx3, and Lhx4).22,25–27,30 Thus, the lack of Lmo2F88 likely destabilized Lmo2LIM1-Zn2 in the NMR structure. The solution structure of an Lmo4LIM1–Ldb1LID construct (PDB accession code 1M3V) that does contain Lmo4F81 (which is equivalent to Lmo2F88) is considerably more ordered than the Lmo2LIM1–Ldb1LID structure,22 supporting an important structural role for this aromatic sidechain.
However, further comparison with Lmo4LIM1–Ldb1 and Lmo4LIM1+2–Ldb1 structures suggests that, despite the effect on structure, the lack of F88 does not have a major impact on the interaction between Ldb1 and Lmo2 in the Lmo2LIM1–Ldb1 complex. Similar levels of order were seen in the Ldb1 portions of both LmoLIM1–Ldb1 constructs (residues Ldb1I322–Q328 in the Lmo2 and Ldb1L321–E326 in the Lmo4 complex, are ordered). These ordered regions from the single domain NMR structures correspond well with the results of mutagenic studies that indicated a single binding hotspot in Ldb1LID, centered on Ldb1I322, that drives binding to the LIM domains of Lmo2, Lmo4, Lhx3, and Isl1.21,25,27
The only significant difference in the structures of the LIM2 domain constructs lies at start of this domain. Residues Lmo2G92/L93 form a well defined short β-strand in the double LIM domain X-ray structures, but are disordered at the start of the single LIM domain NMR structure [Fig 2(A), blue box]; Lmo2A20–M23 is also poorly ordered in the NMR structure, Lmo2 (Fig 1, cyan).
Comparing the extent of interaction of Ldb1 in the different LIM interactions, the ordered region of Ldb1LID is slightly longer in the Lmo2LIM2–Ldb1LID structures compared with the Lmo2LIM1–Ldb1LID and Lmo4LIM1–Ldb1LID structures. Mutagenic studies indicate two binding hotspots that form an extended interface in Ldb1LID for the LIM2 domains from Lmo2, Lmo4, and Lhx3.21,25,27 For Lmo2LIM1+2/Ldb1 interactions, the number of residues from Ldb1 for which electron density is defined varies between each of the six molecules from the X-ray structures, but apart from a minor hinging (∼11°) at Ldb1E313,23 Ldb1 adopts the same structure in each conformer [Fig. 2(C)]. Thus, Ldb1M310–L321, which is disordered in the single LIM domain complexes, becomes ordered when both LIM domains are present. At this stage no measurements of binding affinity exist for the isolated Lmo2LIM2–Ldb1 interaction, but similar solvent accessible surface areas buried by Lmo2LIM1 and Lmo2LIM2 by interaction with Ldb1 in the NMR and X-ray structures suggests a much higher binding affinity than the 10-fold increase observed for the tandem LIM domains over the isolated LIM1 domain. It seems likely that the various disorder-to-order transitions associated with these different complexes cause the binding of the tandem LIM domains to be anti-cooperative (less than the sum of the free energies of the individual interactions). We and others have observed similar effects in the interactions of other modular binding interactions, including fibronectin-binding31 and single-stranded RNA-binding systems.32,33
In summary, comparison of the structures of several LIM–Ldb1 complexes indicates that the modular binding between Ldb1 and Lmo2 and related proteins is accompanied by a series of disorder-to-order transitions, particularly in Ldb1. These transitions reduce the magnification of binding affinity that might otherwise be expected in the formation of a multi-domain complex. It was also observed that for the Ldb1–Lmo2 interaction, solution structures for each of single LIM–LID constructs provided a good indication of binding hotspots.
Materials and Methods
Expression and purification
Lmo2 refers to the mouse protein (UniProtKB/Swiss-Prot P25801) and Ldb1 refers to the mouse protein (P70662-3). Lmo2LIM2–Ldb1LID comprises residues 84–155 from Lmo2 followed by a GGSGGSGGSGG linker and residues 300–339 from Ldb1; this construct was generated as described previously.21 The protein was expressed with an N-terminal glutathione-S-transferase (GST) fusion protein in Escherichia coli BL21(DE3) cells and purified by glutathione affinity chromatography, treated with thrombin to remove the GST tag and finally subjected to size-exclusion chromatography as described previously.21–23,34
NMR spectroscopy
Protein samples (0.3–0.8 mM) were prepared in 20 mM 2-(N-morpholino)ethanesulfonic acid, 100 mM NaCl, 1 mM dithiothreitol at pH 6.5 in 90% H2O and 10% D2O or 100% D2O where appropriate. All NMR spectra were recorded at 298 K on Bruker AvanceIII 600 and 800 MHz spectrometers, both equipped with 5-mm triple resonance TCI cryoprobes. Sequential assignments of the backbone and sidechain resonances were reported previously.34 Approximate interproton distances were obtained from 1H-NOESY, 15N-edited nuclear overhauser effect spectroscopy (NOESY)-heteronuclear single quantum coherence (HSQC), and 13C-edited NOESY-HSQC spectra. An HNHA spectrum was used for the calculation of ϕ angles based on the method of Bax and Grzesiek.35 All spectra were processed in Topspin (Bruker Biospin) and were analyzed using Sparky (T. D. Goddard and D. G. Kneller, University of California at San Francisco).
Structure calculation
Nuclear overhauser effect (NOE) peaks from 2D and 3D NOESY spectra were picked manually and integrated using Sparky. Unambiguous peaks were assigned manually. All picked peaks were calibrated and used for structure calculations in CYANA 3. Backbone angle restraints (107 ϕ and ψ angles) were obtained from the program TALOS.36,37 HNHA-derived three-bond J-coupling constants38 were also used to derive an additional 45 ϕ angle dihedral restraints. Structures were calculated using a simulated annealing approach with 10,000 torsion angle dynamic steps per conformer. In order to introduce zinc ions into the structure in a manner compatible with the experimental constraints, the lowest energy structure from the CYANA 3 output was used as an input in CNS (anneal.inp script) and 20 new conformers were calculated using standard MD protocols with the distance and angle restraints from the previous step; zinc atoms and restraints to keep zinc–ligand bond lengths and angles in an appropriate range (based on LMO4 and LMO2-containing crystal structures, PDB codes 1RUT and 2XYJ) were added in this step. The 20 conformers were used to represent the solution structure of Lmo2LIM2–Ldb1LID. Analysis of geometrical properties were performed using the Protein Structure Validation Suite (available from the BioMagResBank, BMRB) and PROCHECK_NMR.39 The structure coordinates and the chemical shift data have been deposited in the Protein Data Bank (PDB code: 2LXD) and the BMRB database (BMRB code: 16779), respectively. Solvent accessible surfaces areas were calculated using MolMol.40 Images of protein structures were generated using PyMOL.
Supplementary material
Additional Supporting Information may be found in the online version of this article.
References
- 1.Warren AJ, Colledge WH, Carlton MB, Evans MJ, Smith AJ, Rabbitts TH. The oncogenic cysteine-rich LIM domain protein rbtn2 is essential for erythroid development. Cell. 1994;78:45–57. doi: 10.1016/0092-8674(94)90571-1. [DOI] [PubMed] [Google Scholar]
- 2.McCormack MP, Young LF, Vasudevan S, de Graaf CA, Codrington R, Rabbitts TH, Jane SM, Curtis DJ. The Lmo2 oncogene initiates leukemia in mice by inducing thymocyte self-renewal. Science. 2010;327:879–883. doi: 10.1126/science.1182378. [DOI] [PubMed] [Google Scholar]
- 3.Visvader JE, Mao X, Fujiwara Y, Hahm K, Orkin SH. The LIM-domain binding protein Ldb1 and its partner LMO2 act as negative regulators of erythroid differentiation. Proc Natl Acad Sci USA. 1997;94:13707–13712. doi: 10.1073/pnas.94.25.13707. [DOI] [PMC free article] [PubMed] [Google Scholar]
- 4.Yamada Y, Warren AJ, Dobson C, Forster A, Pannell R, Rabbitts TH. The T cell leukemia LIM protein Lmo2 is necessary for adult mouse hematopoiesis. Proc Natl Acad Sci USA. 1998;95:3890–3895. doi: 10.1073/pnas.95.7.3890. [DOI] [PMC free article] [PubMed] [Google Scholar]
- 5.Yamada Y, Pannell R, Forster A, Rabbitts TH. The LIM-domain protein Lmo2 is a key regulator of tumour angiogenesis: a new anti-angiogenesis drug target. Oncogene. 2002;21:1309–1315. doi: 10.1038/sj.onc.1205285. [DOI] [PubMed] [Google Scholar]
- 6.Yamada Y, Pannell R, Forster A, Rabbitts TH. The oncogenic LIM-only transcription factor Lmo2 regulates angiogenesis but not vasculogenesis in mice. Proc Natl Acad Sci USA. 2000;97:320–324. doi: 10.1073/pnas.97.1.320. [DOI] [PMC free article] [PubMed] [Google Scholar]
- 7.Nam CH, Rabbitts TH. The role of LMO2 in development and in T cell leukemia after chromosomal translocation or retroviral insertion. Mol Ther. 2006;13:15–25. doi: 10.1016/j.ymthe.2005.09.010. [DOI] [PubMed] [Google Scholar]
- 8.Neale GA, Rehg JE, Goorha RM. Ectopic expression of rhombotin-2 causes selective expansion of CD4-CD8− lymphocytes in the thymus and T-cell tumors in transgenic mice. Blood. 1995;86:3060–3071. [PubMed] [Google Scholar]
- 9.Nam CH, Lobato MN, Appert A, Drynan LF, Tanaka T, Rabbitts TH. An antibody inhibitor of the LMO2-protein complex blocks its normal and tumorigenic functions. Oncogene. 2008;27:4962–4968. doi: 10.1038/onc.2008.130. [DOI] [PubMed] [Google Scholar]
- 10.Appert A, Nam C-H, Lobato N, Priego E, Miguel RN, Blundell T, Drynan L, Sewell H, Tanaka T, Rabbitts T. Targeting LMO2 with a peptide aptamer establishes a necessary function in overt T-cell neoplasia. Cancer Res. 2009;69:4784–4790. doi: 10.1158/0008-5472.CAN-08-4774. [DOI] [PMC free article] [PubMed] [Google Scholar]
- 11.Matthews JM, Bhati M, Lehtomaki E, Mansfield RE, Cubeddu L, Mackay JP. It takes two to tango: the structure and function of LIM, RING, PHD and MYND domains. Curr Pharm Des. 2009;15:3681–3696. doi: 10.2174/138161209789271861. [DOI] [PubMed] [Google Scholar]
- 12.Grutz GG, Bucher K, Lavenir I, Larson T, Larson R, Rabbitts TH. The oncogenic T cell LIM-protein Lmo2 forms part of a DNA-binding complex specifically in immature T cells. EMBO J. 1998;17:4594–4605. doi: 10.1093/emboj/17.16.4594. [DOI] [PMC free article] [PubMed] [Google Scholar]
- 13.Vitelli L, Condorelli G, Lulli V, Hoang T, Luchetti L, Croce CM, Peschle C. A pentamer transcriptional complex including tal-1 and retinoblastoma protein downmodulates c-kit expression in normal erythroblasts. Mol Cell Biol. 2000;20:5330–5342. doi: 10.1128/mcb.20.14.5330-5342.2000. [DOI] [PMC free article] [PubMed] [Google Scholar]
- 14.Wadman IA, Osada H, Grutz GG, Agulnick AD, Westphal H, Forster A, Rabbitts TH. The LIM-only protein Lmo2 is a bridging molecule assembling an erythroid, DNA-binding complex which includes the TAL1, E47, GATA-1 and Ldb1/NLI proteins. EMBO J. 1997;16:3145–3157. doi: 10.1093/emboj/16.11.3145. [DOI] [PMC free article] [PubMed] [Google Scholar]
- 15.Agulnick AD, Taira M, Breen JJ, Tanaka T, Dawid IB, Westphal H. Interactions of the LIM-domain-binding factor Ldb1 with LIM homeodomain proteins. Nature. 1996;384:270–272. doi: 10.1038/384270a0. [DOI] [PubMed] [Google Scholar]
- 16.Jurata LW, Kenny DA, Gill GN. Nuclear LIM interactor, a rhombotin and LIM homeodomain interacting protein, is expressed early in neuronal development. Proc Natl Acad Sci USA. 1996;93:11693–11698. doi: 10.1073/pnas.93.21.11693. [DOI] [PMC free article] [PubMed] [Google Scholar]
- 17.Bach I, CarriAre C, Ostendorff HP, Andersen B, Rosenfeld MG. A family of LIM domain-associated cofactors confer transcriptional synergism between LIM and Otx homeodomain proteins. Genes Dev. 1997;11:1370–1380. [Google Scholar]
- 18.Matthews JM, Visvader JE. LIM-domain-binding protein 1: a multifunctional cofactor that interacts with diverse proteins. EMBO Rep. 2003;4:1132–1137. doi: 10.1038/sj.embor.7400030. [DOI] [PMC free article] [PubMed] [Google Scholar]
- 19.Mukhopadhyay M, Teufel A, Yamashita T, Agulnick AD, Chen L, Downs KM, Schindler A, Grinberg A, Huang SP, Dorward D, Westphal H. Functional ablation of the mouse Ldb1 gene results in severe patterning defects during gastrulation. Development. 2003;130:495–505. doi: 10.1242/dev.00225. [DOI] [PubMed] [Google Scholar]
- 20.Deane JE, Sum E, Mackay JP, Lindeman GJ, Visvader JE, Matthews JM. Design, production and characterization of FLIN2 and FLIN4: the engineering of intramolecular ldb1:LMO complexes. Protein Eng. 2001;14:493–499. doi: 10.1093/protein/14.7.493. [DOI] [PubMed] [Google Scholar]
- 21.Ryan DP, Sunde M, Kwan AH, Marianayagam NJ, Nancarrow AL, Vanden Hoven RN, Thompson LS, Baca M, Mackay JP, Visvader JE, Matthews JM. Identification of the key LMO2-binding determinants on Ldb1. J Mol Biol. 2006;359:66–75. doi: 10.1016/j.jmb.2006.02.074. [DOI] [PubMed] [Google Scholar]
- 22.Deane JE, Mackay JP, Kwan AH, Sum EY, Visvader JE, Matthews JM. Structural basis for the recognition of ldb1 by the N-terminal LIM domains of LMO2 and LMO4. EMBO J. 2003;22:2224–2233. doi: 10.1093/emboj/cdg196. [DOI] [PMC free article] [PubMed] [Google Scholar]
- 23.El Omari K, Hoosdally SJ, Tuladhar K, Karia D, Vyas P, Patient R, Porcher C, Mancini EJ. Structure of the leukemia oncogene LMO2: implications for the assembly of a hematopoietic transcription factor complex. Blood. 2011;117:2146–2156. doi: 10.1182/blood-2010-07-293357. [DOI] [PubMed] [Google Scholar]
- 24.Kwan AH, Mobli M, Gooley PR, King GF, Mackay JP. Macromolecular NMR spectroscopy for the non-spectroscopist. FEBS J. 2011;278:687–703. doi: 10.1111/j.1742-4658.2011.08004.x. [DOI] [PubMed] [Google Scholar]
- 25.Deane JE, Ryan DP, Sunde M, Maher MJ, Guss JM, Visvader JE, Matthews JM. Tandem LIM domains provide synergistic binding in the LMO4:Ldb1 complex. EMBO J. 2004;23:3589–3598. doi: 10.1038/sj.emboj.7600376. [DOI] [PMC free article] [PubMed] [Google Scholar]
- 26.Jeffries CM, Graham SC, Stokes PH, Collyer CA, Guss JM, Matthews JM. Stabilization of a binary protein complex by intein-mediated cyclization. Protein Sci. 2006;15:2612–2618. doi: 10.1110/ps.062377006. [DOI] [PMC free article] [PubMed] [Google Scholar]
- 27.Bhati M, Lee C, Nancarrow AL, Lee M, Craig VJ, Bach I, Guss JM, Mackay JP, Matthews JM. Implementing the LIM code: the structural basis for cell type-specific assembly of LIM-homeodomain complexes. EMBO J. 2008;27:2018–2029. doi: 10.1038/emboj.2008.123. [DOI] [PMC free article] [PubMed] [Google Scholar]
- 28.Perez-Alvarado GC, Miles C, Michelsen JW, Louis HA, Winge DR, Beckerle MC, Summers MF. Structure of the carboxy-terminal LIM domain from the cysteine rich protein CRP [see comments] Nat Struct Biol. 1994;1:388–398. doi: 10.1038/nsb0694-388. [DOI] [PubMed] [Google Scholar]
- 29.Berjanskii MV, Wishart DS. A simple method to predict protein flexibility using secondary chemical shifts. J Am Chem Soc. 2005;127:14970–14971. doi: 10.1021/ja054842f. [DOI] [PubMed] [Google Scholar]
- 30.Gadd MS, Bhati M, Jeffries CM, Langley DB, Trewhella J, Guss JM, Matthews JM. Structural basis for partial redundancy in a class of transcription factors, the LIM homeodomain proteins, in neural cell type specification. J Biol Chem. 2011;286:42971–42980. doi: 10.1074/jbc.M111.248559. [DOI] [PMC free article] [PubMed] [Google Scholar]
- 31.Schwarz-Linek U, Werner JM, Pickford AR, Gurusiddappa S, Kim JH, Pilka ES, Briggs JA, Gough TS, Hook M, Campbell ID, Potts JR. Pathogenic bacteria attach to human fibronectin through a tandem beta-zipper. Nature. 2003;423:177–181. doi: 10.1038/nature01589. [DOI] [PubMed] [Google Scholar]
- 32.Loughlin FE, Mansfield RE, Vaz PM, McGrath AP, Setiyaputra S, Gamsjaeger R, Chen ES, Morris BJ, Guss JM, Mackay JP. The zinc fingers of the SR-like protein ZRANB2 are single-stranded RNA-binding domains that recognize 5′ splice site-like sequences. Proc Natl Acad Sci USA. 2009;106:5581–5586. doi: 10.1073/pnas.0802466106. [DOI] [PMC free article] [PubMed] [Google Scholar]
- 33.O'Connell MR, Vandevenne M, Nguyen CD, Matthews JM, Gamsjaeger R, Segal DJ, Mackay JP. Modular assembly of RanBP2-type zinc finger domains to target single-stranded RNA. Angew Chem Int Ed. 2012;51:5371–5375. doi: 10.1002/anie.201200866. [DOI] [PubMed] [Google Scholar]
- 34.Wilkinson-White LE, Dastmalchi S, Kwan AH, Ryan DP, Mackay JP, Matthews JM. 1H, 15N and 13C assignments of an intramolecular Lmo2-LIM2/Ldb1-LID complex. Biomol NMR Assign. 2010;4:203–206. doi: 10.1007/s12104-010-9240-y. [DOI] [PubMed] [Google Scholar]
- 35.Bax A, Grzesiek S. Methodological advances in protein NMR. Acc Chem Res. 1993;26:131–138. [Google Scholar]
- 36.Shen Y, Delaglio F, Cornilescu G, Bax A. TALOS+: a hybrid method for predicting protein backbone torsion angles from NMR chemical shifts. J Biomol NMR. 2009;44:213–223. doi: 10.1007/s10858-009-9333-z. [DOI] [PMC free article] [PubMed] [Google Scholar]
- 37.Cornilescu G, Delaglio F, Bax A. Protein backbone angle restraints from searching a database for chemical shift and sequence homology. J Biomol NMR. 1999;13:289–302. doi: 10.1023/a:1008392405740. [DOI] [PubMed] [Google Scholar]
- 38.Vuister GW, Bax A. Quantitative J correlation: a new approach for measuring homonuclear three-bond J(HNHα) coupling constants in 15N-enriched proteins. J Am Chem Soc. 1993;115:7772–7777. [Google Scholar]
- 39.Laskowski RA, Rullmannn JA, MacArthur MW, Kaptein R, Thornton JM. AQUA and PROCHECK-NMR: programs for checking the quality of protein structures solved by NMR. J Biomol NMR. 1996;8:477–486. doi: 10.1007/BF00228148. [DOI] [PubMed] [Google Scholar]
- 40.Koradi R, Billeter M, Wüthrich K. MOLMOL: a program for display and analysis of macromolecular structures. J Mol Graphics. 1996;14:51–55. doi: 10.1016/0263-7855(96)00009-4. [DOI] [PubMed] [Google Scholar]
Associated Data
This section collects any data citations, data availability statements, or supplementary materials included in this article.