

Although high-throughput techniques such as microarrays and RNA-seq are powerful methods for monitoring mRNA levels and alternative splicing, it remains important to validate a subset of the results using alternate technologies. In this paper, the authors perform a systematic evaluation of two medium-throughput platforms for measuring mRNA abundance. The results provide useful guidance to researchers considering alternative methods for validating high-throughput mRNA expression data.
Keywords: mRNA abundance, real-time RT-PCR, NanoString, OpenArray
Abstract
Profiling of mRNA abundances with high-throughput platforms such as microarrays and RNA-seq has become an important tool in both basic and biomedical research. However, these platforms remain prone to systematic errors and have challenges in clinical and industrial applications. As a result, it is standard practice to validate a subset of key results using alternate technologies. Similarly, clinical and industrial applications typically involve transitions from a high-throughput discovery platform to medium-throughput validation ones. These medium-throughput validation platforms have high technical reproducibility and reduced sample input needs, and low sensitivity to sample quality (e.g., for processing FFPE specimens). Unfortunately, while medium-throughput platforms have proliferated, there are no comprehensive comparisons of them. Here we fill that gap by comparing two key medium-throughput platforms—NanoString's nCounter Analysis System and ABI's OpenArray System—to gold-standard quantitative real-time RT-PCR. We quantified 38 genes and positive and negative controls in 165 samples. Signal:noise ratios, correlations, dynamic range, and detection accuracy were compared across platforms. All three measurement technologies showed good concordance, but with divergent price/time/sensitivity trade-offs. This study provides the first detailed comparison of medium-throughput RNA quantification platforms and provides a template and a standard data set for the evaluation of additional technologies.
INTRODUCTION
The emergence of functional genomics as a discipline has largely been driven by technological improvements in our ability to evaluate cellular mRNA abundances. Measurement of the level of each transcript, for instance, by using microarray-based approaches, provides a “snapshot” of the status of cells and tissues and can be used to assess responses to genetic, pharmacological, and environmental perturbations. For example, classic studies have demonstrated that mRNA abundance profiles can be used to identify different disease subtypes (Golub et al. 1999) or even to identify patients likely to have specific outcomes or responses to therapy (van de Vijver et al. 2002; Boutros et al. 2009). Indeed, it has been postulated that biomarkers exist for the early detection and early treatment of numerous disorders (Goodkind and Edwards 2005). Similarly, many pharmacological or toxicological agents alter gene expression (Kopec et al. 2012; Yao et al. 2012), and mRNA abundance profiles can be used to create biomarkers of exposure to foreign chemicals as well as to facilitate understanding of mechanisms of basic physiological responses (Van Hummelen and Sasaki 2010; Uehara et al. 2011). These studies are often done in a huge range of animal models (Hook et al. 2006).
While mRNA abundance profiles clearly hold critical information, their use in commercial and medical applications has been delayed by technological factors. In particular, analysis of archival formalin-fixed paraffin-embedded (FFPE) tissues has been critical for many medical applications. Furthermore, cost, signal noise, and data-analysis limitations have limited the adoption of transcriptome-wide profiling methods. For example, the limited length of microarray probes (25–100 bp) can result in nonspecific binding of transcripts (Zhang et al. 2002), particularly in disease states. Instead, many groups have sought to develop multigene biomarkers (sometimes called “signatures”) composed of tens to hundreds of genes that could be assayed using technologies with superior performance on FFPE material, reduced cost, and increased performance (Chen et al. 2012; Kratz et al. 2012; Lenehan et al. 2012).
Initially, low-throughput technologies, such as Northern blots and quantitative real-time PCR (qPCR), were used to assess biomarkers composed of a small number of clearly defined genes (Lau et al. 2007; Sparano and Paik 2008). These technologies are currently used for situations (1) requiring fast results, (2) with minimal sample available, or (3) requiring clinical certification. For example, in a clinical setting in which a patient requires a lung transplant and the physician requires the mRNA abundance results from the patient's biopsy within 1 h, low-throughput techniques are used (Kaneda et al. 2006). The high specificity and sensitivity of qPCR make it the typical method for validation of results initially obtained from high-throughput methods such as microarrays. Unfortunately, qPCR can be labor intensive and time consuming and requires a large quantity of cDNA.
As a response to these limitations, several companies have recently developed medium-throughput technologies for measuring mRNA abundances. These are intended to allow analysis of tens to hundreds of genes on a large number of samples more rapidly and efficiently than qPCR, but with noise and cost characteristics more favorable than high-throughput methods. Specifically, medium-throughput methods are beneficial (1) when performing validation on candidate genes, (2) in the presence of limited analyte, and (3) for use in clinical settings where speed and data quality are critical.
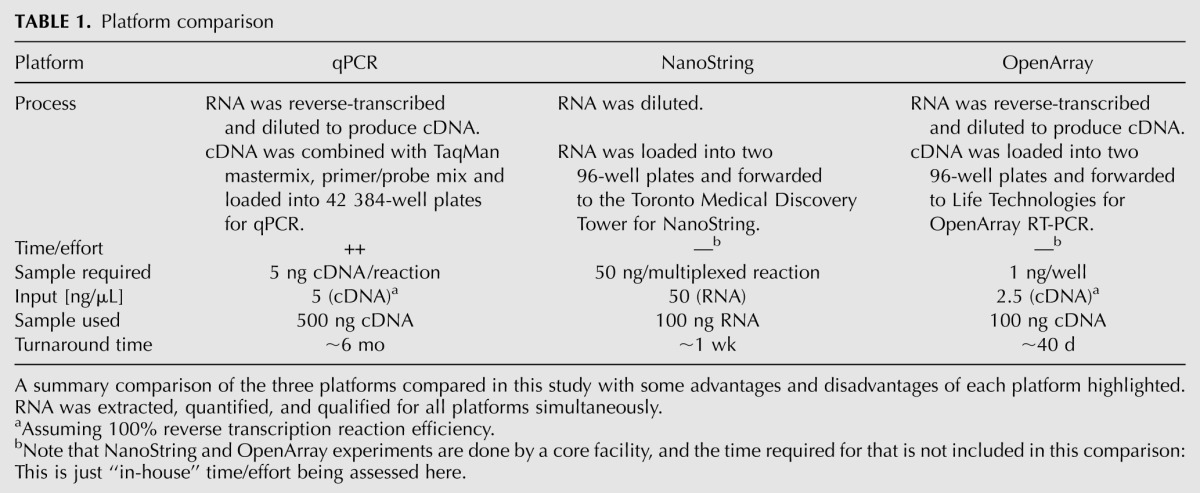
Two of the most prominent medium-throughput technologies are the hybridization-based nCounter Gene Expression Assay (NanoString Technologies) and the PCR-based TaqMan OpenArray Real-Time PCR Assay (Applied Biosystems). NanoString nCounter custom assays are available in formats that accommodate 48, 96, 192, or 384 samples, which allows either large- or small-scale projects as necessary. NanoString uses a combination of capture probes and unique, color-coded reporter probes that allow for highly multiplexed reactions using 100 ng of RNA, making it applicable in situations in which sample is scarce. Both the capture and reporter probes contain target-specific sequences (35–50 bp) but differ in that the capture probe is attached to a biotin tag for target capture while the reporter probe terminates in a target-specific color-coded tag for detection. The length of these probes is similar to that used for microarray hybridization; however, the dual-probe system results in more accurate signal capture as ensured by three factors: first, both probes are present in solution, allowing for more direct interaction with targets; second, the reaction is carried through to completion to ensure all targets are counted; and finally, the digital readout provides less noisy results than analog systems (Geiss et al. 2008). Once probes are synthesized, the detection process can be completed in 2–3 d (NanoString Technologies). In contrast, TaqMan OpenArray Real-Time PCR assays are available in 18, 56, 112, 168, and 224 formats, allowing 48 (in triplicate), 48, 24, 16, or 12 (in singular) samples per plate. The design of OpenArray assay plates requires only nanoliters of reagent, thereby reducing sample requirement to only 1 ng per reaction. The workflow of this platform permits progression from sample introduction to data output in ∼3 h (Life Technologies). Both technologies provide clear advantages over standard qPCR (Table 1).
TABLE 1.
Platform comparison
To date, despite some limited work (Palamanda et al. 2009), no independent group has systematically and comprehensively compared these platforms to one another and to gold-standard qPCR assays. As a result, it remains unclear which of these platforms is best suited to analysis of clinical samples for personalized medicine or for validation of microarray targets. Here, we fill that gap by evaluating 38 genes in 165 samples in all three platforms. We compare detection of negative and positive controls, intraplatform repeatability, interplatform correlation, dynamic range, and the effects of data preprocessing.
RESULTS
mRNA profiling
As a biological model for assessing performance of medium-throughput methods, we chose hepatic gene expression in rats treated with the potent environmental toxicant, 2,3,7,8-tetrachlorodibenzo-p-dioxin (TCDD). TCDD, at very low doses, causes a wide spectrum of toxic effects in rodents (for review, see Pohjanvirta and Tuomisto 1994). These toxicities are fundamentally due to dysregulation of gene expression mediated by the aryl hydrocarbon receptor (for review, see Okey 2007). Numerous high-throughput studies have been conducted to identify the key genes whose altered expression underlies dioxin toxicity (Pohjanvirta et al. 2006; Boutros et al. 2008, 2011; Franc et al. 2008; Ovando et al. 2010). TCDD causes very large changes in expression of several genes—up to 1000-fold or more along with modest changes in expression of numerous other genes (Tijet et al. 2006; Franc et al. 2008; Moffat et al. 2010). Because mRNA levels differ dramatically between control animals and animals treated with TCDD, this provided us a highly suitable model in which to compare methods for quantification of multiple mRNAs over a very wide range of abundances.
The purpose of this study was to evaluate the effectiveness and applicability of two mRNA abundance detection platforms, NanoString and OpenArray, relative to “gold-standard” qPCR. The experimental workflow from animal treatment through data analysis is outlined in Figure 1A. We used a total of 165 animals: 80 male L-E rats and 85 male H/W rats. These animals were treated with either corn oil vehicle or TCDD (0.001–3000 μg/kg) and the livers collected at a range of time points (from 1.5 h to 16 d) (Fig. 1B). 2,3,7,8-Tetrachlorodibenzo-p-dioxin (TCDD) is an environmental contaminant that produces a wide range of toxic responses in laboratory animals. It was chosen for this study for the availability of positive and negative controls that provide a large dynamic range of transcriptomic responses (Pohjanvirta et al. 2006; Franc et al. 2008). L-E and H/W rats were chosen for their differential TCDD sensitivity: L-E rats are highly sensitive to the acute lethality of TCDD (LD50 ≈ 10 μg/kg) (Pohjanvirta 1990), while H/W rats are extremely resistant (LD50 > 9600 μg/kg) (Unkila et al. 1994). These strains have been extensively studied and have well-characterized TCDD-induced differential expression patterns (Franc et al. 2008; Boutros et al. 2011). A total of 38 genes were commonly analyzed by qPCR, NanoString, and OpenArray RT-PCR (Fig. 1C), including two reference genes, three Aryl Hydrocarbon Receptor-related genes, and 33 genes previously determined to be significantly altered by TCDD at a single dose and time point in both mice and rats (Boutros et al. 2008). The relative and/or absolute mRNA abundance for the above genes was measured using each platform and analyzed to determine the intra- and interplatform reliability and repeatability.
FIGURE 1.

(A) Outline of the experimental design and workflow for this study from animal treatment to data analysis. (B) Graphical representation of the TCDD dose (in micrograms per kilogram, μg/kg) and the time of collection for Long-Evans (left panel) and Han/Wistar (right panel) rats. The dose–response study was performed on tissues collected at 19 h (vertical bar), while the time-course study was performed using a dose of 100 μg/kg (horizontal bar). The number of animals included in each group is indicated by the gradient. (C) mRNA levels for 38 genes were measured across all three platforms.
Data preprocessing and reference genes
The platforms used produce data with different units, either Cq values (qPCR and OpenArray) or direct mRNA counts (NanoString). To standardize our comparison between the platforms, we used normalized expression levels (NELs) of each gene for all downstream analysis. NELs were calculated from raw Cq values for both qPCR and OpenArray methods as described previously (Methods) (see Barsyte-Lovejoy et al. 2006). The NanoString mRNA counts required additional preprocessing to normalize to internal controls before NEL calculation. The NELs were calculated using reference genes previously shown to be unaffected by TCDD in rats (Pohjanvirta et al. 2006) and log2-transformed.
Two reference genes (Gapdh and Pgk1) were available for the qPCR analysis, while both OpenArray and NanoString measured seven reference genes (Eef1a1, Gapdh, Hprt1, Pgk1, Ppia, Rpl13a, and Sdha). We validated the efficacy of all reference genes used on each platform: A Pearson's correlation was performed using the mRNA levels for the reference genes on each platform (Fig. 2A,B; Supplemental Fig. 1). These data show a poor correlation of the reference gene Rpl13a with other reference genes on the OpenArray platform as well as a low correlation of the genes Rpl13a and Pgk1 with other reference genes measured on NanoString. Time-course and dose–response plots (Fig. 2C,D; Supplemental Fig. 2) were created for the reference genes for each platform. These data confirm that the reference gene Rpl13a was not well correlated with the other reference genes in the OpenArray study; thus, Rpl13a was removed from further analysis. Similarly, Rpl13a and Pgk1 were removed from further analysis of the NanoString data based on the low correlations with other reference genes. The stability of the remaining reference genes across multiple platforms further validates Eef1a1, Gapdh, Hprt1, Ppia, and Sdha as reference genes for studies of dioxin-treated rat liver (Pohjanvirta et al. 2006).
FIGURE 2.

The reference genes used for the NanoString and OpenArray RT-PCR analyses were validated before downstream analysis. (A) The Pearson's correlations between each of the reference genes presented as a heatmap as analyzed by NanoString or (B) OpenArray. (C) The time-course response of the reference gene mRNA levels following TCDD treatment (100 μg/kg) as determined using NanoString or (D) OpenArray.
Intraplatform repeatability
We evaluated technical and biological variability in each platform by comparing signal-to-noise ratios (SNRs). The SNR was calculated as the ratio of the mean NEL to the inter-replicate standard deviation. The mean NELs were shifted to have a minimum value equal to zero to account for artifacts of reference gene normalization. The SNR for the common gene set using the standard deviation of the technical replicates for qPCR and OpenArray was visualized (Supplemental Fig. 3A). OpenArray displays greater technical reproducibility than qPCR. The NanoString experiment was performed without technical replicates; therefore, it was not possible to evaluate technical repeatability.
As expected, there is more biological variability in each platform (Supplemental Fig. 3B) than technical variability (Supplemental Fig. 3A). Interesting, the raw data from qPCR show more consistency between replicate samples than do those of OpenArray or NanoString. To determine if this holds true for the final conclusions, we examined the coefficient of variation (CV) of the fold changes (Supplemental Fig. 3C). Fold changes were calculated using the corn-oil vehicle-treated animals collected at 19 h post-administration for biological sample replicates. Unlike the raw data, fold changes show lower intraplatform repeatability by qPCR than by OpenArray or NanoString, and this does not appear to be a function of high-expression mRNAs (Supplemental Fig. 3D). These results suggest that the three platforms differ in their bias/variance trade-off, with qPCR having significantly more variance than the other two platforms.
Dynamic range
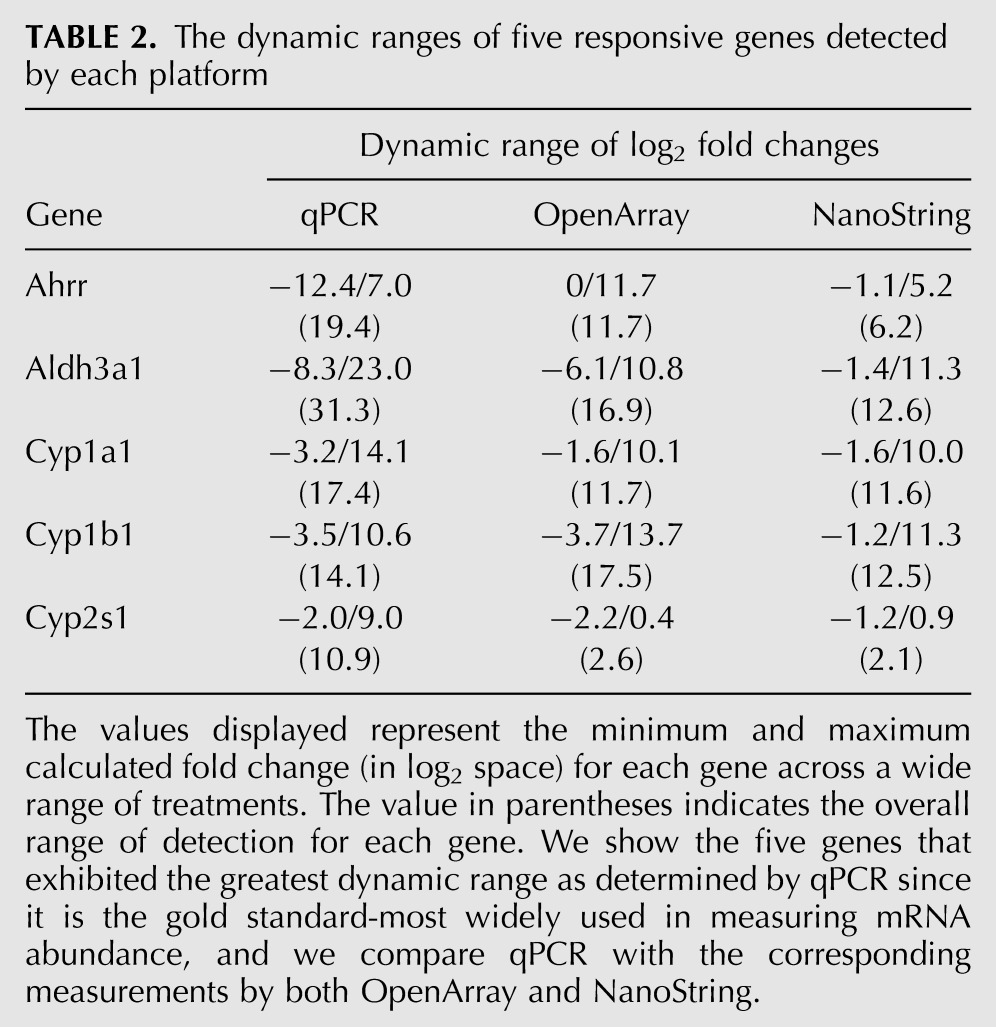
The dynamic range of detection was analyzed to determine the ability of each platform to accurately quantitate mRNA levels when a particular mRNA is present at varying levels between sample groups. The fold changes for five known TCDD up-regulated genes (Table 2) were examined (Korkalainen et al. 2004; Franc et al. 2008; Deb and Bandiera 2010). These data show that qPCR displays the greatest range of detection, with a greater than 230-fold range. OpenArray and NanoString display detections in a 217- and 212-fold range, respectively. These results are consistent with the bias/variance observations noted in our SNR and CV analyses above (Supplemental Fig. 3). A large dynamic range allows detection of both high and low expression levels; however, the difference in measured fold changes among platforms brings into question the accuracy of that detection. The detected values present at either end of the dynamic range may be true measurements or may result from technical artifacts. Therefore, we verified these measurements by analyzing the concordance of these data with previous data collected from microarray experiments as described in the following section.
TABLE 2.
The dynamic ranges of five responsive genes detected by each platform
Comparison with microarray data
The genes analyzed in this study were a subset of data from a previous study by Boutros et al. (2008) that were determined to be relevant to TCDD toxicity in Long-Evans rats. The genes we evaluated possess a wide range of fold changes following treatment with 100 μg/kg TCDD for 19 h and were compared with changes calculated from data collected from each NanoString, OpenArray, and qPCR (Supplemental Table 1) at the same treatment. These data show that lower mRNA levels are detected by these three platforms relative to results generated by the previous array study. The magnitude of this effect ranged from ∼15% (OpenArray) to ∼20% (NanoString) to as much as 50% (qPCR). The fold changes for each platform were plotted against those from the previous array study and Spearman's correlations calculated (Fig. 3). Both NanoString (ρ = 0.92, p = 3.58 × 10⁻¹⁴) and OpenArray (ρ = 0.94, p = 2.52 × 10⁻¹⁶) are well correlated with microarray data and show similar statistically significant fold changes as those selected through the previous study. Aside from confirming the different trade-offs between platforms, these data demonstrate strong interplatform concordance.
FIGURE 3.

Fold changes from each platform were plotted against fold changes calculated using microarray data from a previous study for the genes evaluated on all platforms (Boutros et al. 2008). Fold changes measured through (A) qPCR analysis show a lower correlation with the microarray study than either (B) NanoString or (C) OpenArray as indicated by the low Spearman's correlation (ρ).
Interplatform variability
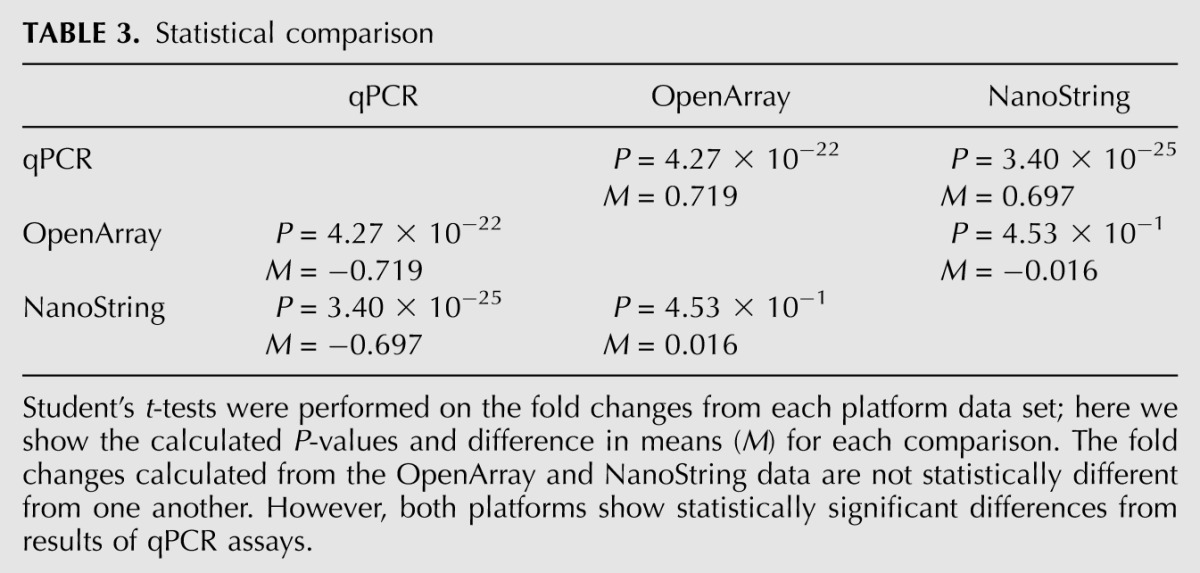
The fold changes for the mRNAs shared across each platform were compared. Fold changes from each pair of platforms were plotted and Pearson's correlation values calculated (Fig. 4A–C). Here we show a strong correlation between the NanoString and OpenArray data (R = 0.95) but a lower correlation of either of OpenArray (R = 0.48) or NanoString (R = 0.55) with the qPCR data. Paired Student's t-tests were performed using the fold changes for each mRNA species/animal from each platform data set to analyze the difference in detection (Table 3). These results confirmed the above conclusion that NanoString and OpenArray provided similar results, whereas qPCR differed significantly from both.
FIGURE 4.

Fold changes for genes common to all platforms were compared with measure interplatform performance. (A) Pearson's correlations were calculated for the comparison between qPCR and OpenArray, (B) qPCR and NanoString, and (C) NanoString and OpenArray. The time-course and dose–response plots for two well-known TCDD-regulated genes, (D) Cyp1b1 and (E) Inmt, were created and compared across all platforms.
TABLE 3.
Statistical comparison
The time-course and dose-dependent response plots for two TCDD-affected genes—one highly up-regulated gene, Cyp1b1 (Fig. 4D), and one down-regulated, Inmt (Fig. 4E)—were compared across all platforms. The fold changes (in log2 scale) were plotted against either time or dose, and the standard error of the mean was used to display the variability between replicate animals. In all cases, the data from TCDD-sensitive and TCDD-resistant rats were plotted as separate groups to visualize the difference in TCDD effect. These data show surprising variability between platforms in the mRNA levels for both Cyp1b1 and Inmt. Specifically, the repressed Cyp1b1 response, present at low doses (<1 μg/kg TCDD), deviates from the expected induction as a result of TCDD exposure. Previous experiments using both TCDD sensitive and TCDD-resistant rats and transgenic mice expressing rat AHR isoforms have consistently shown up-regulation of Cyp1b1 following exposure to even low doses of TCDD (Boutros et al. 2008, 2011; Franc et al. 2008; Pohjanvirta 2009). Also, the dose–response for Inmt by L-E rats, as detected by qPCR varies from the repression described in previous literature (Boutros et al. 2008, 2011). Despite these points, all platforms detect the expected overall trend in expression for each of these genes.
NanoString normalization method comparison
As the newest of the three platforms, the preprocessing approaches for NanoString data remain poorly described. We thus sought to demonstrate if differing preprocessing methodologies could alter the observed platform comparison. NanoString Technologies recommends normalizing mRNA counts using both positive, spiked-in RNA hybridization controls (to account for hybridization efficiency) and negative hybridization controls (to account for technical background noise). It is also suggested to normalize the counts to endogenous reference genes to account for the sample content (see Materials and Methods). To determine a preferred overall normalization method, the data were renormalized by varying each step of the initial normalization procedure in the R statistical environment using the NanoStringNorm R package (v0.9.4) (Waggott et al. 2012). The reference genes Eef1a1, Gapdh, Hprt1, Ppia, and Sdha were used in the sample content normalization. Data sets were generated using multiple representative combinations of normalization methods.
To demonstrate that our results are not an artifact of the software package used, we have replicated these results using NanoString's nSolver software. Again we used Eef1a1, Gapdh, Hprt1, Ppia, and Sdha as reference genes for sample content normalization. These data are given in Supplemental Table 2.
To compare different analysis methods, we calculated the fold change for each gene and compared these with the qPCR and OpenArray data sets. The range of the fold changes for two typical TCDD-inducible genes, Ahrr and Cyp1a1, was determined for each combination (Supplemental Table 2). Figure 5 compares six representative NanoStringNorm normalization methods against qPCR data; similar comparisons with OpenArray data are available in Supplemental Figure 4.
FIGURE 5.

NanoString Technologies suggests numerous methods for normalization of the mRNA counts. We compared variations of our initial method to determine whether or not the correlation with our qPCR data could be improved. (A) Our initial normalization involved using only the positive control counts and reference gene counts. Alternate methods analyzed include (B) using only the positive control counts, (C) adding the quantile distribution method to the method in A, (D,E) adding various background noise subtraction methods—either the mean or maximum background count was subtracted—to A, and (F) using a different positive control count normalization.
We demonstrate a profound sensitivity of NanoString data to preprocessing approaches. For example, removing sample-content normalization entirely has minimal effect (Fig. 5A vs. 5B), but application of the very commonly applied quantile-normalization procedure completely eliminates the correlation with qPCR data (Fig. 5A vs. 5C). Similarly, introduction of background correction procedures (Fig. 5D,E) reduces performance. The default approach suggested by NanoString (Fig. 5F) works well on this data set, although these results strongly motivate further work into optimizing NanoString data preprocessing techniques.
DISCUSSION
mRNA abundance analysis has become a critical tool in numerous fields of biology, ranging from biomedicine (Kaneda et al. 2006; Lau et al. 2007; Boutros et al. 2009) through to agriculture (Wang et al. 2011). While several high-throughput methods for measuring mRNA abundance, like microarrays and RNA-seq, are available, these are not generally appropriate for “production” applications. In clinical settings in particular, the detection and measurement of biomarkers and prognostic markers typically require analysis of a small subset of genes from very limited patient material, and with data quality and cost as key factors. The recent development of medium-throughput platforms that can be used for large-scale validation and production studies is a key step in the translation of mRNA-based tools into medical and commercial use.
We compared the performance of three medium-throughput mRNA abundance measurement technologies. We chose to mirror potential clinical applications by using a large sample number (n = 165). We selected to use 38 genes because most proposed biomarkers are of similar size. We selected to focus on genes associated with TCDD toxicity for several reasons. First, we have significant experience in this area of research, and our work along with that of other groups allows ready interpretation of the results of this study. Second, TCDD induces a broad range of changes that include very large magnitude effects and very small ones. This allowed us to generate an accurate assessment of dynamic range for each platform. Third, by focusing on an animal model, we could evaluate both technical and biological variability in a reproducible way. In fact, additional tissue, RNA, and cDNA from each of these animals are available for further evaluations of other platforms and technologies. The three key findings from this work are (1) strong general agreement between the various analysis platforms, (2) small but important differences between platforms in their optimal usage, and (3) clear and important effects of data preprocessing and analysis. We discuss each of these in turn.
The most prominent finding of this evaluation is very good interplatform consistency. Both the raw and analyzed data showed good correlations between the three medium-throughput platforms, as well as in comparison to archival microarray data (Figs. 3, 4). In particular, NanoString and OpenArray data were very well correlated (R = 0.95; P < 2.2 × 10⁻¹⁶). Surprisingly, it was actually qPCR data that exhibited more variability with a moderate correlation (R = 0.55) with the NanoString data. These data are consistent with the results of the statistical analysis (Table 3), which show that the results obtained through OpenArray and NanoString are statistically similar, while the results from both platforms are significantly less similar to those gained through qPCR. The time-course and dose-dependent response plots were also compared for two canonical TCDD regulated genes—Cyp1b1 (Fig. 4B) and Inmt (Fig. 4C)—across all platforms. OpenArray and NanoString show a definite correlation in quantification of these mRNAs; however, it is clear that a less consistent measurement is observed using qPCR. These plots also display the reliability of each platform by producing results with the expected trends. Previous literature indicates up-regulation of Cyp1b1 (Walker et al. 1999; Boutros et al. 2008, 2011) and down-regulation of Inmt (Boutros et al. 2008, 2011) by TCDD in rodent liver. Our qPCR data for Cyp1b1 show down-regulation at low doses (<0.1 μg/kg at 19 h) of TCDD and up-regulation at higher doses in both the TCDD-sensitive and TCDD-resistant strains, with OpenArray showing a similar response in just the TCDD-sensitive strain. Our qPCR data also show a less consistent response to TCDD by Inmt than is expected in the sensitive strain. Thus all three platforms show good general concordance, but with greater variability in the PCR data.
This increased variability in the PCR data highlights some important differences in the trade-offs involved in each of the platforms. We suspect that this elevated noise, even relative to the PCR-based OpenArray platform, is due to an increased variability in the sample preparation caused by the larger amount of technician pipetting and plate setup required for conventional qPCR. To put this in perspective: qPCR data were obtained from 42 separate 384-well PCR plates prepared by three technicians with similar, but not identical, results (Supplemental Table 3) over several months, while the OpenArray RT-PCR was performed using four plates prepared by a mechanical liquid handler, and the NanoString was performed in a single reaction. The noise spectrum of these data therefore corresponds exactly to the amount of sample handling required. However, in contrast, NanoString data consistently compressed observed fold changes relative to the other two platforms. This suggests that there is a clear bias/variance trade-off across the platforms.
Our third general observation is that the platforms showed remarkable sensitivity to data-analysis considerations. Output from both the qPCR and OpenArray analysis provided raw Cq values that required no further manipulation and could be used directly for analysis. Output from the NanoString nCounter provided direct counts of the mRNA molecules present in the sample and required additional processing before the analysis to account for sample variation. Normalized expression levels were calculated using the expression of several reference genes as the normalization reference. To our surprise, the performance of reference genes varied by platform, suggesting that great care needs to be used in selecting them (Pohjanvirta et al. 2006). These platform-specific differences may be a result of slight differences in probe placement or specificity, leading to detection of distinct splice variants or other transcript isoforms. Another form of analytical variability that we discovered was a profound sensitivity of NanoString data to preprocessing methodologies. Particularly intriguing is that the quantile normalization in very wide use for microarray data (Bolstad et al. 2003; Irizarry et al. 2003) was extremely ineffective on NanoString data. These results strongly suggest that a large-scale comparison study of NanoString preprocessing methods on a gold-standard data set would be of significant value.
In summary, our platform evaluation shows that each technology has advantages and disadvantages that need to be considered on a per-application basis. Sample preparation is the greatest source for error in any application. The multiple steps from sample collection, RNA extraction, reverse transcription, and data acquisition all provide opportunities for the introduction of error. In this sense, NanoString has the simplest preparation because it does not require reverse transcription, thereby reducing the likelihood of introducing technical variation. The additional controls provided on each assay, both positive spike-in controls and negative hybridization controls, provide additional normalization options that are unavailable in qPCR. However, the multitude of potential normalization methods can prove confusing and can provide different results if not used consistently. OpenArray RT-PCR and standard qPCR have similar workflows and analyses; however, more samples and more genes can be analyzed in a single run on the OpenArray platform than with standard qPCR. Another consideration is the amount of sample and/or other reagents available for analysis. Data in this study were generated using 100 ng of RNA either directly for NanoString or for conversion to cDNA for OpenArray RT-PCR with ∼500 ng of RNA converted to cDNA for qPCR, assuming 100% reverse transcription efficiency. NanoString gives the advantage of providing a direct measurement of abundance rather than fluorescence-based values, although that was not exploited in this analysis. OpenArray provides results using a “gold-standard” technology, while removing most of the user noise inherent to standard qPCR. The ability to examine a specific set of genes on a wide range of samples, using only minimal sample and reagents and having a relatively short turnaround time for results with reduced man-hours per sample, makes both of these methods suitable for use in medium-throughput applications such as candidate gene validation and for use as clinical tools.
MATERIALS AND METHODS
Animal handling and treatment
The experimental design of this study is outlined in Figure 1. A total of 165 male rats of the Long-Evans (Turku/AB) and Han/Wistar (Kuopio) strains were used, henceforth designated L-E and H/W, respectively. All animal study plans were approved by the Animal Experiment Committee of the University of Kuopio and the Provincial Government of Eastern Finland. Rats were housed individually in suspended, stainless steel, wire-mesh cages with feed (R36, Ewos, Södertälje, Sweden) and water freely available. The animal room was maintained at 21.5°C ± 1°C with 55% ± 10% humidity and a 12-h light/dark cycle (using artificial lighting). Animals were divided into control and treatment groups such that the mean body weight across groups was similar. The control group consisted of 51 animals, while the TCDD-treated group consisted of 114 animals further divided into various subtreatment groups by treatment dose and time. The control group was given corn-oil vehicle (4 mL/kg by gavage) and the treated group was given TCDD in vehicle at 11–15 wk of age (again by gavage). Rats given only corn-oil vehicle were divided into groups and euthanized at multiple time points post-administration. Animals in the time-course group were treated with 100 μg/kg TCDD and euthanized at specified time points (from 1.5 h to 16 d post-administration). Animals in the dose–response group were treated with doses varying from 0.001 μg/kg to 3000 μg/kg and euthanized 19 h later. The TCDD doses, time points, and number of animals in each group are displayed in Figure 1, B and C, and each individual sample treatment is available in Supplemental Table 4. The animals were euthanized by decapitation. All animal handling and reporting comply with the ARRIVE guidelines (Kilkenny et al. 2010).
RNA extraction
The liver of each animal was excised, sliced, and snap-frozen in liquid nitrogen post-euthanasia. Frozen tissues were shipped to the analytical laboratory on dry ice and stored in the vapor phase of liquid nitrogen. Tissues were ground to a fine powder using a liquid-nitrogen-cooled mortar and pestle (∼30 mg of tissue per extraction). The frozen powder was transferred into a 14-mL tube (Sarstedt) containing 600 μL of RLT buffer supplemented with 10 μL of Antifoam A (Sigma-Aldrich) and rapidly homogenized using a Brinkmann Polytron homogenizer (Polytron PT1600E with a PT-DA 1607 generator) for 30 sec or until the powder was thoroughly disrupted. RNA was extracted using QIAGEN RNeasy Mini kits following the manufacturer's instructions (QIAGEN). The total RNA quantity was determined by NanoDrop UV spectrophotometry (Thermo Scientific), and RNA quality was verified using the Agilent 2100 Bioanalyzer with RNA 6000 Nano Kits (Agilent Technologies). Protein contamination was assessed using the 260/280 absorbance ratio as determined by NanoDrop. NanoDrop and Bioanalyzer results are available in Supplemental Table 4. At this point, RNA treatment varied depending on the requirements for each platform being compared (Fig. 1A).
Quantitative PCR
RNA was reverse-transcribed using High Capacity cDNA Reverse Transcription Kits (Applied Biosystems) following the manufacturer's instructions. Briefly, a reverse-transcription master mix was prepared using random primers and MultiScribe Reverse Transcriptase, 10 μL of which was added to 1 ng of RNA for a 20-μL reaction. Reverse transcription was performed (thermal cycler set to run for 10 min at 25°C, for 2 h at 37°C, and for 5 min at 85°C followed by a rapid cooling to 4°C) to synthesize cDNA. Assuming a 100% reaction efficiency, cDNA was diluted to a concentration of 5 ng/μL in RNase-free H2O and stored at −20°C. The gene set for evaluation consists of genes previously determined to be significantly altered by TCDD in both mice and rats through microarray analysis (Boutros et al. 2008). Primer and probe sets for use in qPCR were designed using the Real-Time PCR Assay Design Tool (http://www.idtdna.com/Scitools/Applications/RealTimePCR; Integrated DNA Technologies). Primer and probe sequences were analyzed using the nucleotide Basic Local Alignment Search Tool (Altschul et al. 1990) on the Rattus norvegicus nr/nt database (June 2010) to confirm gene specificity. Primer and probe sequences for qPCR are provided in Supplemental Table 5. Assay efficiencies were assessed both before and upon completion of the study and were determined to be satisfactory (Supplemental Table 5). The PCR reactions were set up in 384-well plates using the above primer/probe sets with 5 ng of cDNA per reaction with TaqMan Gene Expression Master Mix (Applied Biosystems) in 10-μL reactions. Each reaction contained 5 pmol of each primer and 2.5 pmol of probe. qPCR was performed using the 7900HT Fast Real-Time PCR System (Applied Biosystems). Reactions were run using the ΔΔCT standard 384-well PCR plate settings; an initial 2-min hold at 50°C was performed to ensure that any UTP-containing contaminants from previous PCR reactions were fully digested by the AmpErase UNG nuclease. Polymerase was activated by a 10-min hold at 95°C, and reactions were carried out by 40 cycles of 15 sec at 95°C and 1 min at 60°C. Samples from every animal were analyzed using each gene assay in duplicate. The relative quantification was determined using the comparative Cq method. The qPCR results were collected using Sequence Detection System Software (v2.3), and Cq values were determined using RQ Manager software (Applied Biosystems). All qPCR processes and reporting comply with MIQE guidelines (Bustin et al. 2009).
The unprocessed Cq values were loaded into the R statistical environment (v2.12.2) to be processed. Data points flagged by the SDS software as NAW (“not amplified well”) were removed from the analysis. The normalized expression level (NEL) of a gene is the amount of measured expression of the gene in relation to the measured expression of reference genes. The NEL is typically calculated as 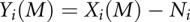 , where M refers to the experimental gene, Xi refers to each sample's raw expression data, Ni refers to the mean expression of the reference genes, and Yi to the sample's NEL (Barsyte-Lovejoy et al. 2006). For this study, the NEL was calculated as
  , a slight modification of the method described previously accounting for the fact that Cq values are already log-space (Barsyte-Lovejoy et al. 2006). The reference genes used in this study, Gapdh and Pgk1, had been previously demonstrated to be refractory to dioxin exposure under a wide range of conditions (Pohjanvirta et al. 2006).
NanoString
RNA was diluted to a concentration of 50 ng/μL, and an excess of 50 μL of each sample was loaded into one well of a 96-well plate and sent to the UHN Microarray Center (Toronto, ON) on dry ice for analysis. Only 100 ng (2 μL) of each sample was required for analysis using a NanoString nCounter. The desired mRNA targets were submitted in advance, and the required CodeSet (multiplexed color coded probe set containing both control and target probes) was designed and synthesized by NanoString before RNA analysis. Probe sequences were verified by BLAST analysis, searching the R. norvegicus nr/nt database (June 2010), to ensure that each identified a single gene. The probe IDs used are provided in Supplemental Table 6. Each sample was analyzed in a separate hybridization reaction.
The resulting data consisted of direct molecule counts present in the sample as determined by the number of bar-coded probes detected at the end of the process. These data were compiled in Microsoft Excel using NanoString's Raw Code Count Collector Tool for the initial data normalization to adjust for experimental variability according to the manufacturer's recommendations. The positive spike-in RNA control counts were summed for each lane, and the average across all lanes was taken to produce a normalization reference. A normalization factor was calculated for each lane using the sum of the positive spike-in RNA control counts divided by the normalization reference. The remaining experimental and control code counts were multiplied by this factor to account for hybridization efficiency (NanoString Technologies). Normalized data were then loaded into the R statistical environment (v2.12.2), and counts were further normalized to account for variation in the concentration of RNA in the initial sample following the manufacturer's data analysis guidelines. The geometric mean of the code counts for the reference genes Eef1a1, Gapdh, Hprt1, Ppia, and Sdha (Pohjanvirta et al. 2006) for each lane was calculated, and the average of these across all lanes was used as the normalization reference. A normalization factor was then calculated and applied as above. Normalized counts were log2-transformed.
There are various alternative methods currently described throughout the literature for the normalization of NanoString data. NanoStringNorm (v0.9.4) is an open source package for the R statistical environment that includes many of these normalization methods for each step of the process in an extensible framework (Waggott et al. 2012). Using this package, we analyzed our data by applying numerous combinations of normalization methods for each step (hybridization efficiency using the positive, spike-in control counts, background noise using the negative hybridization control counts, sample content using either reference gene counts or a subset of the total probe counts, as well as various other suggested methods including quantile and z-score normalizations). Analyses using a subset of these combinations are available in Supplemental Table 2.
To verify the generality of our analyses, we also analyzed data using the nSolver software developed by NanoString. nSolver allows for the use of a limited number of normalization methods using an interactive gui. As above, all available combinations of methods were assessed.
OpenArray
RNA was reverse-transcribed using High Capacity cDNA Reverse Transcription Kits (Applied Biosystems) following the manufacturer's instructions with a slight modification to the volumes used in order to produce the 2.5 ng/μL cDNA required for the OpenArray system. Samples were loaded into 96-well plates (25 μL total each) and sent to Life Technologies (Applied Biosystems) for analysis. Accession numbers for the genes analyzed by OpenArray are provided in Supplemental Table 7. OpenArray was performed in duplicate on each sample. OpenArray Real-Time PCR results from each run were merged and loaded into the R statistical environment (v2.12.2). Normalized expression levels for each experimental data point were calculated as above for qPCR using the reference genes Eef1a1, Gapdh, Hprt1, Pgk1, Ppia, and Sdha (Pohjanvirta et al. 2006).
Statistical analysis and data visualization
Data from each platform were analyzed first individually then comparatively in the R statistical environment (v2.12.2). Paired Student's t-tests were performed to compare platforms. t-test P-values and estimated differences in the fold changes are given in Table 3. The data from each platform were compared and visualized with the lattice (v0.19-23), latticeExtra (v0.6-15), and VennDiagram (v1.0.0) (Chen and Boutros 2011) R packages.
SUPPLEMENTAL MATERIAL
Supplemental material is available for this article.
COMPETING INTEREST STATEMENT
A.B.O. has served as a paid consultant to The Dow Chemical Company as a member of their Dioxin Scientific Advisory Board. Other authors declare that they have no conflicts of interest.
ACKNOWLEDGMENTS
This work was supported by the Canadian Institutes of Health Research (grant number MOP-57903 to A.B.O. and P.C.B.), the Academy of Finland (grant number 123345 to R.P.), and with the support of the Ontario Institute for Cancer Research to P.C.B. through funding provided by the Government of Ontario. We thank Arja Moilanen and Virpi Tiihonen for excellent technical assistance and support and all members of the Boutros laboratory for helpful discussions and advice.
Footnotes
Article published online ahead of print. Article and publication date are at http://www.rnajournal.org/cgi/doi/10.1261/rna.034710.112.
REFERENCES
- Altschul SF, Gish W, Miller W, Myers EW, Lipman DJ 1990. Basic local alignment search tool. J Mol Biol 215: 403–410 [DOI] [PubMed] [Google Scholar]
- Barsyte-Lovejoy D, Lau SK, Boutros PC, Khosravi F, Jurisica I, Andrulis IL, Tsao MS, Penn LZ 2006. The c-Myc oncogene directly induces the H19 noncoding RNA by allele-specific binding to potentiate tumorigenesis. Cancer Res 66: 5330–5337 [DOI] [PubMed] [Google Scholar]
- Bolstad BM, Irizarry RA, Astrand M, Speed TP 2003. A comparison of normalization methods for high density oligonucleotide array data based on variance and bias. Bioinformatics 19: 185–193 [DOI] [PubMed] [Google Scholar]
- Boutros PC, Yan R, Moffat ID, Pohjanvirta R, Okey AB 2008. Transcriptomic responses to 2,3,7,8-tetrachlorodibenzo-p-dioxin (TCDD) in liver: Comparison of rat and mouse. BMC Genomics 9: 419 doi: 10.1186/1471-2164-9-419 [DOI] [PMC free article] [PubMed] [Google Scholar]
- Boutros PC, Lau SK, Pintilie M, Liu N, Shepherd FA, Der SD, Tsao MS, Penn LZ, Jurisica I 2009. Prognostic gene signatures for non-small-cell lung cancer. Proc Natl Acad Sci 106: 2824–2828 [DOI] [PMC free article] [PubMed] [Google Scholar]
- Boutros PC, Yao CQ, Watson JD, Wu AH, Moffat ID, Prokopec SD, Smith AB, Okey AB, Pohjanvirta R 2011. Hepatic transcriptomic responses to TCDD in dioxin-sensitive and dioxin-resistant rats during the onset of toxicity. Toxicol Appl Pharmacol 251: 119–129 [DOI] [PubMed] [Google Scholar]
- Bustin SA, Benes V, Garson JA, Hellemans J, Huggett J, Kubista M, Mueller R, Nolan T, Pfaffl MW, Shipley GL, et al. 2009. The MIQE guidelines: minimum information for publication of quantitative real-time PCR experiments. Clin Chem 55: 611–622 [DOI] [PubMed] [Google Scholar]
- Chen H, Boutros PC 2011. VennDiagram: A package for the generation of highly-customizable Venn and Euler diagrams in R. BMC Bioinformatics 12: 35 doi: 10.1186/1471-2105-12-35 [DOI] [PMC free article] [PubMed] [Google Scholar]
- Chen T, Berno T, Zangari M 2012. Low-risk identification in multiple myeloma using a new 14-gene model. Eur J Haematol 89: 28–36 [DOI] [PubMed] [Google Scholar]
- Deb S, Bandiera SM 2010. Characterization of a new cytochrome P450 enzyme, CYP2S1, in rats: Its regulation by aryl hydrocarbon receptor agonists. Toxicology 267: 91–98 [DOI] [PubMed] [Google Scholar]
- Franc MA, Moffat ID, Boutros PC, Tuomisto JT, Tuomisto J, Pohjanvirta R, Okey AB 2008. Patterns of dioxin-altered mRNA expression in livers of dioxin-sensitive versus dioxin-resistant rats. Arch Toxicol 82: 809–830 [DOI] [PubMed] [Google Scholar]
- Geiss GK, Bumgarner RE, Birditt B, Dahl T, Dowidar N, Dunaway DL, Fell HP, Ferree S, George RD, Grogan T, et al. 2008. Direct multiplexed measurement of gene expression with color-coded probe pairs. Nat Biotechnol 26: 317–325 [DOI] [PubMed] [Google Scholar]
- Golub TR, Slonim DK, Tamayo P, Huard C, Gaasenbeek M, Mesirov JP, Coller H, Loh ML, Downing JR, Caligiuri MA, et al. 1999. Molecular classification of cancer: Class discovery and class prediction by gene expression monitoring. Science 286: 531–537 [DOI] [PubMed] [Google Scholar]
- Goodkind JR, Edwards JS 2005. Gene expression measurement technologies: Innovations and ethical considerations. Comput Chem Eng 29: 589–596 [Google Scholar]
- Hook SE, Skillman AD, Small JA, Schultz IR 2006. Gene expression patterns in rainbow trout, Oncorhynchus mykiss, exposed to a suite of model toxicants. Aquat Toxicol 77: 372–385 [DOI] [PMC free article] [PubMed] [Google Scholar]
- Irizarry RA, Bolstad BM, Collin F, Cope LM, Hobbs B, Speed TP 2003. Summaries of Affymetrix GeneChip probe level data. Nucleic Acids Res 31: e15 doi: 10.1093/nar/gng015 [DOI] [PMC free article] [PubMed] [Google Scholar]
- Kaneda H, Waddell TK, de Perrot M, Bai XH, Gutierrez C, Arenovich T, Chaparro C, Liu M, Keshavjee S 2006. Pre-implantation multiple cytokine mRNA expression analysis of donor lung grafts predicts survival after lung transplantation in humans. Am J Transplant 6: 544–551 [DOI] [PubMed] [Google Scholar]
- Kilkenny C, Browne WJ, Cuthill IC, Emerson M, Altman DG 2010. Improving bioscience research reporting: The ARRIVE guidelines for reporting animal research. J Pharmacol Pharmacother 1: 94–99 [DOI] [PMC free article] [PubMed] [Google Scholar]
- Kopec AK, Thompson CM, Kim S, Forgacs AL, Zacharewski TR 2012. Comparative toxicogenomic analysis of oral Cr(VI) exposure effects in rat and mouse small intestinal epithelia. Toxicol Appl Pharmacol 262: 124–138 [DOI] [PubMed] [Google Scholar]
- Korkalainen M, Tuomisto J, Pohjanvirta R 2004. Primary structure and inducibility by 2,3,7,8-tetrachlorodibenzo-p-dioxin (TCDD) of aryl hydrocarbon receptor repressor in a TCDD-sensitive and a TCDD-resistant rat strain. Biochem Biophys Res Commun 315: 123–131 [DOI] [PubMed] [Google Scholar]
- Kratz JR, He J, Van Den Eeden SK, Zhu ZH, Gao W, Pham PT, Mulvihill MS, Ziaei F, Zhang H, Su B, et al. 2012. A practical molecular assay to predict survival in resected non-squamous, non-small-cell lung cancer: Development and international validation studies. Lancet 379: 823–832 [DOI] [PMC free article] [PubMed] [Google Scholar]
- Lau SK, Boutros PC, Pintilie M, Blackhall FH, Zhu CQ, Strumpf D, Johnston MR, Darling G, Keshavjee S, Waddell TK, et al. 2007. Three-gene prognostic classifier for early-stage non small-cell lung cancer. J Clin Oncol 25: 5562–5569 [DOI] [PubMed] [Google Scholar]
- Lenehan PF, Boardman LA, Riegert-Johnson D, De Petris G, Fry DW, Ohrnberger J, Heyman ER, Gerard B, Almal AA, Worzel WP 2012. Generation and external validation of a tumor-derived 5-gene prognostic signature for recurrence of lymph node-negative, invasive colorectal carcinoma. Cancer 118: 5234–5244 [DOI] [PMC free article] [PubMed] [Google Scholar]
- Moffat ID, Boutros PC, Chen H, Okey AB, Pohjanvirta R 2010. Aryl hydrocarbon receptor (AHR)–regulated transcriptomic changes in rats sensitive or resistant to major dioxin toxicities. BMC Genomics 11: 263 doi: 10.1186/1471-2164-11-263 [DOI] [PMC free article] [PubMed] [Google Scholar]
- Okey AB 2007. An aryl hydrocarbon receptor odyssey to the shores of toxicology: The Deichmann Lecture, International Congress of Toxicology-XI. Toxicol Sci 98: 5–38 [DOI] [PubMed] [Google Scholar]
- Ovando BJ, Ellison CA, Vezina CM, Olson JR 2010. Toxicogenomic analysis of exposure to TCDD, PCB126 and PCB153: Identification of genomic biomarkers of exposure to AhR ligands. BMC Genomics 11: 583 doi: 10.1186/1471-2164-11-583 [DOI] [PMC free article] [PubMed] [Google Scholar]
- Palamanda JR, Kumari P, Murgolo N, Benbow L, Lin X, Nomeir AA 2009. Evaluation of CYP1A1 and CYP2B1/2 m-RNA induction in rat liver slices using the NanoString technology: A novel tool for drug discovery lead optimization. Drug Metab Lett 3: 171–175 [DOI] [PubMed] [Google Scholar]
- Pohjanvirta R 1990. TCDD resistance is inherited as an autosomal dominant trait in the rat. Toxicol Lett 50: 49–56 [DOI] [PubMed] [Google Scholar]
- Pohjanvirta R 2009. Transgenic mouse lines expressing rat AH receptor variants—a new animal model for research on AH receptor function and dioxin toxicity mechanisms. Toxicol Appl Pharmacol 236: 166–182 [DOI] [PubMed] [Google Scholar]
- Pohjanvirta R, Tuomisto J 1994. Short-term toxicity of 2,3,7,8-tetrachlorodibenzo-p-dioxin in laboratory animals: Effects, mechanisms, and animal models. Pharmacol Rev 46: 483–549 [PubMed] [Google Scholar]
- Pohjanvirta R, Niittynen M, Linden J, Boutros PC, Moffat ID, Okey AB 2006. Evaluation of various housekeeping genes for their applicability for normalization of mRNA expression in dioxin-treated rats. Chem Biol Interact 160: 134–149 [DOI] [PubMed] [Google Scholar]
- Sparano JA, Paik S 2008. Development of the 21-gene assay and its application in clinical practice and clinical trials. J Clin Oncol 26: 721–728 [DOI] [PubMed] [Google Scholar]
- Tijet N, Boutros PC, Moffat ID, Okey AB, Tuomisto J, Pohjanvirta R 2006. Aryl hydrocarbon receptor regulates distinct dioxin-dependent and dioxin-independent gene batteries. Mol Pharmacol 69: 140–153 [DOI] [PubMed] [Google Scholar]
- Uehara T, Minowa Y, Morikawa Y, Kondo C, Maruyama T, Kato I, Nakatsu N, Igarashi Y, Ono A, Hayashi H, et al. 2011. Prediction model of potential hepatocarcinogenicity of rat hepatocarcinogens using a large-scale toxicogenomics database. Toxicol Appl Pharmacol 255: 297–306 [DOI] [PubMed] [Google Scholar]
- Unkila M, Pohjanvirta R, MacDonald E, Tuomisto JT, Tuomisto J 1994. Dose response and time course of alterations in tryptophan metabolism by 2,3,7,8-tetrachlorodibenzo-p-dioxin (TCDD) in the most TCDD-susceptible and the most TCDD-resistant rat strain: Relationship with TCDD lethality. Toxicol Appl Pharmacol 128: 280–292 [DOI] [PubMed] [Google Scholar]
- van de Vijver MJ, He YD, van't Veer LJ, Dai H, Hart AA, Voskuil DW, Schreiber GJ, Peterse JL, Roberts C, Marton MJ, et al. 2002. A gene-expression signature as a predictor of survival in breast cancer. N Engl J Med 347: 1999–2009 [DOI] [PubMed] [Google Scholar]
- Van Hummelen P, Sasaki J 2010. State-of-the-art genomics approaches in toxicology. Mutat Res 705: 165–171 [DOI] [PubMed] [Google Scholar]
- Waggott D, Chu K, Yin S, Wouters BG, Liu FF, Boutros PC 2012. NanoStringNorm: An extensible R package for the pre-processing of NanoString mRNA and miRNA data. Bioinformatics 28: 1546–1548 [DOI] [PMC free article] [PubMed] [Google Scholar]
- Walker NJ, Portier CJ, Lax SF, Crofts FG, Li Y, Lucier GW, Sutter TR 1999. Characterization of the dose-response of CYP1B1, CYP1A1, and CYP1A2 in the liver of female Sprague-Dawley rats following chronic exposure to 2,3,7,8-tetrachlorodibenzo-p-dioxin. Toxicol Appl Pharmacol 154: 279–286 [DOI] [PubMed] [Google Scholar]
- Wang X, Roig-Villanova I, Khan S, Shanahan H, Quail PH, Martinez-Garcia JF, Devlin PF 2011. A novel high-throughput in vivo molecular screen for shade avoidance mutants identifies a novel phyA mutation. J Exp Bot 62: 2973–2987 [DOI] [PMC free article] [PubMed] [Google Scholar]
- Yao CQ, Prokopec SD, Watson JD, Pang R, P'ng C, Chong LC, Harding NJ, Pohjanvirta R, Okey AB, Boutros PC 2012. Inter-strain heterogeneity in rat hepatic transcriptomic responses to 2,3,7,8-tetrachlorodibenzo-p-dioxin (TCDD). Toxicol Appl Pharmacol 260: 135–145 [DOI] [PubMed] [Google Scholar]
- Zhang J, Day IN, Byrne CD 2002. A novel medium throughput quantitative competitive PCR technology to simultaneously measure mRNA levels from multiple genes. Nucleic Acids Res 30: e20 doi: 10.1093/nar/30.5.e20 [DOI] [PMC free article] [PubMed] [Google Scholar]