Abstract
Purpose
To investigate the hypothesis that four-dimensional (4D) transcatheter intra-arterial perfusion (TRIP) MRI can quantify immediate perfusion changes after radiofrequency (RF) ablation in rabbit VX2 liver tumors.
Materials and Methods
Nine New Zealand White rabbits were used to surgically implant VX2 liver tumors. During ultrasound-guided RF ablation, tumors received either a true or sham ablation. After selective catheterization of the left hepatic artery under X-ray fluoroscopy, we acquired pre and post-RF ablation 4D TRIP MR images using 3 mL of 2.5% intra-arterial gadopentetate dimeglumine. Two regions-of-interest were drawn upon each tumor to generate signal-intensity time curves. Area under the curve (AUC) was calculated to provide semi-quantitative perfusion measurements that were compared using a paired t test (α = 0.05). Ablated tissue was visually confirmed on pathology using Evans blue dye.
Results
Mean AUC perfusion of VX2 tumors for the true ablation group decreased by 92.0% (95% CI: 83.3%–100%), from 1913 (95% CI: 1557, 2269) before RF ablation to 76.6 (95% CI: 18.4, 134.8) after RF ablation (a.u., p < 0.001). Sham-ablated tumors demonstrated no significant perfusion changes.
Conclusion
4D TRIP MRI can quantify liver tumor perfusion reductions in VX2 rabbits after RF ablation. This MRI technique can potentially be used to improve tumor response assessment at the time of RF ablation.
Keywords: radiofrequency ablation, transcatheter intra-arterial perfusion MRI, VX2 rabbits, functional imaging biomarker, hepatocellular carcinoma
INTRODUCTION
Percutaneous radiofrequency (RF) ablation is one modality used to treat early-stage hepatocellular carcinoma (HCC) or metastatic disease in the liver in patients who are not candidates for surgical treatment (1–2). Of the thermal ablation techniques, RFA is the most widely used. Raising tissue temperatures to > 50°C by means of an alternating electric current conducted through one or more electrodes causes irreversible cell damage (3). As such, proper imaging guidance of RF ablation is necessary to target, monitor, and ensure complete tumor destruction without damaging vital adjacent structures. Ultrasound (US) is frequently used for real-time RF electrode navigation and placement, while treatment outcome is assessed afterward by standard multiphasic contrast-enhanced spiral computed tomography (CT) or magnetic resonance imaging (MRI) (2). Measuring the extent of actual ablated tissue volume and margins at the time of treatment, however, remains a challenge due to subjective interpretation of imaging information and inherent limitations of different imaging modalities. Because one of the mechanisms of ablation therapy is the disruption of tumor blood supply due to coagulation necrosis, a technique that could quantify tumor perfusion immediately at the time of RF ablation might be able to provide an indication of the true extent of the treatment zone.
Recent advancements in functional imaging permit physiologic measurements of biological activity, rather than morphologic assessment of tissue structure. Four-dimensional (4D) transcatheter intra-arterial perfusion (TRIP) MR imaging is one such technique that can measure local tissue perfusion based upon selective intra-arterial (IA) catheter-directed contrast-agent injections (4–5). This method of targeted imaging provides multiplanar perfusion information specifically distal to the catheter tip, as opposed to dynamic contrast-enhanced MRI that uses intravenous (IV) contrast agent to acquire perfusion information at discrete time points (i.e., arterial, venous, and equilibrium phases) for an entire anatomic region. Continuous iterative volumetric imaging over time (i.e., 4D data acquisition) of TRIP MRI incorporates the benefits of high spatial and temporal resolution with intra-procedural monitoring for objective perfusion quantification (4). The method has already been applied to hepatic tumors in pre-clinical (5–6) and clinical (4,7) settings immediately after locoregional embolotherapies.
In the context of RF ablation for HCC, 4D TRIP MRI could potentially be used for more consistent and accurate identification of hypervascular tumor borders and ablation margins. While this approach requires invasive catheterization and access to an MRI scanner, real-time objective evaluation of residual perfusion would permit prompt and complete re-treatment, possibly improving RF ablation outcomes for HCC patients in the long-term. To this end, the purpose of our study was to investigate the feasibility of 4D TRIP MRI to quantify perfusion changes immediately before and after RF ablation in the rabbit VX2 liver tumor model.
MATERIALS AND METHODS
Animal Model
Our Institutional Animal Care and Use Committee approved all experiments. Nine New Zealand White adult female rabbits (Covance, Denver, PA) weighing between 3.5 and 4.2 kg were used to establish VX2 liver tumors by surgically transplanting VX2 from 3 additional hind-limb tumor donor rabbits. We selected this liver tumor model because VX2 tumors are supplied by the hepatic artery and the caliber of the hepatic artery in rabbits is sufficient to permit catheterization in a manner that mimics current clinical interventional radiology vascular approaches (8).
Initial sedation and anesthesia for all rabbit surgeries, procedures, and imaging studies included intramuscular injections of 35 mg/kg ketamine hydrochloride (Ketaset; Fort Dodge Laboratories, Fort Dodge, IA) and 3–5 mg/kg xylazine hydrochloride (Xyla-Ject; Phoenix Pharmaceuticals, St Joseph, MO). For liver tumor implantation, rabbit anesthesia was maintained with 2–3.5% inhaled isoflurane (IsoFlo; Abbott Laboratories, North Chicago, IL) by face mask connected to an animal ventilator (Harvard Apparatus, Holliston, MA).
The VX2 liver tumor model was induced in rabbits as previously described (9). Briefly, VX2 was incubated in and harvested from the hind limbs of tumor donor rabbits, minced into 2-mm-diameter fragments, and directly implanted into the anterior left lobe of the liver of another rabbit by means of a subxiphoid mini-laparotomy. At least 2 tumors were implanted into the left lobe of each rabbit at the time of surgery.
X-ray digital subtraction angiography (DSA)
Interventional radiologists with Certificate of Added Qualification performed all X-ray DSA-guided hepatic artery catheterizations using a C-arm unit (Powermobil; Siemens Medical Solutions, Erlangen, Germany). Femoral artery access was obtained using a surgical cut-down, followed by an introducer needle exchanged with a 3-F introducer sheath (Check-Flo; Cook, Bloomington, IN) over a coaxial 0.014-inch diameter guidewire (Prowater; Abbott Laboratories, Redwood City, CA). A custom 2-F catheter (JB-1; Cook, Bloomington, IN) was used to selectively interrogate the celiac trunk and advance into the left hepatic artery under X-ray fluoroscopy. DSA was obtained with iodinated contrast agent (iohexol; Omnipaque 350; Amersham, Princeton, NJ). After superselective catheter placement, the rabbit was transferred to an adjacent MRI scanner to perform 4D TRIP MRI.
MRI
A 1.5-Tesla clinical MRI scanner (Magnetom Espree; Siemens AG Healthcare Sector, Erlangen, Germany) was used to obtain images immediately before and after RF ablation with a 4-channel receiver-only clinical head coil and 2-channel receiver-only clinical neck coil.
Rabbit liver and VX2 tumor anatomy were initially depicted using a 2D turbo spin-echo (TSE) T2-weighted (T2W) sequence with the following parameters: TR/TE = 5020/84 ms, bandwidth (BW) = 205 Hz/pixel, flip angle (FA) = 90°, 192 × 108 matrix, 5 mm slice thickness, 8 slices, 200 × 112.5 mm2 FOV. 4D TRIP MRI scans co-registered to T2W images of an 8-partition liver volume were continuously acquired every 1.6 seconds for 96 seconds using a 3D gradient echo (GRE) sequence: TR/TE = 6/1.62 ms, BW = 660 Hz/pixel, FA = 15°, 128 × 72 × 8 matrix, 50% slice over-sampling, 200 × 112.5 × 40 mm3 FOV. Sixteen seconds after initiating this 3D GRE scan, a manual IA injection of 3 mL of 2.5% gadopentetate dimeglumine (Gd-DTPA) (Magnevist; Berlex, Wayne, NJ) was delivered over a time period of 6 seconds.
RF Ablation Protocol
After baseline 4D TRIP MR imaging, rabbits were removed from the scanner to undergo RF ablation. All rabbits with multiple VX2 liver tumors received a true ablation in one tumor and “sham ablations” for controlled comparison in the remaining tumors. A sham ablation consisted of RF electrode insertion into the center of the tumor without the application of heat to determine whether the act of inserting the needle probe itself affected perfusion measurements.
An US unit (Acuson Sequoia; Siemens Medical, Erlangen, Germany) with a 6-MHz linear transducer was used to guide RF electrode placement within the liver tumors. VX2 tumor ablations were achieved using a single monopolar 17-gauge RF electrode (Cool-tip; Valleylab, Covidien, Mansfield, MA) with an active tip of 2 or 3 cm. The first 2 animals received 3cm tip applicators; the remaining 7 animals received 2cm applicators. These sizes were selected based upon availability from clinical overstock supplies rather than upon individual tumor sizes. The electrode was internally cooled with chilled saline circulated by a peristaltic pump. The RF system comprised of a 200-watt power generator supplying pulsed energy automatically adjusted based upon tissue impedance during a full 12-minute ablation session. After RF ablation was complete, rabbits were moved back to the MR scanner for post-treatment 4D TRIP MRI.
Necropsy and pathology
Immediately after collecting the last set of MR images, the IA catheter was gently removed, and in a subset of 3 rabbits 2 mg/kg of 2% Evans blue dye IV was administered to qualitatively demonstrate areas of intact versus disrupted perfusion on pathology (10). Half an hour later, rabbits were sacrificed using 150 mg/kg Euthasol (Delmarva Laboratories, Midlothian, VA) IV injection while still under deep anesthesia. Experienced animal health technicians performed necropsy and liver organ harvest.
MRI and Data Analysis
Post-processing of MR images was performed offline with MATLAB software (Mathworks, Natick, MA) and public domain software (ImageJ version 1.43; National Institutes of Health, Bethesda, MD). Statistical analysis was completed using Origin software version 7.0 (OriginLab, Northhampton, MA).
Using the anatomic T2W images as a reference, 2 separate regions of interest (ROI) were drawn around the peripheral portion of each tumor on both the pre-RF ablation and corresponding post-RF ablation TRIP MR axial images. VX2 tumor borders were visually identified by their characteristic hypervascular rims, and care was taken to exclude tumor necrotic core (6).
Within each voxel of each ROI of each tumor, a signal-intensity (SI) time curve was generated before and after RF ablation. From these SI time curves, the area under the curve (AUC) was calculated to provide a semi-quantitative perfusion value (4). The AUC value of each voxel was then assigned a color value to generate a semi-quantitative color perfusion map.
We separately calculated the mean pre and post-ablation AUC and 95% confidence interval (CI) for all treated tumors and all control tumors receiving a sham ablation. A 2-tailed paired t test was used to compare pre-RF ablation to post-RF ablation mean AUC values (α = 0.05). Perfusion change was reported as the percent change in mean AUC value.
RESULTS
Rabbit VX2 Liver Tumor Model
We successfully grew a total of 20 VX2 liver tumors in 9 rabbits. A total of 21 ± 4 days (mean ± standard deviation) elapsed from time of tumor implantation to RF ablation. The true ablation group consisted of 12 tumors that measured 1.51 ± 0.44 cm in longest diameter. The sham ablation group had 8 tumors that measured 1.60 ± 0.48 cm in longest diameter.
A representative X-ray fluoroscopic image of a VX2 liver tumor prior to a single treatment session is shown in Figure 1. A single US image from real-time monitored RF ablation of a rabbit VX2 liver tumor is depicted in Figure 2.
Figure 1.
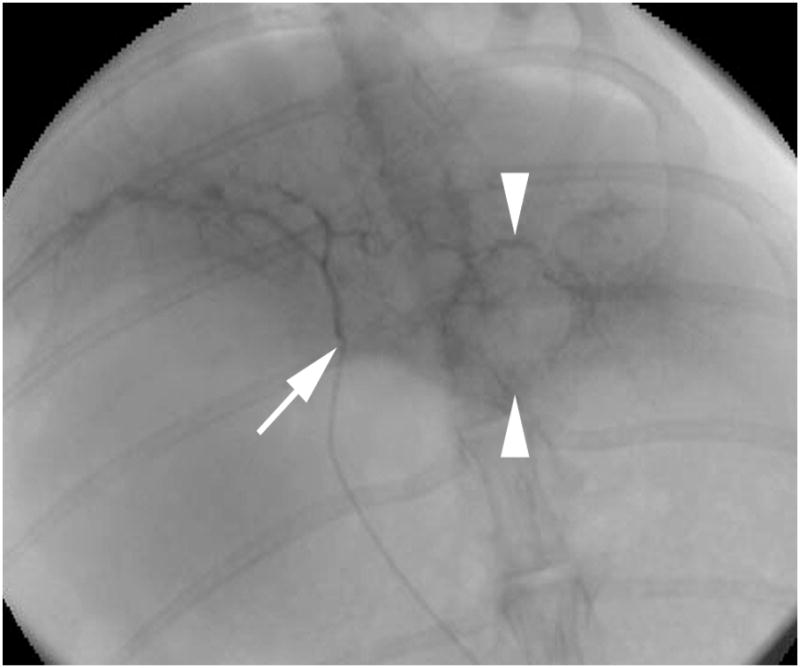
X-ray fluoroscopic image with iodinated contrast-agent injection shows the catheter tip (arrow) within the left hepatic artery and VX2 tumor blush (arrowheads).
Figure 2.
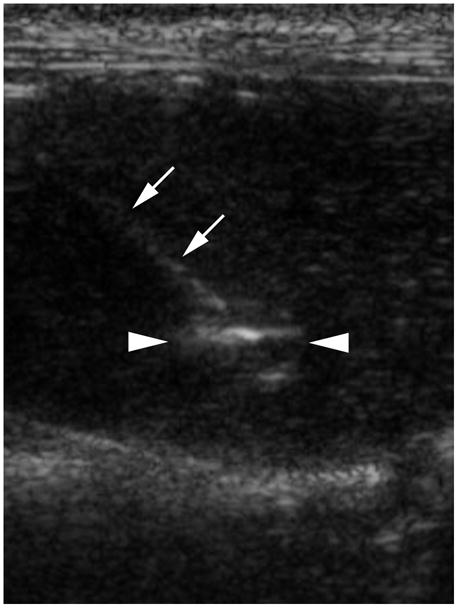
Sonographic image of an RF needle probe (arrows) inserted into a VX2 tumor (arrowheads). Incipient formation of hyperechoic gas near the center of the tumor appears bright.
Pathology
Gross inspection of the tissue specimens revealed VX2 tumors located within the left lobe of the liver. Tumors were well circumscribed and gray-white in color. Cross-sections of tumor showed focal areas of punctate hemorrhage and a surrounding zone of pale brown liver tissue due to the thermal ablation. A representative liver tissue specimen with 2 tumors from a rabbit that received Evans blue dye prior to sacrifice is shown in Figure 3. The majority of the liver except for the ablated region was stained blue, which qualitatively confirmed the lack of perfusion to the treatment zone.
Figure 3.
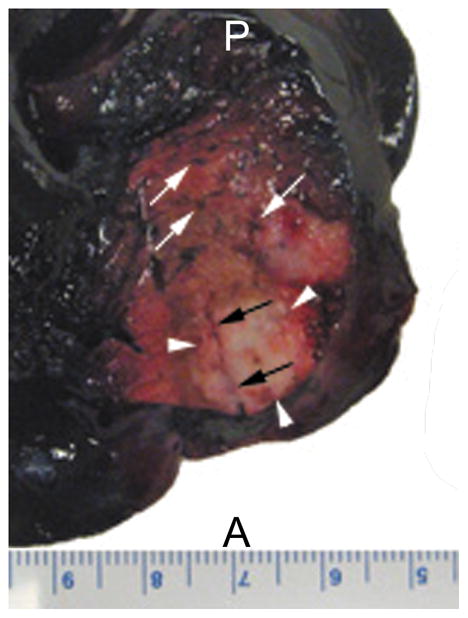
Dorsal view of the left lobe of a liver specimen with VX2 tumors from a rabbit that received IV Evans blue dye after RF ablation. Dark blue color of the liver parenchyma indicates regions of intact perfusion. Red and brown colored zones surrounding the ablated tumor (arrowheads) indicate regions of disrupted perfusion. Some microvessels (white arrows) remained patent. Part of the RF probe tract (black arrows) can be visualized here as well. A, anterior; P, posterior.
Intra-procedural change in AUC value as a semi-quantitative measure of perfusion
Tumors were identified on the anatomic T2W axial images as well-defined heterogeneous areas of increased signal intensity compared to surrounding liver parenchyma. Figure 4 shows representative T2W images and their corresponding colored perfusion maps obtained immediately before and after RF ablation in a single rabbit. Pre-RF ablation perfusion map depicts the hypervascular rims characteristic of VX2 tumors. Colored perfusion map after RF ablation clearly indicates a region of completely disrupted perfusion with well-demarcated borders corresponding with the tumor ablation zone.
Figure 4.
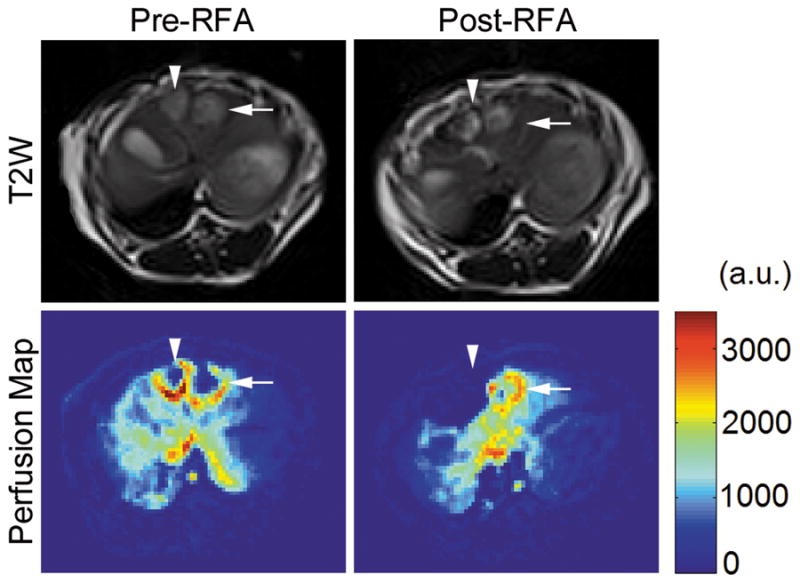
T2-weighted anatomic MR images and their corresponding colored perfusion maps from a single rabbit before and after RF ablation. The arrowheads designate the tumor receiving a true ablation, whereas the arrows designate the tumor receiving a sham ablation. On the colored perfusion maps, red indicates areas of relatively high perfusion, and blue indicates areas of relatively low perfusion. Note the clear absence of perfusion in the treated tumor post-RF ablation.
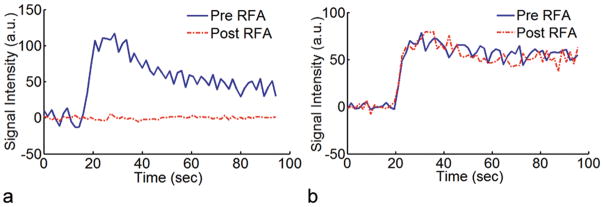
Two representative signal-intensity time curves from rabbits in the treated and control groups are shown in Figure 5. Tumors of rabbits that underwent a true ablation had a significant reduction in perfusion evidenced by a decrease in amplitude and flattening of the post-RF ablation curve. The pre- and post-RF ablation curves for tumors that received a sham ablation essentially appeared unchanged in shape and amplitude, illustrating that RF probe insertion itself did not significantly affect tumor perfusion.
Figure 5.
Representative signal-intensity time curves from rabbits with VX2 liver tumors that received either (a) a true ablation or (b) a sham ablation. Ablated tumors demonstrated a statistically significant reduction in perfusion (p < 0.001).
The semi-quantitative perfusion parameter (i.e., mean AUC) representing all 12 treated tumors decreased significantly from 1913 (95% CI: 1557, 2269) before RF ablation to 76.6 (95% CI: 18.4, 134.8) after RF ablation (a.u., p < 0.001) for an overall perfusion reduction of 92.0% (95% CI: 83.3%–100%). Change in mean AUC for the 8 tumors in the sham ablation group was not statistically significant: 1671 (95% CI: 1302, 2040) before RF electrode placement to 1609 (95% CI: 1320, 1898) after RF probe insertion (a.u., p = 0.780). There was no significant difference in AUC perfusion values (p = 0.347) between the treated and untreated tumors at baseline prior to the true or sham ablation procedures, respectively. Raw perfusion data for each tumor is provided in the Table.
Table.
Raw rabbit data regarding tumor size, treatment type, and perfusion measurements before and after treatment. Each tumor was measured at two separate ROI.
| Rabbit | Tumor Size (cm) | ROI | Treatment (Tx) | Pre-Tx AUC(A.U.) | Post-Tx AUC(A.U.) | %Reduction |
|---|---|---|---|---|---|---|
| 350308 | 1.6 | 1 | RF Ablation | 1434 | 26 | 98% |
| 2 | RF Ablation | 1636 | 38 | 98% | ||
| 350308 | 1.1 | 1 | Sham | 1583 | 1458 | 8% |
| 2 | Sham | 1725 | 1950 | −13% | ||
| 350309 | 1.2 | 1 | RF Ablation | 3018 | 20 | 99% |
| 2 | RF Ablation | 2708 | 55 | 98% | ||
| 350309 | 0.8 | 1 | RF Ablation | 2942 | 55 | 98% |
| 2 | RF Ablation | 1808 | 68 | 96% | ||
| 324746 | 1.2 | 1 | RF Ablation | 902 | 17 | 98% |
| 2 | RF Ablation | 815 | 19 | 98% | ||
| 324746 | 1.3 | 1 | RF Ablation | 855 | 17 | 98% |
| 2 | RF Ablation | 612 | 23 | 96% | ||
| 321976 | 2.0 | 1 | RF Ablation | 1845 | 3 | 99% |
| 2 | RF Ablation | 2284 | 55 | 98% | ||
| 321976 | 1.9 | 1 | Sham | 2279 | 2515 | −10% |
| 2 | Sham | 3047 | 2023 | 34% | ||
| 321974 | 1.3 | 1 | RF Ablation | 1642 | 35 | 98% |
| 2 | RF Ablation | 1613 | 36 | 98% | ||
| 321974 | 1.7 | 1 | Sham | 1746 | 1765 | −1% |
| 2 | Sham | 2359 | 1396 | 41% | ||
| 321974 | 1.5 | 1 | Sham | 2164 | 2231 | −3% |
| 2 | Sham | 1891 | 1352 | 28% | ||
| 309493 | 1.3 | 1 | RF Ablation | 621 | 433 | 30% |
| 2 | RF Ablation | 725 | 574 | 21% | ||
| 309493 | 1.0 | 1 | Sham | 676 | 556 | 18% |
| 2 | Sham | 695 | 888 | −28% | ||
| 309493 | 1.4 | 1 | Sham | 852 | 1326 | −56% |
| 2 | Sham | 608 | 1511 | −149% | ||
| 299597 | 1.7 | 1 | RF Ablation | 3144 | 21 | 99% |
| 2 | RF Ablation | 2423 | 98 | 96% | ||
| 299597 | 2.5 | 1 | Sham | 1455 | 1169 | 20% |
| 2 | Sham | 1544 | 1225 | 21% | ||
| 290490 | 1.6 | 1 | RF Ablation | 2309 | 10 | 99% |
| 2 | RF Ablation | 3320 | 16 | 99% | ||
| 290490 | 1.6 | 1 | RF Ablation | 1976 | 7 | 99% |
| 2 | RF Ablation | 2374 | 22 | 99% |
DISCUSSION
This pilot study in 9 rabbits verified the ability of 4D TRIP MRI to provide objective intra-procedural feedback information about liver tumor perfusion status at the time of RF ablation. Mean tumor perfusion was successfully quantified by AUC and was significantly reduced within the ablated tumor group. High-quality image resolution of MRI integrated with selective IA Gd-DTPA delivery permits distinct evaluation of ablation zone margins and could potentially be used to identify residual viable tumor based upon areas of persistent perfusion. If necessary, a second overlapping ablation could be performed immediately after MR imaging, thus eliminating the need for a second visit by the patient, with the potential of subsequently improving treatment outcomes.
Success of percutaneous RF thermal ablation depends upon the ability to ablate all viable tumor tissue, including an adequate tumor-free margin to eradicate potential microscopic invasion. Complete treatment relies upon imaging technology to achieve this therapeutic goal. US, CT, and conventional MR imaging are routinely used for tumor targeting, but remain limited in their assessment of treatment adequacy. US is often restricted by the formation of gas bubbles within the ablated area, resulting in an irregular hyperechoic zone that visually obscures the targeted region and only provides a rough estimate of actual ablated tissue (11). Some evidence suggests that contrast-enhanced ultrasound might help to distinguish residual tumor, but at times yields uncertain results, specifically with small (< 2cm) lesions (12). Sonographic microbubble contrast agent also precludes immediate post-treatment evaluation (13) and is currently not approved for clinical use in the United States.
CT and MRI can be performed at the time of RF ablation, but often show a hypervascular rim surrounding the ablation zone that could be confused for residual tumor (13,14); enhancement itself is a purely subjective finding and difficult to quantitate. CT and MRI are more commonly performed at 1 and 3 months following the procedure, but would delay opportunity for earlier re-treatment. Recent attempts to improve upon HCC response assessment recognize the need to monitor, quantify, and predict extent of tumor necrosis more accurately, for example, by using MR thermometry to map RF energy deposition throughout the ablation zone (14–15). While these needs should be applicable to other hypervascular metastases within the liver, they would be expected to have less utility in the setting of hypovascular metastases. MR thermometry has also been used to monitor high frequency ultrasound ablations of the liver (16), and can be helpful to determine excessive near field heating (17).
4D TRIP MRI is a perfusion monitoring technique that could potentially increase accuracy of in vivo tumor response evaluation at the time of RF ablation. Because contrast-agent is delivered by the IA route, less Gd-DTPA is required (< 0.01 mmol/kg) than standard contrast-enhanced MRI, resulting in faster washout times, reduced MR signal saturation, shorter time interval between multiple imaging measurements (i.e., intra-procedural monitoring capability), and increased conspicuity of HCC lesions (18), thus overcoming several of the aforementioned restrictions of traditional imaging approaches. MRI provides excellent characterization of soft tissues, and accuracy of HCC response assessment could benefit from objective perfusion measurements that theoretically would be more consistent, reproducible, and precise than subjective information. Moreover, the current practice of using enhancement alone as a qualitative marker of microvessel density may not be completely representative of the extent of residual tumor because enhancement also depends upon the presence of vascular permeability (19). Eventually, a certain magnitude of perfusion change might serve as an individualized reference point to gauge tumor response or predict treatment outcome.
There were several limitations to this study. First, only short-term tissue-perfusion data were available because this preliminary study was designed to be a terminal study. The perfusion reduction could have been due to transient vascular changes, such as reactive vasospasm, or due to permanent tissue destruction by RF ablation. Future experiments could be performed where 4D TRIP MRI is repeated several days following the ablation to elucidate the duration of these perfusion changes. Nonetheless, our results still demonstrate the feasibility of 4D TRIP MRI to quantify tumor perfusion status immediately after RF ablation. Second, adjustments in MR protocol regarding contrast-agent concentration, injection rate, and frequency of measurements would affect perfusion values. Third, Evans blue dye was used only in a subset of animals and thus quantitative correlation of pathological changes with TRIP-MRI measurements was not possible. Fourth, the generalizability of this TRIP-MRI approach is limited by the need for invasive catheter placement, availability of interventional MRI scanners, and the requirement to transfer patients between DSA and MRI procedure suites, should RF ablation not be performed within the MRI scanner. Finally, longitudinal studies must be performed to determine whether a correlation exists between absence of perfusion detected by 4D TRIP MRI and actual tumor necrosis. Such investigation requires IACUC approval for survival procedures, which was not available to us for this study. If so, 4D TRIP MRI would be a powerful tool to assist in RF ablation.
In conclusion, we found that 4D TRIP MRI can clearly depict and quantify the extent of VX2 liver tumor perfusion changes in rabbits at the time of RF ablation. Investigating the utility of this imaging-monitoring method in patients with primary or metastatic liver cancer treated with RF ablation may provide a more accurate, immediate, and reliable means of evaluating functional tumor response. This type of imaging feedback (20) may ultimately help interventional oncologists improve patient outcomes.
Acknowledgments
Contract grant sponsor: National Institutes of Health NCI; Contract grant numbers: R01 CA134719and R01 CA126809.
References
- 1.Bruix J, Sherman M. Management of hepatocellular carcinoma. Hepatology. 2005;42:1208–1236. doi: 10.1002/hep.20933. [DOI] [PubMed] [Google Scholar]
- 2.Bruix J, Sherman M, Llovet JM, et al. Clinical management of hepatocellular carcinoma. Conclusions of the Barcelona-2000 EASL conference. European Association for the Study of the Liver. J Hepatol. 2001;35:421–430. doi: 10.1016/s0168-8278(01)00130-1. [DOI] [PubMed] [Google Scholar]
- 3.Goldberg SN, Gazelle GS, Halpern EF, Rittman WJ, Mueller PR, Rosenthal DI. Radiofrequency tissue ablation: importance of local temperature along the electrode tip exposure in determining lesion shape and size. Acad Radiol. 1996;3:212–218. doi: 10.1016/s1076-6332(96)80443-0. [DOI] [PubMed] [Google Scholar]
- 4.Gaba RC, Wang D, Lewandowski RJ, et al. Four-dimensional transcatheter intraarterial perfusion MR imaging for monitoring chemoembolization of hepatocellular carcinoma: preliminary results. J Vasc Interv Radiol. 2008;19:1589–1595. doi: 10.1016/j.jvir.2008.08.010. [DOI] [PMC free article] [PubMed] [Google Scholar]
- 5.Wang D, Virmani S, Tang R, et al. Four-dimensional transcatheter intraarterial perfusion (TRIP)-MRI for monitoring liver tumor embolization in VX2 rabbits. Magn Reson Med. 2008;60:970–975. doi: 10.1002/mrm.21678. [DOI] [PMC free article] [PubMed] [Google Scholar]
- 6.Wang D, Bangash AK, Rhee TK, et al. Liver tumors: monitoring embolization in rabbits with VX2 tumors--transcatheter intraarterial first-pass perfusion MR imaging. Radiology. 2007;245:130–139. doi: 10.1148/radiol.2451061689. [DOI] [PubMed] [Google Scholar]
- 7.Larson AC, Wang D, Atassi B, et al. Transcatheter intraarterial perfusion: MR monitoring of chemoembolization for hepatocellular carcinoma--feasibility of initial clinical translation. Radiology. 2008;246:964–971. doi: 10.1148/radiol.2463070725. [DOI] [PubMed] [Google Scholar]
- 8.Miller DL, O’Leary TJ, Girton M. Distribution of iodized oil within the liver after hepatic arterial injection. Radiology. 1987;162:849–852. doi: 10.1148/radiology.162.3.3027747. [DOI] [PubMed] [Google Scholar]
- 9.Virmani S, Harris KR, Szolc-Kowalska B, et al. Comparison of two different methods for inoculating VX2 tumors in rabbit livers and hind limbs. J Vasc Interv Radiol. 2008;19:931–936. doi: 10.1016/j.jvir.2008.02.019. [DOI] [PMC free article] [PubMed] [Google Scholar]
- 10.Goldberg SN, Ahmed M, Gazelle GS, et al. Radio-frequency thermal ablation with NaCl solution injection: effect of electrical conductivity on tissue heating and coagulation-phantom and porcine liver study. Radiology. 2001;219:157–165. doi: 10.1148/radiology.219.1.r01ap27157. [DOI] [PubMed] [Google Scholar]
- 11.Leyendecker JR, Dodd GD, 3rd, Halff GA, et al. Sonographically observed echogenic response during intraoperative radiofrequency ablation of cirrhotic livers: pathologic correlation. AJR Am J Roentgenol. 2002;178:1147–1151. doi: 10.2214/ajr.178.5.1781147. [DOI] [PubMed] [Google Scholar]
- 12.Solbiati L, Ierace T, Tonolini M, Cova L. Guidance and monitoring of radiofrequency liver tumor ablation with contrast-enhanced ultrasound. Eur J Radiol. 2004;51 (Suppl):S19–23. doi: 10.1016/j.ejrad.2004.03.035. [DOI] [PubMed] [Google Scholar]
- 13.Choi D, Lim HK, Kim SH, et al. Hepatocellular carcinoma treated with percutaneous radio-frequency ablation: usefulness of power Doppler US with a microbubble contrast agent in evaluating therapeutic response-preliminary results. Radiology. 2000;217:558–563. doi: 10.1148/radiology.217.2.r00oc07558. [DOI] [PubMed] [Google Scholar]
- 14.Clasen S, Pereira PL. Magnetic resonance guidance for radiofrequency ablation of liver tumors. J Magn Reson Imaging. 2008;27:421–433. doi: 10.1002/jmri.21264. [DOI] [PubMed] [Google Scholar]
- 15.Rempp H, Clasen S, Boss A, et al. Prediction of cell necrosis with sequential temperature mapping after radiofrequency ablation. J Magn Reson Imaging. 2009;30:631–639. doi: 10.1002/jmri.21863. [DOI] [PubMed] [Google Scholar]
- 16.Holbrook AB, Santos JM, Kaye E, Rieke V, Paul KB. Real-time MR thermometry for monitoring HIFU ablations of the liver. Magn Reson Med. 2010;63:365–373. doi: 10.1002/mrm.22206. [DOI] [PMC free article] [PubMed] [Google Scholar]
- 17.Mougenot C, Kohler MO, Enholm J, Quesson B, Moonen C. Quantification of near-field heating during volumetric MR-HIFU ablation. Med Phys. 2011;38:272–282. doi: 10.1118/1.3518083. [DOI] [PubMed] [Google Scholar]
- 18.Larson AC, Rhee TK, Deng J, et al. Comparison between intravenous and intraarterial contrast injections for dynamic 3D MRI of liver tumors in the VX2 rabbit model. J Magn Reson Imaging. 2006;24:242–247. doi: 10.1002/jmri.20623. [DOI] [PubMed] [Google Scholar]
- 19.Sato KT, Omary RA, Takehana C, et al. The role of tumor vascularity in predicting survival after yttrium-90 radioembolization for liver metastases. J Vasc Interv Radiol. 2009;20:1564–1569. doi: 10.1016/j.jvir.2009.08.013. [DOI] [PubMed] [Google Scholar]
- 20.Solomon SB, Silverman SG. Imaging in interventional oncology. Radiology. 2010;257:624–640. doi: 10.1148/radiol.10081490. [DOI] [PubMed] [Google Scholar]


