Background: Fatty acid synthase (FASN) is a key lipogenic enzyme regulated by various factors, including estrogens.
Results: GPER mediates FASN expression and activity induced by estrogens in cancer cells.
Conclusion: Fatty acid biogenesis is regulated by estrogens through GPER.
Significance: GPER may be included among the transduction mediators involved by estrogens in regulating FASN expression and activity.
Keywords: Breast Cancer, Estrogen, Estrogen Receptor, Fatty Acid Synthase, Signal Transduction, FASN, GPER, Cancer Cells, Cancer-associated Fibroblasts, Estrogens
Abstract
Activation of lipid metabolism is an early event in carcinogenesis and a central hallmark of many tumors. Fatty acid synthase (FASN) is a key lipogenic enzyme catalyzing the terminal steps in the de novo biogenesis of fatty acids. In cancer cells, FASN may act as a metabolic oncogene, given that it confers growth and survival advantages to these cells, whereas its inhibition effectively and selectively kills tumor cells. Hormones such as estrogens and growth factors contribute to the transcriptional regulation of FASN expression also through the activation of downstream signaling and a cross-talk among diverse transduction pathways. In this study, we demonstrate for the first time that 17β-estradiol (E2) and the selective GPER ligand G-1 regulate FASN expression and activity through the GPER-mediated signaling, which involved the EGF receptor/ERK/c-Fos/AP1 transduction pathway, as ascertained by using specific pharmacological inhibitors, performing gene-silencing experiments and ChIP assays in breast SkBr3, colorectal LoVo, hepatocarcinoma HepG2 cancer cells, and breast cancer-associated fibroblasts. In addition, the proliferative effects induced by E2 and G-1 in these cells involved FASN as the inhibitor of its activity, named cerulenin, abolished the growth response to both ligands. Our data suggest that GPER may be included among the transduction mediators involved by estrogens in regulating FASN expression and activity in cancer cells and cancer-associated fibroblasts that strongly contribute to cancer progression.
Introduction
Estrogens trigger multiple biological responses mainly through the estrogen receptor α (ERα)2 and β (1, 2), which act as ligand-activated transcription factors binding to the estrogen-responsive elements located within the promoter of target genes (3–5). In addition, an increasing number of evidence has recently demonstrated that the G protein-coupled receptor named GPER functions as an estrogen receptor in normal and cancer cells (6–9). Indeed, GPER is widely distributed in neural, placental, hearth, prostate, hepatic, bone, vascular epithelial, lymphoid, and reproductive tissues as well as in breast, endometrial, ovarian, and thyroid carcinomas (10–14). Several studies, including our own (15–21), have shown that GPER mediates estrogen (17β-estradiol) signals activating the epidermal growth factor receptor (EGFR)/ERK/AP1 transduction pathway (22–28). In this context, it has been reported that GPER stimulates through Gαs the cAMP pathway and through Gβγ the Src activity, which leads to the shedding of heparin binding EGF and the activation of EGFR (12). As a consequence, several signaling cascades such as ERK, PI3K, and phospholipase C are engaged in the stimulation of downstream biological responses, including gene expression changes, cell proliferation, and migration (6, 14). One main metabolic change in cancer cells is represented by an altered lipogenic pathway such as an increased synthesis of fatty acids, which are important substrates in the energy production, building blocks of cellular membranes, intracellular second messengers, and anchorage for membrane proteins (29). Free fatty acids derive from both the diet and de novo synthesis, which is catalyzed in lipogenic tissues by fatty acid synthase (FASN) that is able to generate palmitate from malonyl-CoA and acetyl-CoA in the presence of NADPH (29, 30). In normal cells, FASN expression is relatively low and occurs in liver and adipose tissues mainly through nutritional signals; conversely, in cancer cells, FASN levels are elevated and independent of nutritional signals (31). FASN has been strongly associated with cell proliferation, aggressiveness, and metastasis in different types of tumors and considered predictive of poor prognosis in diverse malignancies (32). Although the mechanisms involved in the up-regulation of FASN in tumor cells remain to be completely understood, an intricate interplay between estrogen signaling and FASN function has been found in breast tumors (33). In the present study, we demonstrate for the first time that E2 regulates FASN expression and function through GPER in different types of cancer cells that do not express ERs. On the basis of our results, GPER signaling may be included among the transduction pathways by which E2 triggers fatty acid biogenesis, which strongly contributes to the development and aggressive features of diverse tumors.
EXPERIMENTAL PROCEDURES
Materials
17β-Estradiol (E2) and cerulenin were purchased from Sigma-Aldrich. Tyrphostin AG1478 was purchased from Biomol Research Laboratories, Inc. (Milan, Italy). PD98059 was obtained from Calbiochem (Milan, Italy). 1-[4-(-6-Bromobenzol [1, 3]diodo-5-yl)-3a,4,5,9btetrahydro-3H-cyclopenta[c-] quinolin8yl] ethanone (G-1) was purchased from Merck KGaA (Frankfurt, Germany). All compounds were dissolved in dimethyl sulfoxide, except for cerulenin, which was solubilized in ethanol.
Cell Cultures
The SkBr3 breast cancer cells were maintained in RPMI 1640 (Invitrogen) without phenol red, supplemented with 10% fetal bovine serum (FBS) and 100 μg/ml penicillin/streptomycin. The LoVo colorectal adenocarcinoma cells and the LNCaP prostate cancer cells were maintained in RPMI 1640 with phenol red, supplemented with 10% FBS and 100 μg/ml penicillin/streptomycin. The hepatocarcinoma cells HepG2 and the MCF-7 breast cancer cells were cultured in DMEM (Dulbecco's modified Eagle's medium) with phenol red, supplemented with 10% FBS and 100 μg/ml penicillin/streptomycin. All cell lines were grown in a 37 °C incubator with 5% CO2. Cancer-associated fibroblasts (CAFs) were extracted as described previously (25) and maintained in a mixture of MEDIUM 199 and HAM'S F-12 (1:1) supplemented with 10% FBS. Primary cells cultures of breast fibroblasts were characterized by immunofluorescence. Briefly, cells were incubated with human anti-vimentin (V9) and human anti-cytokeratin 14 (LL001); all antibodies were from Santa Cruz Biotechnology, DBA (Milan, Italy). In addition, we used antifibroblast-activated protein α antibody (H-56), also purchased from Santa Cruz Biotechnology, DBA, for fibroblast activation characterization (data not shown).
Gene Expression Studies
Total RNA was extracted using TRIzol commercial kit (Invitrogen) according to the manufacturer's instructions. RNA was quantified spectrophotometrically, and its quality was checked by electrophoresis through agarose gels stained with ethidium bromide. Only samples that were not degraded and showed clear 18 S and 28 S bands under ultraviolet light were used for real-time PCR.
Total cDNA was synthesized from the RNA by reverse transcription using the murine leukemia virus reverse transcriptase (Invitrogen) following the protocol provided by the manufacturer. The expression of selected gene was quantified by real-time PCR using Step OneTM sequence detection system (Applied Biosystems, Inc., Milan, Italy), following the manufacturer's instructions. Gene-specific primers were designed using Primer Express software (version 2.0, Applied Biosystems, Inc.) and are as follows. FASN and the ribosomal protein 18 S, which was used as a control gene to obtain normalized values: FASN (human), 5′-CATCCAGATAGGCCTCATAGAC-3′ (forward) and 5′-CTCCATGAAGTAGGAGTGGAAG-3′ (reverse); 18 S (human, mouse), 5′-GGCGTCCCCCAACTTCTTA-3′ (forward) and 5′-GGGCATCACAGACCTGTTATT-3′ (reverse). Assays were performed in triplicate, and the results were normalized for 18 S expression and then calculated as fold induction of RNA expression. For all experiments, cells were switched to medium without serum 24 h before treatments. FASN expression was evaluated also using semiquantitative RT-PCR, as described previously (34).
Western Blot Analysis
SkBr3, LoVo, HepG2 cells, and CAFs were grown in 10-cm dishes and exposed to drugs for the appropriate time and then washed twice with ice-cold PBS and solubilized with 50 mm Hepes-buffered solution, pH 7.5, containing 150 mm NaCl, 1.5 mm MgCl2, 1 mm EGTA, 10% glycerol, 1% Triton X-100, a mixture of protease inhibitors (aprotinin, PMSF, and sodium orthovanadate). Protein concentration in the supernatant was determined according to the Bradford method. Equal amounts (10–50 μg) of the whole cell lysate was electrophoresed through a reducing SDS/8% (w/v) polyacrylamide gel and electroblotted onto a nitrocellulose membrane, which was probed with primary antibodies against FASN (A-5), c-Fos (H-125), phosphorylated ERK1/2 (E-4), ERK2 (C-14), GPER (N-15), EGFR (1005), p-EGFR Tyr-1173 (sc-12351), and β-actin (C2), all purchased from Santa Cruz Biotechnology, Inc. The levels of proteins and phosphoproteins were detected after incubation with the horseradish peroxidase-linked secondary antibodies, by the ECL® (enhanced chemiluminescence) system (GE Healthcare).
Gene Silencing Experiments and Plasmids
Cells were plated onto 10-cm dishes, maintained in serum-free medium for 24 h, and then transfected for additional 24 or 48 h before treatments with a control vector or an independent shRNA sequence for each target gene using FuGENE 6 (Roche Diagnostics). The shRNA plasmid for EGFR was purchased from SABioscience Corp. (Frederick, MD). Short hairpin constructs against human GPER (shGPER) were generated and used as described previously (7). The plasmid DN/c-fos, which encodes a c-Fos mutant that heterodimerizes with c-Fos dimerization partners but does not allow DNA binding (35), was a kind gift from Dr. C. Vinson (National Institutes of Health, Bethesda, MD). The expression vector for FLAG-tagged human GPER has been described (15). It was used to generate the GPER rescue vector containing silent mutations in the shRNA-targeted sequence: codons 293–297 were changed to CCGTGTAAACAAAGT. The expression vector for human FASN was a kind gift from Dr. M. Loda (Dana-Farber Cancer Institute, Boston, MA).
Immunostaining Assay
Fifty percent confluent cultured SkBr3, LoVo, and HepG2 cells, and CAFs grown on coverslips were serum-deprived for 24 h and treated for 18 h with 1 nm E2. Then cells were fixed in 4% paraformaldehyde, permeabilized with 0.2% Triton X-100, washed three times with PBS, and incubated overnight with a mouse primary antibody against FASN (1:500). After incubation, the slides were extensively washed with PBS and incubated with propidium iodide (1:1000 Sigma-Aldrich) for cell nuclei detection and donkey anti-mouse IgG-FITC (1:250; purchased from Santa Cruz Biotechnology). The Leica AF6000 Advanced Fluorescence Imaging System supported by quantification and image processing software Leica Application Suite Advanced Fluorescence (Leica Microsystems CMS) were used for experiment evaluation.
Chromatin Immunoprecipitation (ChIP) Assay
SkBr3, LoVo, and HepG2 cells, and CAFs were grown in 10-cm dishes to 70–80% confluence, shifted to serum-free medium for 24 h, and then treated with vehicle, 1 nm E2, and G-1 for 3 h. Thereafter, cells were cross-linked with 1% formaldehyde and sonicated. Supernatants were immunocleared with sonicated salmon DNA/protein A-agarose (Upstate Biotechnology, Inc., Lake Placid, NY) and immunoprecipitated with the anti-Fos antibody or nonspecific IgG (Santa Cruz Biotechnology). Pellets were washed, eluted with a buffer consisting of 1% SDS and 0.1 mol/liter NaHCO3, and digested with proteinase K. DNA was obtained by phenol/chloroform extraction and precipitated with ethanol. A 4-μl volume of each sample was used as template to amplify an AP1-containing region corresponding to −1606/−1596 located in the 5′-flanking region of FASN gene by real-time PCR (Applied Biosystems, Milan, Italy). The primers used were as follows: 5′-CTGGCAGCCAGGGCCA-3′ (forward) and 5′-GCTGTGGTTGACGCACGG-3′ (reverse). To verify the specificity of c-Fos recruitment at the AP1 site, we also performed ChIP assay using the following primers: 5′- ACGCTCATTGGCCTGGG-3′ (forward) and 5′-TGGCTCCCTCTAGGCCGG-3′ (reverse), which amplify the estrogen target gene SREBP-1c containing region corresponding to −189/−171 located in the 5′-flanking region of the FASN gene (36). In particular, it was shown that the binding to the SREBP-1c site occurs in an ER-dependent manner upon estrogen stimulation (36). Real-time PCR data were normalized with respect to unprocessed lysates (input DNA). Input DNA quantification was performed by using 4 μl of the template DNA. The relative antibody-bound fractions were normalized to a calibrator that was chosen to be the basal, untreated sample. Final results were expressed as percent differences with respect to the relative inputs.
Proliferation Assays
For quantitative proliferation assays, 1 × 10⁴ SkBr3, LoVo, and HepG2 cells, and CAFs were seeded in 24-well plates in regular growth medium. Cells were washed once they had attached and further incubated in a medium supplemented with 2.5% charcoal-treated FBS. Ligands were added at this point; medium was changed every day (with ligands and cerulenin were applicable). On day 6 (after 5 days of treatment), cells were trypsinized and counted using CountessTM automated cell counter (purchased from Invitrogen).
Migration Assay
Migration assays were performed using Boyden chambers (Costar Transwell, 8-mm polycarbonate membrane). Cells were seeded in the upper chambers. E2 and G-1 alone or in combination with cerulenin were added to the medium without serum in the bottom wells. After 24 h, cells on the bottom side of the membrane were fixed and counted.
FASN Enzymatic Activity Assay
FASN activity in whole cells was measured by the incorporation of [1,2-4C]acetate (PerkinElmer Life Sciences) into fatty acids. Cells were plated in six-well plates at 3 × 10⁵ cells per dish and incubated overnight. The next day after 12 h of starvation, cells were treated with vehicle, 1 nm E2, 1 μm cerulenin, and 1 nm E2 + 1 μm cerulenin overnight and then incubated with 0.5 μCi/ml [1,2-14C]acetate for 8 h. Cells were washed and harvested in 1× PBS and [1,2-14C] incorporated lipids were extracted with chloroform/methanol (1:4). After centrifugation at 12,000 × g for 10 min, the lower phase containing radiolabeled lipids was counted by scintillation counter. FASN activity was calculated as nmol/mg total protein/min, and variations were reported as fold respect to the vehicle-treated cells. Each experiment was repeated at least in triplicate.
Statistical Analysis
Statistical analysis was performed using analysis of variance followed by Newman-Keuls' testing to determine differences in means. p < 0.05 was considered as statistically significant.
RESULTS
E2 and G-1 Induce FASN Expression in ER-negative Cancer Cells
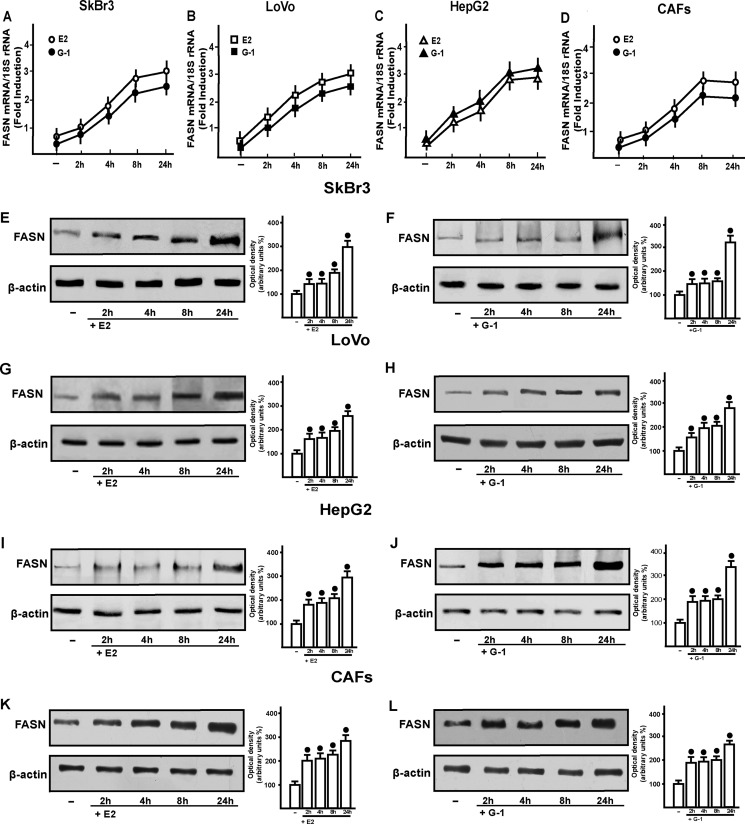
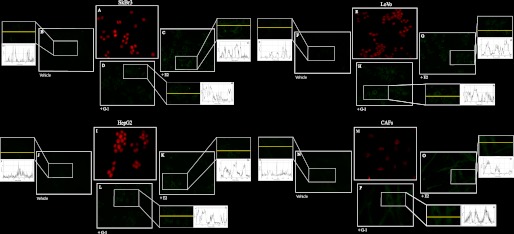
To provide novel insights into the mechanisms by which estrogens may regulate FASN gene in cancer cells, we began the present study evaluating FASN expression upon exposure to E2 and the GPER ligand G-1 in breast SkBr3, colorectal LoVo, and hepatocarcinoma HepG2 tumor cells, and in CAFs that lack the classical ERs but express GPER (supplemental Fig. 1). In time course experiments, E2 and G-1 showed the ability to increase the mRNA expression of FASN, as evaluated by real-time PCR (Fig. 1, A–D) and using a semiquantitative PCR (data not shown) (34). The up-regulation of FASN mRNA was paralleled by increased FASN protein levels upon exposure to E2 and G-1 (Fig. 1E-L), as also evaluated by immunofluorescence studies (Fig. 2).
FIGURE 1.
E2 and G-1 induce FASN expression in SkBr3, LoVo, and HepG2 cells and CAFs. 1 nm E2 and 1 μm G-1 up-regulate FASN expression at both mRNA (A–D) and protein level (E–L), as evaluated by real-time PCR and immunoblotting, respectively. In RNA experiments, gene expression was normalized to 18 S expression, and results are shown as fold changes of mRNA expression compared with cells treated with vehicle (−). Side panels show densitometric analyses of the blots normalized to β-actin. Each data point represents the mean ± S.D. of three independent experiments. Filled circles indicate p < 0.05 for cells receiving vehicle (−) versus treatments.
FIGURE 2.
Representative fluorescence images of FASN immunolabeling. SkBr3, LoVo, and HepG2 cells and CAFs were fixed, permeabilized, and stained with anti-FASN antibody. A, E, I, and M, nuclei (in red) were stained by propidium iodide. Cells were treated for 24 h with vehicle (B, F, J, and N), 1 nm E2 (C, G, K, and O), and 1 μm G-1 (D, H, L, and P), and FASN accumulation is evidenced by the green signal. For descriptive purposes, panels b1, c1, d1, f1, g1, h1, j1, k1, l1, n1, m1, and p1 show the plot profiles obtained at the level of the yellow line of the corresponding inset using the program WCIF ImageJ for Windows. Note the higher values indicating zones of intense labeling. Each experiment shown is representative of 10 random fields. Data are representative of three independent experiments.
GPER/EGFR/ERK/c-Fos/AP1 Signaling Mediates FASN Expression Induced by Estrogens
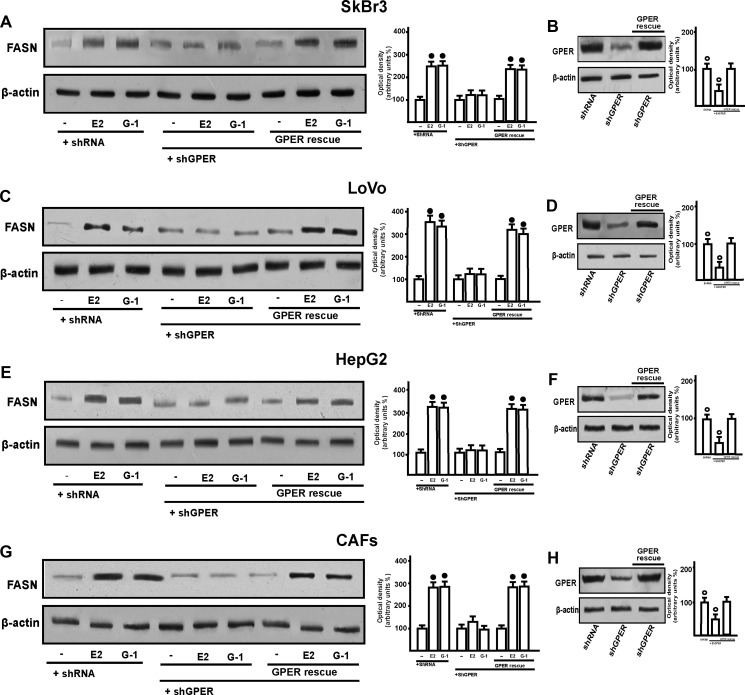
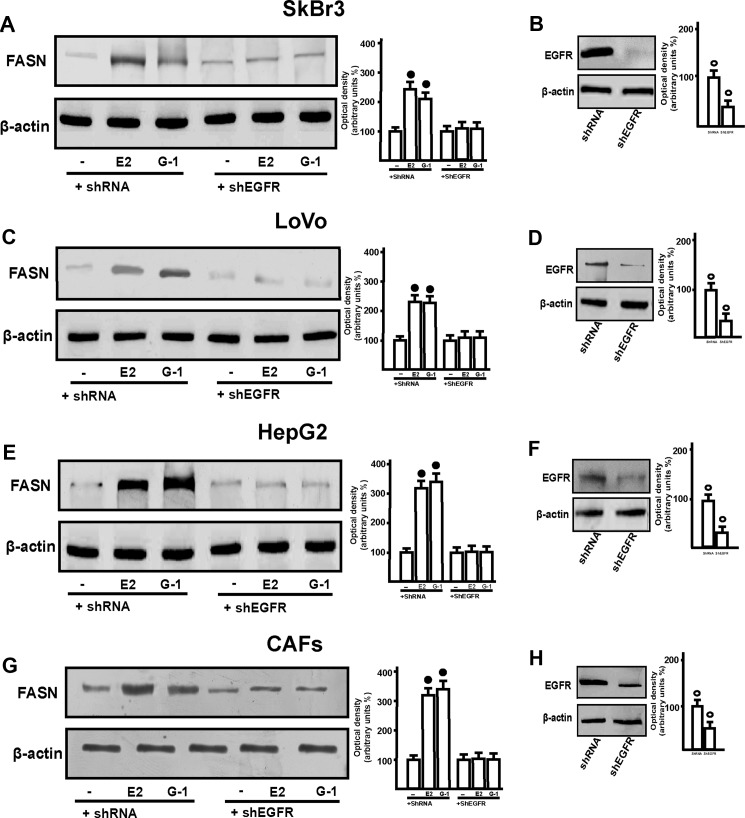
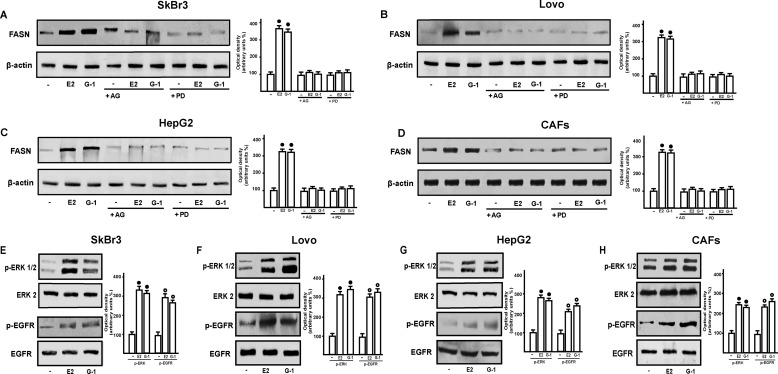
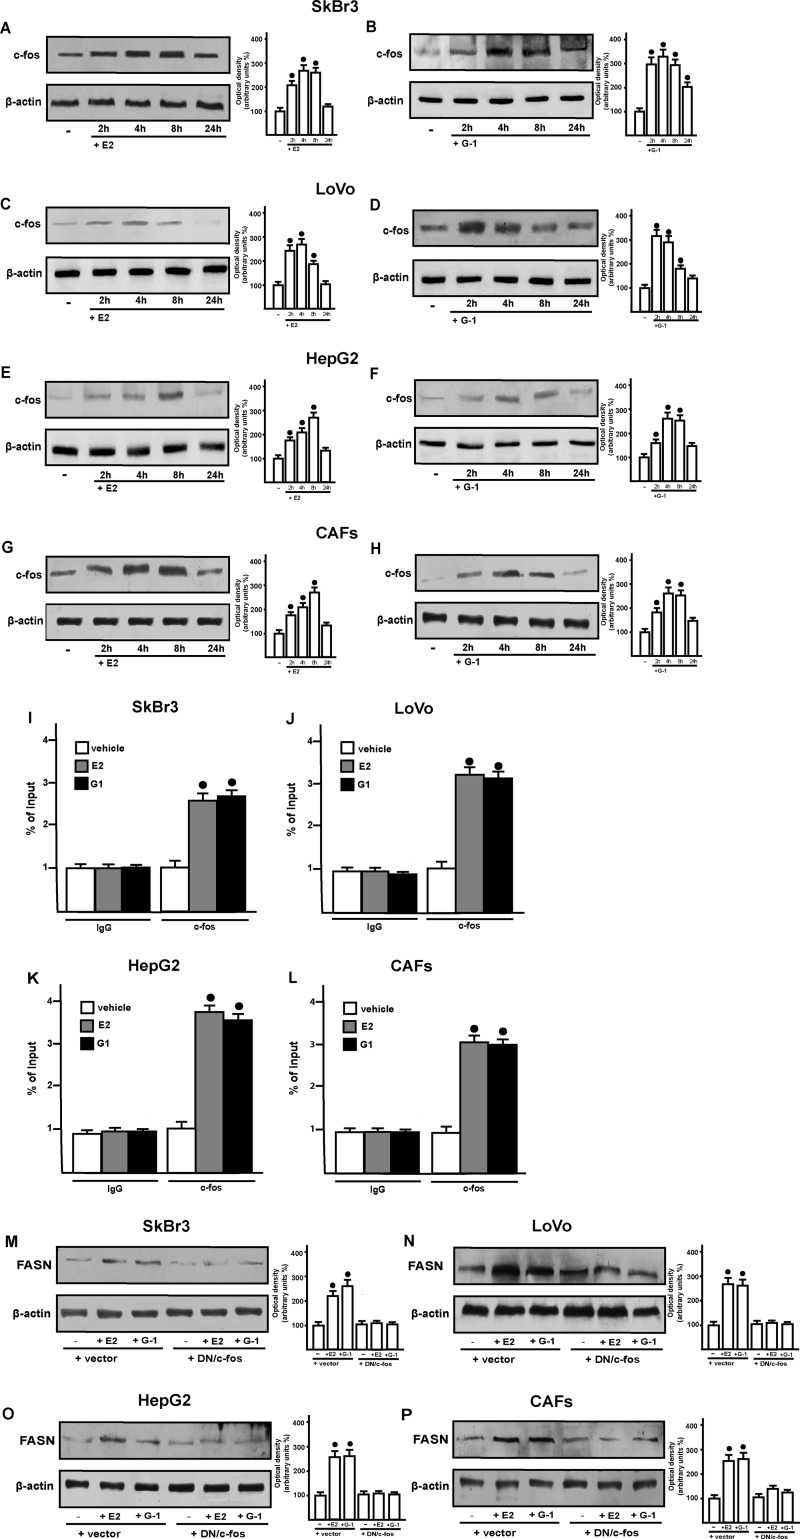
These results prompted us to evaluate the role exerted by GPER signaling in the up-regulation of FASN by E2. Silencing GPER in all cells used, E2 and G-1 did not induce FASN expression, suggesting that GPER mediates this effect. The requirement for GPER and the specificity of the GPER knockdown were further emphasized by the fact that the co-transfection of a shRNA-resistant version of GPER (“GPER rescue”) restored the response. (Fig. 3, A, C, E, and G). As GPER activation triggers EGFR signaling (14, 15), we next demonstrated that the increase of FASN protein levels induced by E2 and G-1 requires EGFR as determined through gene silencing experiment (Fig. 4, A, C, E, and G). Confirming this observation, E2 and G-1 lost the ability to up-regulate FASN protein expression using the EGFR inhibitor AG1478 as well as the MEK inhibitor PD98059 (Fig. 5, A–D). The latter finding was nicely supported by EGFR activation and the rapid ERK phosphorylation induced by E2 and G-1 in SkBr3, LoVo, and HepG2 cancer cells, and in CAFs (Fig. 5, E–H). As the GPER/EGFR/ERK transduction signaling triggers c-Fos expression (15–22), we first ascertained this response to E2 and G-1 (Fig. 6, A–H) and then we determined that c-Fos is recruited to the AP1 site located within the promoter sequence of FASN (Fig. 6, I–L). Amplifying a FASN promoter region containing the SREBP-1c site, which is an ER-mediated estrogen target gene (36), we did not observe the recruitment of c-Fos (data not shown), hence indicating the specificity of its binding to the AP1 site. Moreover, using a dominant-negative variant of c-fos the induction of FASN by E2 and G-1 was no longer evident (Fig. 6, M–P), further confirming the role played by c-Fos in this biological response. Taken together, these findings indicate that the GPER/EGFR/ERK/c-Fos/AP1 transduction pathway mediates the transcription of FASN induced by E2 and G-1 in our model system.
FIGURE 3.
GPER mediates the up-regulation of FASN protein levels by E2 and G-1 in SkBr3, LoVo, and HepG2 cells and CAFs. A, C, E, and G, the up-regulation of FASN by 1 nm E2 or 1 μm G-1 is abolished transfecting cells with shGPER and restored co-transfecting a resistant version of GPER named GPR30 rescue. Side panels show densitometric analyses of the blots normalized to β-actin. B, D, F, H, efficacy of GPER silencing and the restored GPER protein with GPER rescue. Each data point represents the mean ± S.D. of three independent experiments. Open and filled circles indicate p < 0.05 for cells receiving vehicle (−) versus treatments.
FIGURE 4.
EGFR is required for the up-regulation of FASN protein levels by E2 and G-1 in SkBr3, LoVo, and HepG2 cells and CAFs. A, C, E, and G, cells were transfected with shRNA or shEFGR for 24 h and then treated with 1 nm E2 or 1 μm G-1 for 24 h. Side panels show densitometric analyses of blot normalized to β-actin. B, D, F, and H, efficacy of EGFR silencing. Each data point represents the mean ± S.D. of three independent experiments. Open and filled circles indicate p < 0.05 for cells treated with vehicle (−) versus treatments.
FIGURE 5.
The EGFR/ERK signaling mediates the up-regulation of FASN induced by E2 and G-1 in SkBr3, LoVo, and HepG2 cells and CAFs. A–D, cells were treated for 24 h with vehicle (−), 1 nm E2, and 1 μm G-1 alone and in combination with 10 μm EGFR inhibitor AG1478 (AG), 10 μm MEK inhibitor PD98089 (PD). E–H, ERK1/2 activation and EGFR Tyr-1173 phosphorylation in SkBr3, LoVo, and HepG2 cells and CAFs treated with vehicle (−), 1 nm E2, and 1 μm G-1 for 15 min. Side panels show densitometric analyses of the blots normalized to β-actin (in the case of FASN expression), ERK2 (in the case of p-ERK1/2), and EGFR (in the case of p-EGFR). Each data point represents the mean ± S.D. of three independent experiments. Open and filled circles indicate p < 0.05 for cells receiving vehicle (−) versus treatments.
FIGURE 6.
Shown are immunoblots of c-Fos protein expression in SkBr3, LoVo, and HepG2 cells and CAFs treated with vehicle (−), 1 nm E2 and 1 μm G-1 for the indicated times (A–H). E2 and G-1 induce the recruitment of c-Fos to the AP1 site located within the FASN 5′-flanking region in SkBr3, LoVo, and HepG2 cells and CAFs (I–L). Cells were treated for 3 h with vehicle, 1 nm E2, and 1 μm G-1; therefore, the chromatin immunoprecipitation procedure was performed by using anti-c-Fos or nonspecific anti-IgG antibodies. The amplified sequences were evaluated by real-time PCR. M–P, an expression vector encoding for a dominant negative form of c-Fos (DN/c-fos) blocked the up-regulation of FASN protein levels by E2 and G-1. Side panels show densitometric analyses of the blots normalized to β-actin. Each data point represents the mean ± S.D. of three independent experiments. Filled circles indicate p < 0.05 for cells receiving vehicle (−) versus treatments.
FASN Is Involved in the Proliferation and Migration Induced by E2 and G-1
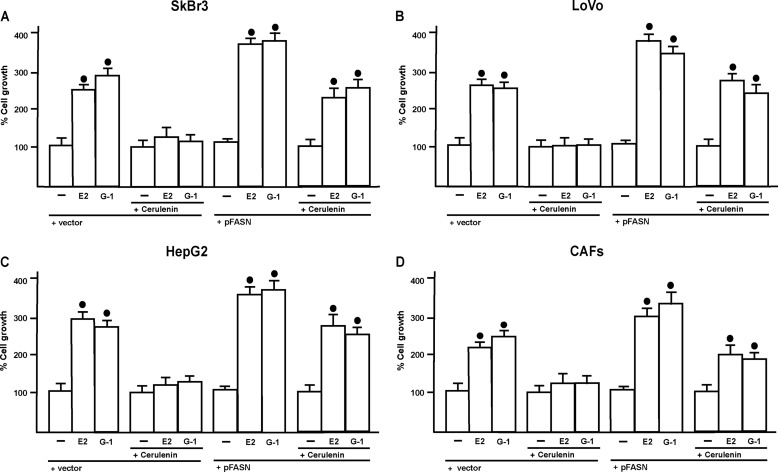
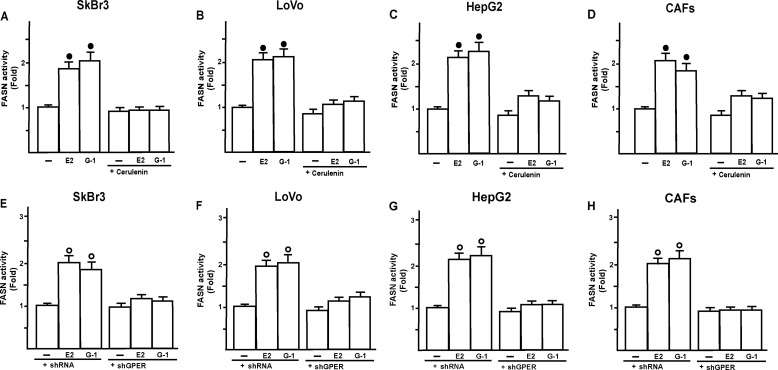
In diverse cancer cell types, FASN activity stimulates the synthesis of lipids, which are necessary for the initiation of signaling pathways involved in cell proliferation and migration (30, 32, 36). Performing proliferation assays in SkBr3, LoVo, and HepG2 cells, and CAFs, the increased cell growth observed upon exposure to E2 and G-1 was abolished using the inhibitor of the FASN activity named cerulenin [(2S,3R)-2,3-epoxi-4-oxo-7,10-dodecadienoxylamide] (Fig. 7, A–D), which was previously shown to repress cancer cell growth by inhibiting fatty acid synthesis (37–43). Proliferation assays were also performed using cerulenin in cells transfected with an expression vector of FASN (Fig. 7, A–D). The overexpression of FASN (supplemental Fig. 2) restored the growth effects induced by E2 and G-1, hence confirming that FASN contribute to this biological response. Next, the migration of all cell types promoted by E2 and G-1 was abolished in presence of cerulenin (supplemental Fig. 3), further corroborating the aforementioned results. To assess the efficacy of cerulenin, we evaluated FASN enzymatic activity by measuring the incorporation of [1,2-14C] acetate into fatty acids. As shown in Fig. 8, A–D, cerulenin inhibited FASN activity induced by E2 and G-1. Thereafter, transfecting cells with the shGPER the induction of FASN activity by E2 and G-1 was no longer evident (Fig. 8, E–H), suggesting that GPER mediates FASN expression and activity by E2 and G-1 in cancer cells and CAFs.
FIGURE 7.
E2 and G-1 induce proliferative effects in SkBr3, LoVo, and HepG2 cells and CAFs. In the proliferation assay, cells were transfected with an empty vector (vector) or an expression vector of FASN (pFASN) every 2 days, cells were treated with vehicle (−), 1 nm E2, 100 nm G-1 alone, and in combination with 1 μm cerulenin every day for 5 days and then counted on day 6 (A–D). Values shown are mean ± S.D. of three independent experiments. Filled circles indicate p < 0.05 for cells receiving vehicle (−) versus treatments.
FIGURE 8.
A–D, in SkBr3, LoVo, and HepG2 cells and CAFs, 1 nm E2 and 1 μm G-1 induce an increase of FASN enzymatic activity as evaluated by measuring the incorporation of [1,2-14C] acetate into fatty acids. FASN activity induced by E2 and G-1 was abolished using 1 μm cerulenin for 24 h (A–D). FASN activity induced by E2 and G-1 was prevented transfecting cells with shGPER (E–H). Each column represents the mean ± S.D. of three separated experiments. Filled and open circles indicate p < 0.05 for cells receiving vehicle versus treatments.
DISCUSSION
FASN is a key lipogenic enzyme that plays a relevant role in cancer pathogenesis and development (33). Accordingly, FASN expression has been found elevated in numerous types of cancer (44–46) and detected in a most intense manner in carcinomas with higher risk of recurrence and death (29), hence delineating its functional nature of a metabolic oncogene. As it concerns the regulation of FASN levels, steroid hormones, growth factors (for example, EGFR and ERBB2) and the PI3K-Akt signaling pathways were shown to modulate FASN expression (31, 47–50). However, how FASN is up-regulated in the first place in normal or preneoplastic cells to prime tumorigenesis is currently unclear, and the specific cytotoxicity of FASN inhibition in cancer cells as well as its role in chemotherapeutic resistance remain to be clarified. Overall, the aforementioned data regarding the FASN-dependent fatty acid synthesis in cancer cells make this enzyme as a suitable target for cancer treatment, mainly considering that the silencing of FASN expression inhibits the proliferation and induces apoptosis in cancer cells (37, 38). In this regard, it is worth nothing that the pharmacologic inhibitor of FASN activity, cerulenin, induced a selective cytotoxicity in cancer cells by decreasing fatty acid synthesis, which delayed the progression of breast, ovarian, and prostate human cancer xenografts and suppressed liver metastasis in a colon cancer xenograft model (39–43).
Steroid hormones may have a role in the regulation of FASN expression in hormone-responsive tumors. For example, FASN expression was shown to contribute to the estrogen-driven response, which stimulated the proliferation in hormone-dependent endometrial cells (51). In MCF-7 breast cancer cells, FASN expression was influenced by E2 and progestins through the sterol receptor element binding protein 1 (SREBP-1) pathway as also observed in prostate cancer cells by androgens (52). In these studies, the activation of steroid receptors mediated the up-regulation of FASN as the antiandrogen bicalutamide, the antiprogestin mifepristone (RU486), and the antiestrogens 4-hydroxytamoxifen and faslodex (ICI 182780) inhibited the FASN response to the cognate ligands of hormone receptors (30, 36, 53–56). Nevertheless, the inhibition of MAPK and PI3K signaling pathways abolished FASN induction by steroids (32, 51), suggesting that complex transduction mechanisms may contribute to the regulation of FASN expression.
In the context of these findings, our current results provide evidence regarding a new mechanism by which FASN may be regulated in a variety of tumor cells. We demonstrate that E2 and G-1 induce FASN expression and activity through the GPER-mediated signaling, which involves the EGFR/ERK/c-Fos/AP1 transduction pathway. In particular, we show that the induction of FASN by E2 and G-1 is mediated by sequential events such as the rapid activation of ERK1/2 and the stimulation of c-Fos, which is then recruited to an AP1 site located within the FASN promoter sequence. Of note, FASN was required for important biological responses to E2 and G-1 such as cell proliferation and migration in cancer cells and CAFs lacking the classical ERs but expressing GPER.
Tumor progression is not achieved solely by cancer cells, but neoplastic epithelial cells coexist in carcinomas with several types of stromal cells that generate the microenvironment of the cancer cells (57). Among the stromal components, the most important type of cells recruited into the tumor mass are represented by fibroblasts, which, acquiring an activated phenotype, act as important regulators of the paracrine signals between stromal and cancer cells (58). In particular, the specialized group of fibroblasts, referred to as CAFs, actively contribute to the growth and invasion of tumor cells by providing a unique tumor microenvironment (59). In this regard, it has been reported that CAFs express a wide number of growth factors and extracellular matrix remodeling enzymes that promote the proliferation and invasion of tumor cells as well as angiogenesis and chemoresistance (60, 61). In breast carcinoma, ∼80% of stromal fibroblasts exhibit the activated phenotype that induces the proliferation of cancer cells at the metastatic sites, stimulating the tumor growth such as for the primary tumor (62). In addition, stromal fibroblasts may promote the local production of estrogens, which largely contribute to the progression of breast carcinomas through a signal cross-talk with many transduction pathways activated by growth factors (63). CAFs may trigger tumor progression also through further mechanisms as they facilitate the invasiveness of otherwise non-invasive cancer cells when co-injected into mice (64). Altogether, the aforementioned information do not recapitulate the complex interactions between the tumor epithelium and stromal cells as the intricated pathways leading to cancer progression still remain to be fully dissected. Interestingly, the present study demonstrates that GPER mediates the up-regulation of FASN by E2 and G-1 also in CAFs. In addition, using cerulenin, we demonstrated that the estrogen-induced proliferation and migration of CAFs involves FASN activity. These findings, together with our previous data showing that GPER is required for the migration of CAFs induced by E2 (23), further highlight the potential of estrogens to stimulate tumor progression through the GPER-mediated FASN expression and activity.
The present investigation provides novel insights into the molecular mechanisms by which the endogenous lipogenesis may exert an oncogenic role in the development of estrogen-sensitive tumors. In this regard, the lipogenic features of cancer cells through GPER may offer new avenues to identify and develop innovative therapeutic agents capable of successfully interfering with the initiation and progression of both primary and metastatic hormone-responsive tumors.
This work was supported by Associazione Italiana per la Ricerca sul Cancro (Project 12849/2012), Associazione Italiana per la Ricerca sul Cancro Project Calabria 2011, and Fondazione Cassa di Risparmio di Calabria e Lucania.

This article contains supplemental Figs. 1–3.
- ERα
- estrogen receptor α
- FASN
- fatty acid synthase
- GPER
- G protein-coupled estrogen receptor
- EGFR
- EGF receptor.
REFERENCES
- 1. Kumar V., Chambon P. (1988) The estrogen receptor binds to its responsive element as a ligand-induced homodimer. Cell 55, 145–156 [DOI] [PubMed] [Google Scholar]
- 2. Tsai S. Y., Tsai M. J., O'Malley B. W. (1989) Cooperative binding of steroid hormone receptors contributes to transcriptional synergism at target enhancer elements. Cell 57, 443–448 [DOI] [PubMed] [Google Scholar]
- 3. Métivier R., Penot G., Hübner M. R., Reid G., Brand H., Kos M., Gannon F. (2003) Estrogen receptor-α directs ordered, cyclical, and combinatorial recruitment of cofactors on a natural target promoter. Cell 115, 751–763 [DOI] [PubMed] [Google Scholar]
- 4. Panno M. L., Salerno M., Pezzi V., Sisci D., Maggiolini M., Mauro L., Morrone E. G., Andò S. (1996) Effect of oestradiol and insulin on the proliferative pattern and on oestrogen and progesterone receptor contents in MCF-7 cells. J. Cancer Res. Clin. Oncol. 122, 745–749 [DOI] [PubMed] [Google Scholar]
- 5. Picard N., Charbonneau C., Sanchez M., Licznar A., Busson M., Lazennec G., Tremblay A. (2008) Phosphorylation of activation function-1 regulates proteasome-dependent nuclear mobility and E6-associated protein ubiquitin ligase recruitment to the estrogen receptor β. Mol. Endocrinol. 22, 317–330 [DOI] [PMC free article] [PubMed] [Google Scholar]
- 6. Maggiolini M., Picard D. (2010) The unfolding stories of GPR30, a new membrane-bound estrogen receptor. J. Endocrinol. 204, 105–114 [DOI] [PubMed] [Google Scholar]
- 7. Pandey D. P., Lappano R., Albanito L., Madeo A., Maggiolini M., Picard D. (2009) Estrogenic GPR30 signalling induces proliferation and migration of breast cancer cells through CTGF. EMBO J. 28, 523–532 [DOI] [PMC free article] [PubMed] [Google Scholar]
- 8. Prossnitz E. R., Arterburn J. B., Smith H. O., Oprea T. I., Sklar L. A., Hathaway H. J. (2008) Estrogen signaling through the transmembrane G protein-coupled receptor GPR30. Annu. Rev. Physiol. 70, 165–190 [DOI] [PubMed] [Google Scholar]
- 9. Prossnitz E. R., Maggiolini M. (2009) Mechanisms of estrogen signaling and gene expression via GPR30. Mol. Cell. Endocrinol. 308, 32–38 [DOI] [PMC free article] [PubMed] [Google Scholar]
- 10. Sirianni R., Chimento A., Ruggiero C., De Luca A., Lappano R., Andò S., Maggiolini M., Pezzi V. (2008) The novel estrogen receptor GPR30 mediates the proliferative effects induced by 17-βestradiol on mouse spermatogonial GC-1 cell line. Endocrinology 149, 5043–5051 [DOI] [PubMed] [Google Scholar]
- 11. Lappano R., Rosano C., De Marco P., De Francesco E. M., Pezzi V., Maggiolini M. (2010) Estriol acts as a GPR30 antagonist in estrogen receptor-negative breast cancer cells. Mol. Cell. Endocrinol. 320, 162–170 [DOI] [PubMed] [Google Scholar]
- 12. Filardo E. J., Quinn J. A., Bland K. I., Frackelton A. R., Jr. (2000) Estrogen-induced activation of Erk-1and Erk-2 requires the G protein-coupled receptor homolog, GPR30, and occurs via transactivation of the epidermal growth factor receptor through release of HB-EGF. Mol. Endocrinol. 14, 1649–1660 [DOI] [PubMed] [Google Scholar]
- 13. Maggiolini M., Vivacqua A., Fasanella G., Recchia A. G., Sisci D., Pezzi V., Montanaro D., Musti A. M., Picard D., Andò S. (2004) The G protein-coupled receptor GPR30 mediates c-Fos up-regulation by 17 β-estradiol and phytoestrogens in breast cancer cells. J. Biol. Chem. 279, 27008–27016 [DOI] [PubMed] [Google Scholar]
- 14. Albanito L., Madeo A., Lappano R., Vivacqua A., Rago V., Carpino A., Oprea T. I., Prossnitz E. R., Musti A. M., Andò S., Maggiolini M. (2007) G protein-coupled receptor 30 (GPR30) mediates gene expression changes and growth response to 17β-estradiol and selective GPR30 ligand G-1 in ovarian cancer cells. Cancer Res. 67, 1859–1866 [DOI] [PubMed] [Google Scholar]
- 15. Albanito L., Sisci D., Aquila S., Brunelli E., Vivacqua A., Madeo A., Lappano R., Pandey D. P., Picard D., Mauro L., Andò S., Maggiolini M. (2008a) Epidermal growth factor induces G protein-coupled receptor 30 expression in estrogen receptor-negative breast cancer cells. Endocrinology 149, 3799–3808 [DOI] [PMC free article] [PubMed] [Google Scholar]
- 16. Vivacqua A., Lappano R., De Marco P., Sisci D., Aquila S., De Amicis F., Fuqua S. A., Andò S., Maggiolini M. (2009) G protein-coupled receptor 30 expression is up-regulated by EGF and TGFα in estrogen receptor α-positive cancer cells. Mol. Endocrinol. 23, 1815–1826 [DOI] [PMC free article] [PubMed] [Google Scholar]
- 17. De Marco P., Bartella V., Vivacqua A., Lappano R., Santolla M. F., Morcavallo A., Pezzi V., Belfiore A., Maggiolini M. (March 19, 2012) Insulin-like growth factor-I regulates GPER expression and function in cancer cells. Oncogene 10.1038/onc.2012.97 [Epub ahead of print] [DOI] [PubMed] [Google Scholar]
- 18. Recchia A. G., De Francesco E. M., Vivacqua A., Sisci D., Panno M. L., Andò S., Maggiolini M. (2011) The G protein-coupled receptor 30 is up-regulated by hypoxia inducible factor-1a (HIF-1a) in breast cancer cells and cardiomyocytes. J. Biol. Chem. 286, 10773–10782 [DOI] [PMC free article] [PubMed] [Google Scholar]
- 19. Chimento A., Sirianni R., Delalande C., Silandre D., Bois C., Andò S., Maggiolini M., Carreau S., Pezzi V. (2010) 17 β-estradiol activates rapid signaling pathways involved in rat pachytene spermatocytes apoptosis through GPR30 and ER α. Mol. Cell. Endocrinol. 320, 136–144 [DOI] [PubMed] [Google Scholar]
- 20. Filice E., Recchia A. G., Pellegrino D., Angelone T., Maggiolini M., Cerra M. C. (2009) A new membrane G protein-coupled receptor (GPR30) is involved in the cardiac effects of 17β-estradiol in the male rat. J. Physiol. Pharmacol. 60, 3–10 [PubMed] [Google Scholar]
- 21. Lappano R., Santolla M. F., Pupo M., Sinicropi M. S., Caruso A., Rosano C., Maggiolini M. (2012) MIBE acts as antagonist ligand of both estrogen receptor α and GPER in breast cancer cells. Breast Cancer Res. 14, R12. [DOI] [PMC free article] [PubMed] [Google Scholar]
- 22. Lappano R., Maggiolini M. (2011) G protein-coupled receptors, novel targets for drug discovery in cancer. Nat. Rev. Drug Discov. 10, 47–60 [DOI] [PubMed] [Google Scholar]
- 23. Madeo A., Maggiolini M. (2010) Nuclear alternate estrogen receptor GPR30 mediates 17β-estradiol-induced gene expression and migration in breast cancer-associated fibroblasts. Cancer Res. 70, 6036–6046 [DOI] [PubMed] [Google Scholar]
- 24. Madeo A., Vinciguerra M., Lappano R., Galgani M., Gasperi-Campani A., Maggiolini M., Musti A. M. (2010) c-Jun activation is required for 4-hydroxytamoxifen-induced cell death in breast cancer cells. Oncogene 29, 978–991 [DOI] [PubMed] [Google Scholar]
- 25. Pupo M., Pisano A., Lappano R., Santolla M. F., De Francesco E. M., Abonante S., Rosano C., Maggiolini M. (2012) Bisphenol A induces gene expression changes and proliferative effects through GPER in breast cancer cells and cancer-associated fibroblasts. Environ. Health Perspect. 120, 1177–1182 [DOI] [PMC free article] [PubMed] [Google Scholar]
- 26. Thomas P., Pang Y., Filardo E. J., Dong J. (2005) Identity of an estrogen membrane receptor coupled to a G protein in human breast cancer cells. Endocrinology 146, 624–632 [DOI] [PubMed] [Google Scholar]
- 27. Bologa C. G., Revankar C. M., Young S. M., Edwards B. S., Arterburn J. B., Kiselyov A. S., Parker M. A., Tkachenko S. E., Savchuck N. P., Sklar L. A., Oprea T. I., Prossnitz E. R. (2006) Virtual and biomolecular screening converge on a selective agonist for GPR30. Nat. Chem. Biol. 2, 207–212 [DOI] [PubMed] [Google Scholar]
- 28. Vivacqua A., Bonofiglio D., Albanito L., Madeo A., Rago V., Carpino A., Musti A. M., Picard D., Andò S., Maggiolini M. (2006) 17β-estradiol, genistein, and 4-hydroxytamoxifen induce the proliferation of thyroid cancer cells through the G protein coupled-receptor GPR30. Mol. Pharmacol. 70, 1414–1423 [DOI] [PubMed] [Google Scholar]
- 29. Kuhajda F. P. (2000) Fatty-acid synthase and human cancer, new perspectives on its role in tumor biology. Nutrition 16, 202–208 [DOI] [PubMed] [Google Scholar]
- 30. Menendez J. A., Oza B. P., Colomer R., Lupu R. (2005) The estrogenic activity of synthetic progestins used in oral contraceptives enhances fatty acid synthase-dependent breast cancer cell proliferation and survival. Int. J. Oncol. 26, 1507–1515 [PubMed] [Google Scholar]
- 31. Menendez J. A., Vellon L., Lupu R. (2005) Targeting fatty acid synthase-driven lipid rafts, a novel strategy to overcome trastuzumab resistance in breast cancer cells. Med. Hypotheses 64, 997–1001 [DOI] [PubMed] [Google Scholar]
- 32. Kuhajda F. P. (2006) Fatty acid synthase and cancer, new application of an old pathway. Cancer Res. 66, 5977–5980 [DOI] [PubMed] [Google Scholar]
- 33. Menendez J. A., Lupu R. (2007) Fatty acid synthase and the lipogenic phenotype in cancer pathogenesis. Nat. Rev. Cancer 7, 763–777 [DOI] [PubMed] [Google Scholar]
- 34. Maggiolini M., Donzé O., Picard D. (1999) A non-radioactive method for inexpensive quantitative RT-PCR. Biol. Chem. 380, 695–697 [DOI] [PubMed] [Google Scholar]
- 35. Gerdes M. J., Myakishev M., Frost N. A., Rishi V., Moitra J., Acharya A., Levy M. R., Park S. W., Glick A., Yuspa S. H., Vinson C. (2006) Activator protein-1 activity regulates epithelial tumor cell identity. Cancer Res. 66, 7578–7588 [DOI] [PubMed] [Google Scholar]
- 36. Lupu R., Menendez J. A. (2006) Targeting fatty acid synthase in breast and endometrial cancer, An alternative to selective estrogen receptor modulators? Endocrinology 147, 4056–4066 [DOI] [PubMed] [Google Scholar]
- 37. Bandyopadhyay S., Zhan R., Wang Y., Pai S. K., Hirota S., Hosobe S., Takano Y., Saito K., Furuta E., Iiizumi M., Mohinta S., Watabe M., Chalfant C., Watabe K. (2006) Mechanism of apoptosis induced by the inhibition of fatty acid synthase in breast cancer cells. Cancer Res. 66, 5934–5940 [DOI] [PubMed] [Google Scholar]
- 38. Zhan Y., Ginanni N., Tota M. R., Wu M., Bays N. W., Richon V. M., Kohl N. E., Bachman E. S., Strack P. R., Krauss S. (2008) Control of cell growth and survival by enzymes of the fatty acid synthesis pathway in HCT-116 colon cancer cells. Clin. Cancer Res. 14, 5735–5742 [DOI] [PubMed] [Google Scholar]
- 39. Pizer E. S., Jackisch C., Wood F. D., Pasternack G. R., Davidson N. E., Kuhajda F. P. (1996) Inhibition of fatty acid synthesis induces programmed cell death in human breast cancer cells. Cancer Res. 56, 2745–2747 [PubMed] [Google Scholar]
- 40. Vance D., Goldberg I., Mitsuhashi O., Bloch K. (1972) Inhibition of fatty acid synthetases by the antibiotic cerulenin. Biochem. Biophys. Res. Commun. 48, 649–656 [DOI] [PubMed] [Google Scholar]
- 41. Wortman M. D., Clegg D. J., D'Alessio D., Woods S. C., Seeley R. J. (2003) C75 inhibits food intake by increasing CNS glucose metabolism. Nat Med. 9, 483–485 [DOI] [PubMed] [Google Scholar]
- 42. Murata S., Yanagisawa K., Fukunaga K., Oda T., Kobayashi A., Sasaki R., Ohkohchi N. (2010) Fatty acid synthase inhibitor cerulenin suppresses liver metastasis of colon cancer in mice. Cancer Sci. 101, 1861–1865 [DOI] [PMC free article] [PubMed] [Google Scholar]
- 43. Ikuta K., Coward J., Luftig R. B. (1986) The effect of cerulenin on the synthesis of the precursor gag polyprotein in defective murine leukemia and sarcoma virus producing cell lines. Virology 154, 207–213 [DOI] [PubMed] [Google Scholar]
- 44. Ollila S., Hyvönen M. T., Vattulainen I. (2007) Polyunsaturation in lipid membranes, dynamic properties and lateral pressure profiles. J. Phys. Chem. B 111, 3139–3150 [DOI] [PubMed] [Google Scholar]
- 45. Kumar-Sinha C., Ignatoski K. W., Lippman M. E., Ethier S. P., Chinnaiyan A. M. (2003) Transcriptome analysis of HER2 reveals a molecular connection to fatty acid synthesis. Cancer Res. 63, 132–139 [PubMed] [Google Scholar]
- 46. Yoon S., Lee M. Y., Park S. W., Moon J. S., Koh Y. K., Ahn Y. H., Park B. W., Kim K. S. (2007) Up-regulation of acetyl-CoA carboxylase α and fatty acid synthase by human epidermal growth factor receptor 2 at the translational level in breast cancer cells. J. Biol. Chem. 282, 26122–26131 [DOI] [PubMed] [Google Scholar]
- 47. Van de Sande T., De Schrijver E., Heyns W., Verhoeven G., Swinnen J. V. (2002) Role of the phosphatidylinositol 3′-kinase/PTEN/Akt kinase pathway in the overexpression of fatty acid synthase in LNCaP prostate cancer cells. Cancer Res. 62, 642–646 [PubMed] [Google Scholar]
- 48. Rysman E., Brusselmans K., Scheys K., Timmermans L., Derua R., Munck S., Van Veldhoven P. P., Waltregny D., Daniëls V. W., Machiels J., Vanderhoydonc F., Smans K., Waelkens E., Verhoeven G., Swinnen J. V. (2010) De novo lipogenesis protects cancer cells from free radicals and chemotherapeutics by promoting membrane lipid saturation. Cancer Res. 70, 8117–8126 [DOI] [PubMed] [Google Scholar]
- 49. Pizer E. S., Lax S. F., Kuhajda F. P., Pasternack G. R., Kurman R. J. (1998) Fatty acid synthase expression in endometrial carcinoma, correlation with cell proliferation and hormone receptors. Cancer 83, 528–537 [PubMed] [Google Scholar]
- 50. Swinnen J. V., Ulrix W., Heyns W., Verhoeven G. (1997) Coordinate regulation of lipogenic gene expression by androgens, evidence for a cascade mechanism involving sterol regulatory element binding proteins. Proc. Natl. Acad. Sci. U.S.A. 94, 12975–12980 [DOI] [PMC free article] [PubMed] [Google Scholar]
- 51. Lacasa D., Le Liepvre X., Ferre P., Dugail I. (2001) Progesterone stimulates adipocyte determination and differentiation 1/sterol regulatory element binding protein 1c gene expression, potential mechanism for the lipogenic effect of progesterone in adipose tissue. J. Biol. Chem. 276, 11512–11516 [DOI] [PubMed] [Google Scholar]
- 52. Swinnen J. V., Esquenet M., Goossens K., Heyns W., Verhoeven G. (1997a) Androgens stimulate fatty acid synthase in the human prostate cancer cell line LNCaP. Cancer Res. 57, 1086–1090 [PubMed] [Google Scholar]
- 53. Wang Y. Y., Kuhajda F. P., Li J., Finch T. T., Cheng P., Koh C., Li T., Sokoll L. J., Chan D. W. (2004) Fatty acid synthase as a tumor marker, its extracellular expression in human breast cancer. J. Exp. Ther. Oncol. 4, 101–110 [PubMed] [Google Scholar]
- 54. Migita T., Ruiz S., Fornari A., Fiorentino M., Priolo C., Zadra G., Inazuka F., Grisanzio C., Palescandolo E., Shin E., Fiore C., Xie W., Kung A. L., Febbo P. G., Subramanian A., Mucci L., Ma J., Signoretti S., Stampfer M., Hahn W. C., Finn S., Loda M. (2009) Fatty acid synthase, a metabolic enzyme and candidate oncogene in prostate cancer. J. Natl. Cancer Inst. 101, 519–532 [DOI] [PMC free article] [PubMed] [Google Scholar]
- 55. Abramson. H. N. (2011) The lipogenesis pathway as a cancer target. J. Med. Chem. 54, 5615–5638 [DOI] [PubMed] [Google Scholar]
- 56. Menendez J. A., Colomer R., Lupu R. (2005) Why does tumor-associated fatty acid synthase (oncogenic antigen-519) ignore dietary fatty acids? Med Hypotheses 64, 342–349 [DOI] [PubMed] [Google Scholar]
- 57. Bhowmick N. A., Neilson E. G., Moses H. L. (2004) Stromal fibroblasts in cancer initiation and progression. Nature 432, 332–337 [DOI] [PMC free article] [PubMed] [Google Scholar]
- 58. Kalluri R., Zeisberg M. (2006) Fibroblasts in cancer. Nat. Rev. Cancer 6, 392–401 [DOI] [PubMed] [Google Scholar]
- 59. Lorusso G., Rüegg C. (2008) The tumor microenvironment and its contribution to tumor evolution toward metastasis. Histochem. Cell Biol. 130, 1091–1103 [DOI] [PubMed] [Google Scholar]
- 60. Xing F., Saidou J., Watabe K. (2010) Cancer associated fibroblasts (CAFs) in tumor microenvironment. Front Biosci. 15, 166–179 [DOI] [PMC free article] [PubMed] [Google Scholar]
- 61. Lafkas D., Trimis G., Papavassiliou A. G., Kiaris H. (2008) P53 mutations in stromal fibroblasts sensitize tumors against chemotherapy. Int. J. Cancer 123, 967–971 [DOI] [PubMed] [Google Scholar]
- 62. Orimo A., Gupta P. B., Sgroi D. C., Arenzana-Seisdedos F., Delaunay T., Naeem R., Carey V. J., Richardson A. L., Weinberg R. A. (2005) Stromal fibroblasts present in invasive human breast carcinomas promote tumor growth and angiogenesis through elevated SDF-1/CXCL12 secretion. Cell. 121, 335–348 [DOI] [PubMed] [Google Scholar]
- 63. Yamaguchi Y., Hayashi S. (2009) Estrogen-related cancer microenvironment of breast carcinoma. Endocr. J. 56, 1–7 [DOI] [PubMed] [Google Scholar]
- 64. Dimanche-Boitrel M. T., Vakaet L., Jr., Pujuguet P., Chauffert B., Martin M. S., Hammann A., Van Roy F., Mareel M., Martin F. (1994) In vivo and in vitro invasiveness of a rat colon-cancer cell line maintaining E-cadherin expression, an enhancing role of tumor associated myofibroblasts. Int. J. Cancer 56, 512–521 [DOI] [PubMed] [Google Scholar]


