

Background: Ras proteins must be plasma membrane-localized for biological activity.
Results: A high content screen identified staurosporines as inhibitors of Ras plasma membrane localization and K-Ras signal transmission by disrupting endosomal recycling of phosphatidylserine.
Conclusion: Staurosporines are novel inhibitors of phosphatidylserine trafficking.
Significance: Ras trafficking pathways and Ras spatiotemporal organization on the plasma membrane are valid targets for anti-Ras drug development.
Keywords: Lipid Raft, Phosphatidylserine, Ras, Signal Transduction, Trafficking, High Content Screening, Staurosporines
Abstract
Oncogenic mutant Ras is frequently expressed in human cancers, but no anti-Ras drugs have been developed. Since membrane association is essential for Ras biological activity, we developed a high content assay for inhibitors of Ras plasma membrane localization. We discovered that staurosporine and analogs potently inhibit Ras plasma membrane binding by blocking endosomal recycling of phosphatidylserine, resulting in redistribution of phosphatidylserine from plasma membrane to endomembrane. Staurosporines are more active against K-Ras than H-Ras. K-Ras is displaced to endosomes and undergoes proteasomal-independent degradation, whereas H-Ras redistributes to the Golgi and is not degraded. K-Ras nanoclustering on the plasma membrane is also inhibited. Ras mislocalization does not correlate with protein kinase C inhibition or induction of apoptosis. Staurosporines selectively abrogate K-Ras signaling and proliferation of K-Ras-transformed cells. These results identify staurosporines as novel inhibitors of phosphatidylserine trafficking, yield new insights into the role of phosphatidylserine and electrostatics in Ras plasma membrane targeting, and validate a new target for anti-Ras therapeutics.
Introduction
Ras GTPases are molecular switches that regulate cell growth, proliferation, and differentiation. The three ubiquitously expressed Ras isoforms H-Ras, N-Ras, and K-Ras4B (hereafter called K-Ras) share a near identical G-domain that binds guanine nucleotides and interacts with common sets effectors and exchange factors (1). The C-terminal 24 residues of Ras, the hypervariable region (HVR),2 exhibit substantial sequence divergence between isoforms. The HVR contains two signal sequences that translocate Ras to the inner plasma membrane (PM) (1). The first, a CAAX motif (where C = Cys, A = aliphatic amino acid, and X = Ser or Met), is common to all Ras isoforms and undergoes multistep processing to generate a C-terminal cysteine farnesyl carboxy-methyl ester (1). The second signal comprises palmitoylation of one or two cysteine residues in N- and H-Ras and a polybasic sequence of contiguous lysine residues in K-Ras (1). H- and N-Ras are palmitoylated in the ER and Golgi and then traffic through the classical secretory pathway to the PM (2, 3). The fidelity of H-Ras localization is maintained by thioesterases that return depalmitoylated H-Ras to the ER and Golgi for repalmitoylation and vectorial trafficking back to the PM (4, 5). The trafficking pathway used by K-Ras to access the PM from the ER is unknown. Early studies implicated microtubules (6, 7) and a possible role for mitochondria (8), but K-Ras membrane binding is mediated by interaction of the C-terminal polybasic domain with the strongly electronegative inner leaflet of the PM; thus, K-Ras may simply diffuse down an electrostatic gradient (9–11). Proteins such as PDEδ and PRA1, bind the prenylated C terminus of small GTPases, including K-Ras, and enhance membrane dissociation (12). Thus PDEδ may promote the fidelity of PM targeting by facilitating cytosolic diffusion of prenylated K-Ras (13, 14).
Oncogenic Ras proteins, expressed in ∼15% of all human tumors, are major drivers of transformation (15), with the predominant clinical problem being mutant K-Ras (15, 16). Point mutations in the CAAX motif prevent all posttranslational processing, block PM localization, and abrogate all biological and oncogenic activity (17). Farnesyl transferase inhibitors (FTIs) should phenocopy this mode of Ras inhibition; however, in cells treated with FTIs, K-Ras and N-Ras undergo alternative processing by geranylgeranyl transferase 1 (18). Geranylgeranylated K-Ras and N-Ras localize normally to the PM and are equipotent with farnesylated K- and N-Ras in transforming assays (19). The potential therapeutic effect of FTIs is, therefore, subverted. Despite the clinical failure of FTIs, the basic biological observation that preventing K-Ras PM localization abrogates transforming activity remains valid and is the basis of the current study.
EXPERIMENTAL PROCEDURES
Plasmids and Reagents
All mGFP-Ras and Ras anchor constructs have been described previously (2, 46, 47). To generate stable cell lines, constructs were cloned into a pEF6/V5-His-Topo expression plasmid (Invitrogen), and for transient expression studies, constructs were generally expressed from a CMV expression plasmid (Invitrogen). mCherry-CAAX was generated by cloning amino acids 179–189 of H-RasC181S, C184S, onto the C terminus of mCherry in the pEF6/V5-His-Topo expression plasmid (Invitrogen). mGFP-Rac1 and mGFP-Rap1 were kind gifts from Dr. Mark Philips (NYU). mGFP-LactC2 and mRFP-KRΦ were kind gifts from Dr. Sergio Grinstein (Toronto) (9, 32). Supplemental quantities of the staurosporines (staurosporine, 7-oxostaurosporine, UCN-01, and UCN-02) were obtained from BioAustralis (Australia). Antibodies against N-Ras (sc-31) and H-Ras (sc-520) were obtained from Santa Cruz Biotechnology (Santa Cruz, CA). Anti-c-K-Ras (R3400) and anti-β-Actin (A1978) antibodies were from Sigma. Anti-panRas (610001) were obtained from BD Transduction Laboratories. Anti-phospho-p44/42 mitogen-activated protein kinase (ERK1/2) (Thr-202/Tyr-204) (#9101), anti-phospho-Akt (pAkt) (Ser473) (#9271), and cleaved caspase-3 (#9664) antibodies were from Cell Signaling Technology (Beverly, MA). Anti-EEA1 (ab2900) and anti-Rab7 (ab50533) antibodies were from Abcam (Cambridge, MA). CellLight Mitochondria-RFP (C10601), CellLight ER-RFP (C10591), and CellLight Golgi-RFP (C10593) markers were from Invitrogen.
Generating Stable Cell Lines
Madin-Darby canine kidney (MDCK) cells maintained in Dulbecco's modified Eagle's medium supplemented with 10% fetal calf serum were transfected with mGFP-CTK, mGFP-CTH, or mGFP-RasG12V with or without mCherry-CAAX using Lipofectamine 2000 (Invitrogen) according to the manufacturer's instructions. Cells were maintained in 10 μg/ml blasticidin (Sigma) for 5 days, and monoclonal colonies were selected and expanded. All cells were grown at 37 °C in 5% CO2.
High Content Assay
MDCK cells stably expressing mGFP-CTK or mGFP-CTH were plated at 30,000 cells/well on 96-well glass-bottomed plates (MGB096–1-2-LG-L, Matrical). The next day cells were treated with microbial extracts or pure metabolites and incubated for another 48 h. Cells were then fixed with 4% paraformaldehyde and stored in phosphate-buffered saline (PBS) at 4 °C until imaged. Plates were imaged using a BD Pathway 855 High Content Bioimager. Images were acquired 3 × 3 montage with 20× objective lens using a GFP confocal mode.
Microbial Extracts Library
The discovery resource was a library of microbial extracts prepared from a collection of talented actinomycetes and fungi. The talented strains were selected from 5000 microbial extracts analyzed against an array of bioassays including antibacterial, antifungal, nematocidal, and cytotoxicity assays and subjected to high performance liquid chromatography diode array detection to define the secondary metabolite distributions. Typically, a talented microbe produced greater than 20 metabolites comprising up to 5 major metabolites with UV spectra belonging to a minimum of 5 chemical classes displaying bioassay activity in some but not all bioassays. The library comprising 540 extracts was constructed by selection of microbe biological and secondary metabolite HPLC profiles. Known or commonly encountered actives such as antibiotics and antifungals were not dereplicated from the collection; rather, extracts displaying the known metabolites but differing bioassay and metabolite profiles were included to provide limited or controlled duplication. This inclusive structure of known actives rather than the exclusive depreciation strategy favored in screening microbial libraries ensures that known actives and their respective co-metabolites are not ignored in drug discovery.
EM and Spatial Mapping of Basal Plasma Membranes in Polarized Epithelial Cells
MDCK cells transiently expressing mGFP-KG12V or mGFP-LactC2 were seeded onto fibronectin-coated, gold EM grids (IGG200, Ted Pella Inc). After 48 h of growth, the apical membrane was removed by placing PBS-soaked Whatman filter paper onto the cells for 5 min (48), applying pressure using a silicon bung and then removing the filter paper. This procedure leaves the cytosolic surface of the adherent basal PM exposed. Basal PM sheets that remained attached to the gold EM grid were washed and fixed, and the cytosolic leaflet was labeled with anti-GFP antibody conjugated to 4.5-nm gold particles as previously described (46, 49). Digital images of the immunogold-labeled plasma membrane sheets were taken in a JEOL 1400 transmission EM. Intact 1-μm2 areas of the plasma membrane sheet were identified using ImageJ, and the x, y coordinates of the gold particles were determined (46, 49). K-functions (49) were calculated and standardized on the 99% confidence interval for complete spatial randomness. Bootstrap tests to examine differences between replicated point patterns were constructed exactly as described previously, and statistical significance evaluated against 1000 bootstrap samples (50).
Western Blotting
Cells were washed in cold PBS and lysed in buffer containing 50 mm TrisCl (pH 7.5), 75 mm NaCl, 25 mm NaF, 5 mm MgCl2, 5 mm EGTA, 1 mm dithiothreitol, 100 μm NaVO4, 1% Nonidet P40 plus protease inhibitors. SDS-PAGE was generally performed using 20 μg of each lysate followed by semidry Western transfer and immunoblotting with the specified antibody. Signal was detected by enhanced chemiluminescence (SuperSignal; Pierce) and quantified using a FluorChemQ (Alpha Inotech, San Leandro, CA) with FluorChemQ software.
Fluorescence Microscopy
For immunostaining cells were fixed with 4% paraformaldehyde, permeabilized in 0.2% Triton X-100, and blocked with 5% goat serum. Incubations with primary and secondary antibodies were for 1 h. Cells were imaged in a Nikon A1R confocal microscope using ×60 or ×100 objectives. High resolution image deconvolution was performed using NIS Elements ARps 3.0 software.
Manders Coefficient
MDCK cells stably co-expressing mGFP-RasG12V and mCherry-CAAX were imaged in a confocal microscope. Using ImageJ software v1.42q, images were converted to 8-bit, and a threshold to a control pixel of each image was set. The fraction of mCherry-CAAX co-localizing with mGFP-RasG12V was calculated using a Manders coefficient plugin downloaded from Wright Cell Image Facility.
Annexin V Binding Assay
MDCK cells were incubated with CF647-conjugated annexin V (FCCH100108, Millipore) according to the manufacturer's instruction. Positive cells were counted using a BD LSR Fortessa Cell Analyzer with a 670/30 APC filter.
Preparing Phosphatidylserine
1,2-Diacyl-sn-glycero-3-phospho-l-serine (P6641, Sigma) supplied in chloroform:methanol was dried under vacuum in a glass vial to remove the solvent, redissolved in MDCK growth medium by sonication, and diluted to give a final concentration of 10 μm.
Statistical Analysis
Prism (Version 5.0c, GraphPad Software) was used for one-way ANOVA tests and two-tailed t tests.
RESULTS
Discovery Process for Inhibitors of Ras Plasma Membrane Localization
We designed a high content assay to identify compounds that inhibit PM localization of K-Ras and/or H-Ras and that may thereby inhibit Ras biological activity. We generated MDCK cells stably expressing mGFP linked to the full-length HVR of K-Ras (=CTK, K-Ras residues 166–188) or the full-length HVR of H-Ras (=CTH, H-Ras residues 166–189). The isolated HVR of Ras undergoes full post-translational processing and targets fusion proteins efficiently to the PM (2, 3). Mislocalization of mGFP-CTK or mGFP-CTH from the PM indicates disruption of post-translational modification or trafficking. Cells were treated with compounds for 48 h to allow Ras turnover and visualization of effects on the trafficking of newly synthesized Ras. For discovery, we used a microbial extracts library to cover the greatest chemical diversity and space within a limited number of fractions. Here an estimated 10,000 metabolites were tested within the 540 extracts examined. 21 extracts displayed one of four distinct Ras mislocalization phenotypes (supplemental Fig. S1). One phenotype involved the mislocalization of mGFP-CTK and mGFP-CTH into large intracellular inclusions, which EM identified as multivesicular bodies (supplemental Fig. S1). All extracts yielding this phenotype were derived from bafilomycin producing microbes, and the bioactive identity was confirmed by showing that bafilomycin A1 reproduced the phenotype (supplemental Fig. S1). Although the ability of bafilomycin to drive Ras into multivesicular bodies has been documented (20), our result provides an example of library utility and proof of concept. Two other extracts that caused significant displacement of both mGFP-CTK and mGFP-CTH from the PM contained staurosporine-related UV spectra but with different co-metabolites. Although staurosporine (STS) was the most abundant analog in both cultures, related metabolites, 7-oxostaurosporine (OSS), UCN-01, and UCN-02, were also present. These compounds have been extensively studied as multi-kinase inhibitors but have not previously been shown to inhibit Ras PM association and were selected for further investigation.
Staurosporines Mislocalize Ras from the Plasma Membrane
To quantify mGFP-Ras mislocalization from the PM, we measured colocalization of mGFP-Ras with mCherry-CAAX, a fusion protein that has the isolated C-terminal CAAX box of H-Ras (CVIM) appended to the C terminus of mCherry and that is generically targeted to endomembranes (3). The distribution of mCherry-CAAX effectively mirrors the distribution of a Ras protein that has had the second signal for PM targeting removed or blocked. MDCK cells stably co-expressing oncogenic mutant mGFP-K-RasG12V (mGFP-KG12V) or mGFP-H-RasG12V (mGFP-HG12V) and mCherry-CAAX were treated with each staurosporine for 48 h and imaged by confocal microscopy. EC50 values of Ras PM mislocalization were derived from Manders coefficients by measuring the fraction of mCherry-CAAX co-localizing with mGFP-RasG12V. All four staurosporines mislocalized KG12V from the PM with varying efficacies; their EC50 values were 0.42, 8.2, 52, and 840 nm for STS, OSS, UCN-02, and UCN-01, respectively (Fig. 1 and supplemental Fig. S2). The compound efficacy rank order was the same for both Ras isoforms, but each EC50 value was ∼4–10-fold higher for H-Ras than K-Ras, indicating that K-Ras PM targeting is more sensitive to staurosporines than H-Ras PM targeting. At high concentrations (>15–20× EC50) all the staurosporines induced a significant shape change in HG12V-transformed cells, with loss of columnar morphology, and were more toxic to HG12V-transformed cells than KG12V-transformed cells (Fig. 1 and supplemental Fig. S2).
FIGURE 1.

Staurosporines mislocalize K-Ras and H-Ras. MDCK cells stably co-expressing mCherry-CAAX and mGFP-KG12V or mGFP-HG12V were treated with various concentrations of STS and analogs for 48 h. Cells were fixed, and mCherry and mGFP images were taken in a confocal microscope. Representative images of OSS 10 and 50 nm treatments are shown in a and b. Further images are shown in supplemental Fig. S2. Ras mislocalization was quantified using Manders coefficients to measure the fraction of mCherry-CAAX co-localizing with mGFP-RasG12V. c, EC50 values for each compound were estimated from the Manders coefficient dose-response plots. d, MDCK cells stably expressing mGFP-KG12V or mGFP-HG12V were treated with OSS for 96 h, and growth media with fresh OSS was replaced after 48 h. The level of phospho-MARCKS was measured by immunoblotting. β-Actin was used as a loading control. The blots are representative of three independent experiments. e, MDCK cells stably expressing mGFP-KG12V,S181A were treated with OSS for 48 h and imaged after fixation in a confocal microscope.
STS, OSS, UCN-01, and UCN-02 are known protein kinase C (PKC) inhibitors; however, several lines of evidence strongly suggest that Ras mislocalization is unrelated to PKC inhibition. First, the potency rank order of this set of compounds as PKC inhibitors, UCN-01 > STS ≈ OSS > UCN-02 (21–23), does not correlate with the rank order in the K-Ras localization assay, STS > OSS > UCN-02 > UCN-01, indicating a very different structure-activity relation for the two activities. Importantly, UCN-01, the most selective kinase inhibitor of the staurosporine family, shows contrasting selectivity in K-Ras mislocalization compared with its isomer UCN-02 (23). Second, the level of p-MARCKS, a PKC substrate, in MDCK cells stably expressing KG12V or HG12V was not changed by treatment with concentrations of OSS that mislocalize KG12V (Fig. 1d), although p-MARCKS levels could be reduced with higher concentrations of OSS. Third, although there is compelling literature linking PKC signaling to K-Ras localization, it is activation, not inhibition, of PKC that drives K-Ras from PM to endomembrane (24). And finally, PKC mediated phosphorylation of Ser-181 in the K-Ras polybasic domain, operates a farnesyl-electrostatic switch that releases K-Ras PM binding, and re-targets K-Ras to mitochondria and endomembrane. K-Ras with a S181A substitution (KG12V,S181A) is unaffected by PKC activation. Fig. 1e shows, however, that mGFP-KG12V,S181A was equally sensitive to OSS as mGFP-KG12V, confirming that OSS-induced KG12V mislocalization is unrelated to phosphorylation at Ser-181. Taking these results together, we conclude that the mechanism of action of the staurosporines on Ras localization does not involve PKC inhibition.
To explore alternative mechanisms of action of the staurosporines, we first determined the location of mislocalized Ras. High resolution confocal imaging revealed that much of the intracellular mGFP-KG12V and mGFP-HG12V in OSS-treated cells associated with vesicular structures. Co-staining with organelle markers showed that low dose OSS induced partial co-localization of mGFP-KG12V with EEA1-, Rab7-, mitochondria-, Golgi-, and ER-positive structures, indicating that KG12V is displaced from the PM to early endosomes, late endosomes or lysosomes, mitochondria, the Golgi, and the ER (Fig. 2 and supplemental Fig. S3). In contrast, low dose OSS predominantly enhanced mGFP-HG12V co-localization with Golgi markers (Fig. 2 and supplemental Fig. S3). Thus K-Ras is driven to intracellular membranes that K-Ras does not generally occupy, whereas H-Ras is essentially redistributed from the PM to the Golgi, which is normally involved in H-Ras trafficking and recycling.
FIGURE 2.

Staurosporines mislocalize KG12V and HG12V to endomembranes. MDCK cells stably expressing mGFP-KG12V or mGFP-HG12V were treated with 50 nm OSS for 48 h and fixed. a and b, cells were permeabilized and incubated with EEA1 or Rab7 primary antibodies and Alexa546-conjugated secondary antibodies. c–f, cells were incubated with modified baculoviruses encoding RFP-tagged organelle markers for the final 16 h of incubation in OSS. Cells were imaged in a confocal microscope. Selected regions indicated by the white rectangle are shown at a higher magnification, and areas of colocalization of mGFP-Ras with Alexa546 or RFP-labeled markers are indicated with arrows. Additional images are shown in supplemental Fig. S3.
To map the minimal OSS-responsive sequences in Ras, we analyzed the drug sensitivity of various mGFP-Ras anchor constructs. Low dose OSS mislocalized mGFP-CTK, mGFP-tK (mGFP with the minimal membrane anchor of K-Ras, residues 175–188), wild type mGFP-K-Ras, and to a lesser extent a CAAX box mutant mGFP-K-Ras CCIL that is geranylgeranylated, not farnesylated (supplemental Fig. S4a). In addition, mGFP-Rac1 and mGFP-Rap1, which both contain a geranylgeranylated polybasic domain were mislocalized by low dose OSS (supplemental Fig. S4c). Taken together these results suggest that the STS minimum recognition sequence for K-Ras is a prenylated polybasic domain. Analysis of mGFP-H-Ras and mGFP H-Ras anchor constructs showed that mGFP-CTH, mGFP-H-Ras, and mGFP-HG12V were equally sensitive to OSS; however, mGFP-tH (mGFP with the minimal membrane anchor of H-Ras, residues 179–189) did not mislocalize (supplemental Fig. S4b). mGFP-tH lacks the extended HVR sequence present in all other H-constructs (residues 166–178). The H-Ras HVR contains four basic amino acids that have been shown to participate in H-Ras PM interactions (25–27). Taken together these results strongly implicate electrostatic interactions between C-terminal basic residues in both the K-Ras and H-Ras HVR and PM anionic lipids as the basis of a common mechanism of action for STS.
Staurosporines Disrupt Cellular Phosphatidylserine Distribution
A major contributor to PM electrostatic potential is the anionic lipid phosphatidylserine (PS) that is asymmetrically and actively concentrated on the inner leaflet of the PM (28). Acute removal of PS from the inner PM and acute neutralization of PM electrostatic potential have been shown to result in rapid K-Ras mislocalization (9). Monitoring the subcellular distribution of PS in intact cells has recently become possible using mGFP-LactC2, an elegant well-characterized sensor that binds specifically to PS (9, 28, 29). To determine whether OSS disrupts the PM localization of PS, MDCK cells stably expressing mGFP-LactC2 were treated with 10 and 50 nm OSS for 48 h. Under these conditions the mGFP-LactC2, which is predominantly localized to the PM in control cells, significantly mislocalized from the PM to intracellular vesicles with the morphology of endosomes (Fig. 3a). We observed an identical redistribution of mCherry-LactC2 in cells co-expressing mGFP-KG12V or mGFP-HG12V (supplemental Fig. S5); thus the expression of Ras is not required for the action of OSS on PS distribution.
FIGURE 3.

Staurosporines reduce PS levels on the inner leaflet of the plasma membrane. a, MDCK cells expressing mGFP-LactC2, mRFP-KRΦ, or mGFP-Spo20 were treated with OSS for 48 h and imaged in a confocal microscope. The membrane targeting sequence of the mRFP-KRΦ charge probe is GKKFWKRLRKFLRKLKS. b, basal PM sheets were prepared from MDCK cells expressing mGFP-LactC2 and treated with OSS for 48 h. PM sheets were labeled with anti-GFP antibody conjugated to 4.5-nm gold particles. The graph shows the mean number of gold particles/μm2 (± S.E.). Differences between OSS-treated and control cells were assessed using one-way ANOVA tests. Significant differences are indicated (*, p < 0.05; ***, p < 0.001). c, spatial mapping of the gold-labeled PS distributions on the PM sheets was performed. The L(r) − r curve is a weighted mean K-function (n ≥ 15) where values above the 99% confidence interval (C.I.) for a random pattern indicate clustering at that value of r. Significant differences between the L(r) − r curves of OSS-treated and control cells were evaluated in bootstrap tests (*, p < 0.05; ***, p < 0.001). d, WT MDCK cells or MDCK cells stably expressing mGFP-KG12V were treated with OSS for 48 h and then incubated with CF647-conjugated annexin V. Annexin V-positive cells were counted in a cytometer. 10 μm camptothecin (CPT) for 16 h or 1 μm STS for 6 h were used as positive controls to induce apoptosis. Differences between OSS-treated and control cells were assessed using one-way ANOVA tests. Significant differences are indicated (***, p < 0.001). e and f, WT MDCK cells or MDCK cells stably expressing mGFP-KG12V were treated with OSS for 48 h and activated, cleaved caspase-3 was quantified by immunoblotting. 10 μm camptothecin or 1 μm STS for 6 h were used as positive controls to induce apoptosis. β-Actin was used as a loading control. Representative blots from three independent experiments are shown. g and h, MDCK cells stably co-expressing mGFP-KG12V and mCherry-CAAX or mGFP-LactC2 alone were treated with 50 nm OSS for 48 h (t = 0 min) and then incubated with 10 μm PS in the continued presence of OSS. Cells were fixed at indicated time points using 4% paraformaldehyde and imaged in a confocal microscope. Control cells were treated with DMSO only and then imaged. For MDCK KG12V cells, Ras translocation was quantified using Manders coefficients to measure the fraction of mCherry-CAAX co-localizing with mGFP-RasG12V after PS supplement. The dashed line represents Manders coefficient for control cells. Representative images of the GFP channel only are shown.
To directly quantify mGFP-LactC2 binding to the inner leaflet of PM, we prepared intact basal PM sheets from MDCK cells expressing mGFP-LactC2. The PM sheets were labeled with anti-GFP antibody conjugated to 4.5-nm gold particles and analyzed by electron microscopy (EM). Fig. 3b shows a dose-dependent reduction in anti-GFP immunogold labeling with OSS treatment, indicating a progressive loss of the mGFP-LactC2 probe from the inner leaflet of the PM. Together these experiments show that OSS induces a striking loss of PS from the inner PM. Spatial mapping of the PS distribution on the PM as visualized by the mGFP-LactC2 probe further revealed a dose-dependent decrease in the peak value of the L(r)-r clustering statistic, indicating a progressive reduction in the amount of nanoclustered PS that remained PM bound (Fig. 3c). By contrast, the subcellular distribution of mGFP-Spo20, a probe that binds specifically to a different anionic phospholipid, phosphatidic acid (30, 31), was unaffected by OSS (Fig. 3a). The EM and confocal analyses suggest that the PM is depopulated but not devoid of PS after OSS treatment in which case the PM electrostatic potential should be reduced but not eliminated. Consistent with this interpretation an electrostatic charge probe, mRFP-KRΦ, comprising a polybasic sequence of arginine and lysine interspersed with aromatic amino acids (11, 32), was not displaced from the PM of cells treated with OSS (Fig. 3a).
PS can be lost from the inner leaflet to the outer leaflet of the PM by dysregulating phospholipid transfer enzymes that maintain the asymmetric PS distribution (33, 34). Alternatively, PS may be retained in non-PM membranes as a result of perturbations to PS trafficking or endosomal lipid sorting. To discriminate between these possibilities, we performed an annexin V binding assay. Annexin V is a non-permeable PS-binding protein that only binds to cells when PS is displayed in the outer PM leaflet. Wild type or KG12V-transformed MDCK cells treated with OSS for 48 h were incubated with CF647-conjugated annexin V, and CF647-positive cells were counted using FACS. The experiment shows that concentrations of OSS that significantly mislocalized KG12V and mGFP-LactC2 did not result in any detectable PS externalization (Fig. 3d). By contrast, 1 μm STS or 10 μm camptothecin induced apoptosis, resulting in PM flippase failure and hence substantial annexin V positivity. Induction of apoptosis in cells treated with 1 μm STS or 10 μm camptothecin, but not low dose OSS, was verified by the appearance of cleaved caspase-3 (Fig. 3, e and f). Taken together, these data suggest that low dose OSS does not block PM flippases nor activate scramblases to cause externalization of PS but rather dysregulates PS intracellular trafficking, causing a redistribution of PS from the inner PM to endomembranes. Similar results were evident with low dose STS, UCN-01, and UCN-02 (supplemental Fig. S5c).
We next examined whether exogenous PS added back to OSS-treated cells could restore PM localization of KG12V. MDCK cells stably expressing mGFP-KG12V and mCherry-CAAX were treated with 50 nm OSS for 48 h followed by incubation with 10 μm PS in the continued presence of OSS. Cells were imaged by confocal microscopy, and the translocation of KG12V after PS supplementation was quantified by measuring the fraction of mCherry-CAAX co-localizing with mGFP-KG12V (Fig. 3, g and h). The data show that KG12V mislocalization by OSS treatment was rapidly corrected after 15 min of PS supplementation. The correction of KG12V localization was, however, transient. The fraction of KG12V co-localizing with mCherry-CAAX increased after 1 h, ultimately resulting in more extensive KG12V mislocalization than immediately before PS addition. Identical results were observed with mGFP-LactC2 (Fig. 3h). This time course strongly suggests that OSS blocks endosomal sorting/recycling of PS. Thus, delivery of exogenous PS to the outer leaflet is followed by the appearance of PS on the inner leaflet due to the action of PM flippases. The increased PS concentration on the inner leaflet rapidly restores KG12V PM binding on a time scale that matches the recently reported dynamics of PS delivery from the outer to the inner leaflet (35). The transient nature of the correction is consistent with the rapid internalization of PS by normal endocytic pathways (35) and the continued presence of OSS that blocks return of internalized PS to the PM. Exogenous PS, like endogenous PS, is therefore redistributed to endomembranes, restoring endomembrane mislocalization of KG12V and LactC2. However, PS concentration on endomembranes is now greater than before supplementation because cells have been loaded with PS, accounting for the observed enhanced mislocalization of KG12V and LactC2.
Staurosporines Enhance K-Ras Degradation
During automated imaging we noticed that 48-h incubations with STS, OSS, UCN-01, or UCN-02 reduced mGFP-KG12V image intensity consistent with a decrease in expression level (supplemental Fig. S6). A similar effect has been reported for S-trans, trans-farnesylthiosalicylic acid that displaces KG12V from the PM and enhances KG12V degradation (36). Therefore, we quantified expression levels of KG12V and HG12V. MDCK cells stably expressing mGFP-KG12V or mGFP-HG12V were treated with OSS for up to 16 days, and the total RasG12V levels were measured by immunoblotting. At 50 nm, OSS reduced the total KG12V level to ∼50% that of control after day 2, whereas 10 nm reduced the total KG12V to the same extent after longer exposure (Fig. 4, a and b). In contrast, HG12V levels were maximally reduced by ∼10–20% (Fig. 4c), indicating that KG12V is more sensitive to OSS-induced protein degradation than HG12V.
FIGURE 4.
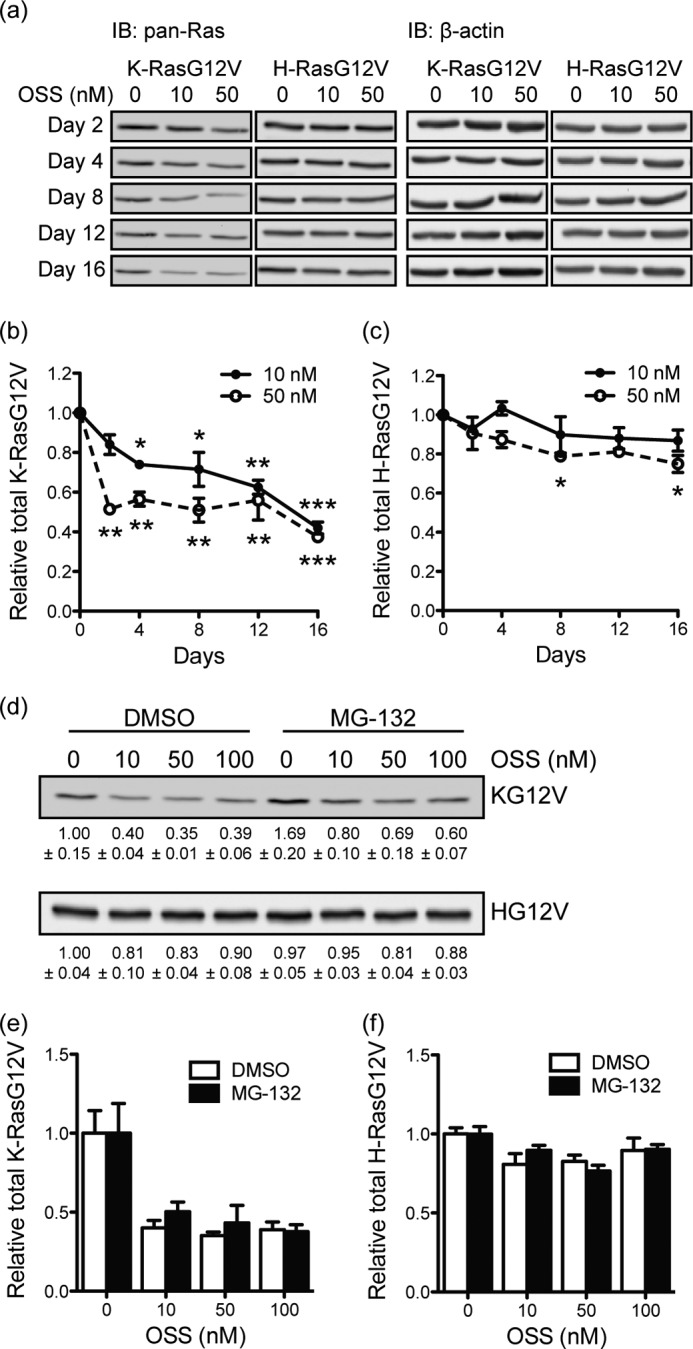
Staurosporines induce proteasomal-independent degradation of KG12V. a, MDCK cells stably expressing mGFP-KG12V or mGFP-HG12V were treated with OSS for 16 days. Growth media with OSS was replaced every 48 h. Cell lysates were immunoblotted (IB) with a pan-Ras antibody, and Ras levels were quantified. β-Actin was used as a loading control. A representative blot is shown. Mean mGFP-RasG12V levels ± S.E. from three independent experiments are shown (b and c). Differences between OSS-treated and control cells were assessed using one-way ANOVA tests. Significant differences are indicated (*, p < 0.05; **, p < 0.01; ***, p < 0.001). d, MDCK cells stably expressing mGFP-KG12V or mGFP-HG12V were treated with OSS with or without 500 nm MG-132 for 48 h. Growth media with fresh OSS ± MG-132 was replaced after 24 h. Cell lysates were immunoblotted with a pan-Ras antibody. Total RasG12V levels were quantified from the immunoblots and normalized to the cognate control (DMSO without MG-132). e and f, the graph shows data collected from three independent replicates of the experiment in d as mean ± S.E.
To investigate the role of the proteasome, MDCK cells stably expressing mGFP-KG12V or mGFP-HG12V were treated with MG-132, a proteasome inhibitor. Interestingly, mGFP-KG12V, but not mGFP-HG12V levels, were up-regulated in MG-132-treated control cells, suggesting that K-Ras, but not H-Ras levels, are tonically regulated by proteasomal degradation (Fig. 4d). However, mGFP-KG12V levels were still significantly reduced in cells co-treated with OSS and MG-132 (Fig. 4, e and f); indeed the -fold reduction in mGFP-KG12V levels was equivalent in MG-132-treated and untreated cells. Hence, we conclude that the mechanism whereby OSS induces KG12V degradation is proteasome-independent.
Next we fractionated mGFP-KG12V and mGFP-HG12V into P100 (membrane) and S100 (cytosolic) fractions; OSS reduced the level of both membrane-associated and cytosolic KG12V, but not HG12V, in a dose-dependent manner (Fig. 5, a–c). At low concentrations of OSS there was selective loss of P100 associated KG12V, but at higher concentrations S100 and P100 KG12V were lost equivalently. In parallel we used a Triton X-114 partitioning assay, which separates prenylated and unprenylated proteins based on the increased hydrophobicity due to the prenyl anchor (1, 37). OSS had no significant effect on the prenylated fraction of endogenous H-Ras or N-Ras (Fig. 5, d–f), excluding any role as an FTI. OSS treatment, however, did selectively reduce the levels of prenylated endogenous K-Ras by ∼30%. Taken together we conclude that there is preferential degradation of membrane-associated and, hence, prenylated K-Ras in OSS-treated cells. Time-course confocal microscopy also showed that KG12V mislocalization occurred after 3 h of exposure to OSS (supplemental Fig. S7), which given the ∼24-h half-life of processed K-Ras, confirms activity toward posttranslationally processed, not newly synthesized K-Ras.
FIGURE 5.

Staurosporines target membrane localized K-Ras. MDCK cells stably expressing mGFP-KG12V or mGFP-HG12V were treated with OSS for 48 h. Cell lysates were fractionated into P100 (membrane) and S100 (cytosolic) fractions, and RasG12V levels were measured by quantitative immunoblotting using a pan-Ras antibody. Whole cell lysates (WCL) were also used to measure total RasG12V levels. Representative blots from three independent experiments are shown in a and b. c, the mean membrane-bound fraction ± S.E. of KG12V was calculated as P100/(P100 + S100), and values are shown under the graph of total KG12V levels. d–f, MDCK cells were treated with OSS for 48 h and lysed in 1% Triton X-114, and lysates were partitioned into detergent-enriched (Det.) and aqueous (Aq.) phases by warming. After separation of the two phases by centrifugation, a 1× volume of the detergent-enriched phase containing hydrophobic proteins and a 2× volume of the aqueous phase containing hydrophilic proteins were blotted with Ras isoform-specific antibodies. A representative blot and mean percentages ± S.E. of the fraction of Ras in the detergent fraction (=prenylated Ras) for three independent experiments are shown. g, basal PM sheets were prepared from MDCK cells expressing mGFP-KG12V and treated with OSS for 48 h. PM sheets were labeled with anti-GFP antibody conjugated to 4.5-nm gold particles. The graph shows the mean number of gold particles/μm2 (± S.E.). Differences between OSS-treated and control cells were assessed using one-way ANOVA tests. Significant differences are indicated (*, p < 0.05; **, p < 0.01). h, spatial mapping of the gold-labeled mGFP-KG12V distribution was performed. The L(r) − r curve is a weighted mean K function (n ≥ 18) where values above the 99% confidence interval for a random pattern indicate clustering at that value of r. Significant differences between the L(r) − r curves of OSS-treated and control cells were evaluated in bootstrap tests (*, p < 0.05; ***, p < 0.001). C.I., confidence interval.
To specifically measure the PM level of KG12V, we prepared intact basal PM sheets from MDCK cells expressing mGFP-KG12V. The PM sheets were labeled with anti-GFP antibody conjugated to 4.5-nm gold particles and analyzed by EM. Fig. 5g shows a dose-dependent decrease of anti-GFP immunogold labeling with OSS treatment, indicating a loss of KG12V from the PM. Spatial mapping of the PM sheets further revealed a dose-dependent decrease in the peak value of the L(r)-r clustering statistic, indicating a progressive reduction in the amount of nanoclustered KG12V that remained PM bound (Fig. 5h). Careful inspection of this set of graphs in conjunction with the EM analysis of the PS distribution in Fig. 3 data also suggests that the initial reduction in PS levels on the PM induced by 10 nm OSS results in a substantial reduction both in KG12V levels and clustering but that further reductions in PS levels induced at higher OSS concentrations predominantly reduce the amount of nanoclustered KG12V on the PM. Together, these results suggest a dual role for PS in providing both membrane affinity for KG12V and a second role in facilitating the formation of KG12V nanoclusters. This is an important effect, because KG12V signal transmission is absolutely dependent on nanocluster formation (38).
Staurosporines Selectively Inhibit KG12V Signaling
Finally we examined the effect of STS and OSS on Ras signaling. Incubation in 1 nm STS and 10 nm OSS for 96 h significantly reduced the levels of ppERK and pAkt in KG12V-expressing but not HG12V-expressing MDCK cells (Fig. 6, a and b). This result is likely a direct consequence of the overall reduction of PM-localized K-Ras plus the markedly reduced nanoclustering of PM-localized K-Ras induced by these compounds (Fig. 5, g and h). Given this significant inhibition of KG12V signaling, we assayed cell growth. Fig. 6, c and d, shows that 10 nm OSS treatment significantly inhibited the proliferation of KG12V-transformed cells, whereas it modestly stimulated the proliferation of HG12V-transformed cells. These data confirm that low concentration OSS has specific inhibitory activity against oncogenic K-Ras but not H-Ras.
FIGURE 6.
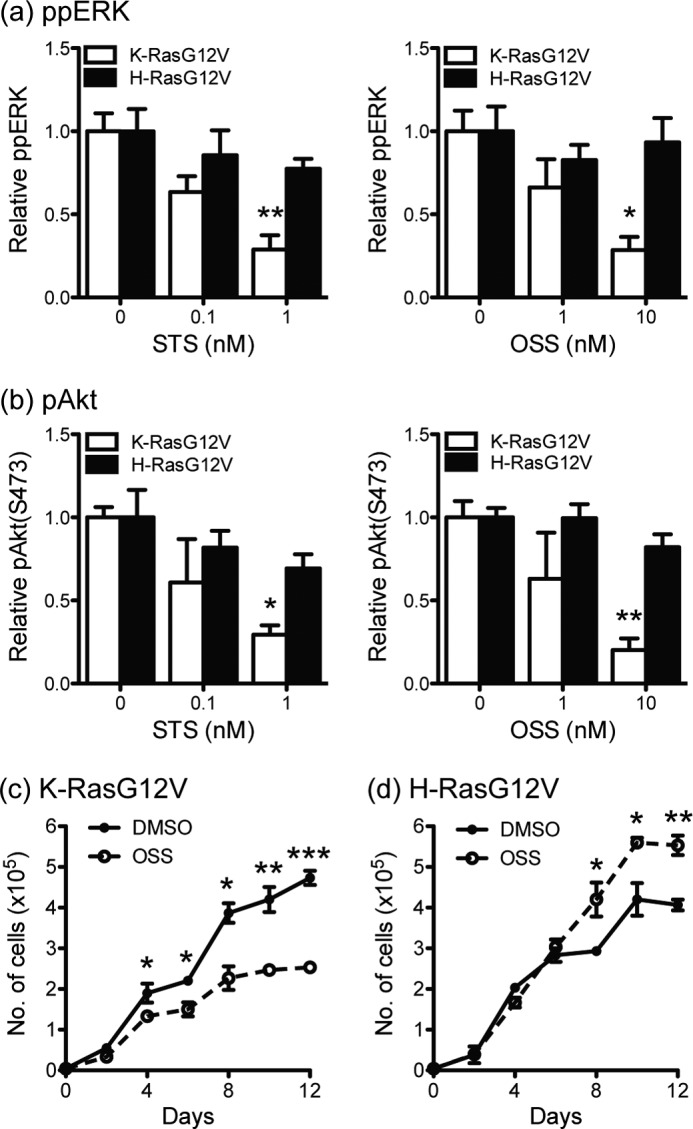
Staurosporines selectively inhibit KG12V signaling. MDCK cells stably expressing mGFP-KG12V or mGFP-HG12V were treated with OSS or STS for 96 h. ppERK (a) and pAkt(S473) (b) levels were measured by quantitative immunoblotting. The graphs show the mean ± S.E. for three independent experiments. Differences between drug-treated and control cells were assessed using one-way ANOVA tests. Significant differences are indicated (*, p < 0.05; **, p < 0.01). c and d, MDCK cells stably expressing mGFP-KG12V or mGFP-KG12V were treated with 10 nm OSS for 12 days. Growth media ± OSS were replaced every 48 h, and cell numbers were counted in a hemocytometer. Differences between OSS-treated and control cells were assessed using two-tailed t tests. Significant differences are indicated (*, p < 0.05; **, p < 0.01; ***, p < 0.001).
DISCUSSION
We used a high content assay to identify compounds that abrogate Ras PM binding. Using a talented library of microbial extracts, we identified STS and its co-metabolites, OSS, UCN-01, and UCN-02, as compounds that mislocalize K- and H-Ras from the PM. The efficacy of each compound, as measured by an EC50 for displacement of Ras from the PM, was 4–10-fold more potent on K-Ras than H-Ras. These compounds have known efficacy as PKC inhibitors, but we show here that the structure-activity relation of this set of STS analogs as PKC inhibitors bears no resemblance to the structure-activity relation as Ras PM inhibitors. Importantly the most potent analogs, STS and OSS, induced K-Ras mislocalization at drug concentrations 20 to 1000 times lower than are required to inhibit PKC or induce apoptosis, respectively. These and other data indicate that inhibition of Ras PM localization is a novel activity for staurosporines. We further show that the mechanism for STS-induced Ras mislocalization is a direct consequence of loss of PS from the inner leaflet of the PM. Confocal and EM imaging reveal that STS significantly reduces PS levels on the inner leaflet of the PM, and the efficacy of the STS analogs in PS mislocalization mirrored potencies in the K-Ras mislocalization assay, strongly suggesting that both effects are related. The extensive decoration of endosomes, mitochondria, the Golgi, and the ER by K-Ras in STS-treated cells is consistent with the recently reported intracellular distribution of PS (29), suggesting that mislocalized K-Ras has preferential affinity for PS-enriched membranes. We further show that STS does not dysregulate the aminophospholipid translocases that maintain the asymmetric distribution of PS on the inner PM leaflet but rather blocks the recycling of internalized PS. The exact target of OSS within the sorting/recycling machinery for PS requires further investigation. Whatever the precise molecular mechanism, STS is a new pharmacological tool that regulates PS levels on the inner PM without externalizing PS to the outer leaflet.
Active concentration of anionic phospholipids on the inner leaflet of the PM results in a strong, negative electrostatic potential that is important for proteins that use a polybasic domain for membrane affinity. PS is a major constituent of the inner leaflet, and acute loss of PS perturbs plasma membrane electrostatic potential resulting in K-Ras mislocalization (9). In addition to K-Ras, the polybasic targeted proteins mGFP-tK, Rap1, Rac1, and geranylgeranylated K-Ras all mislocalize from the PM after OSS treatment. In contrast, depletion of PS from the PM by OSS did not displace KRΦ; this differential response of mGFP-tK and KRΦ is perhaps surprising given the same number of positive charges on each peptide. Moreover, KRΦ and mGFP-tK lack a PS-specific binding epitope, and so a generalized reduction of the electrostatic potential (either by Ca2+ influx or removal of PS) will affect binding of both proteins. However, these polybasic peptides differ in their number of hydrophobic moieties and possibly their structure. In fact, we conservatively estimate, based on the Wimley and White scale (39), that the interface binding of the single Trp and two Phe residues on KRΦ will yield ∼4 kcal/mol gain in free energy. The water-membrane partition free energy for an isolated farnesyl chain is not known but will be <4 kcal/mol as the corresponding value for the -tH anchor, with three lipid chains, is only 13 kcal/mol (40). These considerations argue that the residual negative potential on the PM after OSS treatment is sufficient to complement the hydrophobic interactions of the three non-polar side chains in KRΦ but not the single farnesyl tail of mGFP-tK. Thus, because PM electrostatic potential is not completely neutralized by PS depopulation in response to STS treatment, there is selectivity for which polybasic proteins are retained or lost. Interestingly, K-Ras nanoclustering was also sensitive to PS levels on the PM, highlighting a coupling between lipid and protein sorting (41) which is consistent with the electrostatic lipid sorting ability of K-Ras nanoclusters (42). Loss of K-Ras nanoclusters is, therefore, an expected consequence of the accumulation of positive charges within K-Ras nanoclusters that will occur in the absence of sufficient numbers of neutralizing negatively charged lipids, leading to substantial peptide-peptide repulsion.
The effect of STS on H-Ras localization is intriguing. Although STS was less potent, the drug clearly mislocalized H-Ras, albeit primarily to the Golgi. One interpretation of this result is that H-Ras also requires a high concentration of PS on the plasma membrane for efficient retention. Although H-Ras high affinity PM binding is primarily provided by the triple-lipidated C-terminal anchor, there is clear evidence that H-Ras membrane anchoring is also regulated by multiple, mutually exclusive electrostatic interactions between basic residues in the HVR or helix α-4 of the G-domain and anionic lipids in the PM (25–27). Our new data might suggest that these interactions also play an as yet unappreciated role in contributing to H-Ras PM retention such that H-Ras equilibrium membrane distribution is shifted away from the PM to the Golgi as PM PS levels fall. Alternatively, the effect of STS may be mediated through H-Ras trafficking. PS on the recycling endosomes (RE) is important for protein trafficking between RE and the Golgi (43). The RE also plays an important role in the post-Golgi exocytic trafficking of H-Ras and N-Ras to the PM (44). Thus, disruption of PS trafficking by STS could alter PS content and function of the RE resulting in H-Ras accumulation in the Golgi.
Low concentrations of OSS around the EC50 for K-Ras mislocalization significantly inhibited K-Ras signaling and the cell growth of K-Ras-transformed cells but did not inhibit H-Ras signaling or the cell growth of H-Ras-transformed cells. These isoform differences may reflect the less extensive mislocalization of H-Ras to the Golgi from which is a normal site of H-Ras signaling, whereas K-Ras is mislocalized to endosomes that are not normal sites for K-Ras signaling. A further abrogation of K-Ras signaling would be expected both from the associated ∼50% reduction in K-Ras levels in OSS-treated cells and the marked reduction in K-Ras nanoclustering, as nanoclusters are the exclusive sites for Ras effector recruitment and activation (38, 45). Taken together these results validate the fundamental premise of this study that inhibitors of K-Ras PM binding and nanoscale organization will abrogate K-Ras signaling even if CAAX processing proceeds normally, thus highlighting the critical and specific role of PM binding for K-Ras function.
In summary, we have shown that STS and analogs exhibit a novel activity associated with perturbation of PS trafficking that reduces PS levels on the inner leaflet of the PM and severely compromises the plasma membrane localization of polybasic targeted Ras GTPases. Inhibitors of this phospholipid trafficking pathway may have potential as anti-Ras therapeutics.
Acknowledgments
We thank Mark Philips and Sergio Grinstein for gifts of key reagents.
This work was supported by the Cancer Prevention and Research Institute of Texas Grant RP100483 (to J. F. H.) and the Australian Research Council.

This article contains supplemental Figs. S1–S7.
- HVR
- hypervariable region
- PM
- plasma membrane
- FTI
- farnesyl transferase inhibitor
- MDCK
- Madin-Darby canine kidney
- STS
- staurosporine
- OSS
- 7-oxostaurosporine
- PS
- phosphatidylserine
- RE
- recycling endosome
- ER
- endoplasmic reticulum
- ANOVA
- analysis of variance
- mGFP
- monomeric Green Fluorescence Protein
- mRFP
- monomeric Red Fluorescence Protein
- mCherry
- monomeric Cherry.
REFERENCES
- 1. Hancock J. F. (2003) Ras proteins. Different signals from different locations. Nat. Rev. Mol. Cell Biol. 4, 373–384 [DOI] [PubMed] [Google Scholar]
- 2. Apolloni A., Prior I. A., Lindsay M., Parton R. G., Hancock J. F. (2000) H-ras but not K-ras traffics to the plasma membrane through the exocytic pathway. Mol. Cell Biol. 20, 2475–2487 [DOI] [PMC free article] [PubMed] [Google Scholar]
- 3. Choy E., Chiu V. K., Silletti J., Feoktistov M., Morimoto T., Michaelson D., Ivanov I. E., Philips M. R. (1999) Endomembrane trafficking of ras. The CAAX motif targets proteins to the ER and Golgi. Cell 98, 69–80 [DOI] [PubMed] [Google Scholar]
- 4. Rocks O., Peyker A., Kahms M., Verveer P. J., Koerner C., Lumbierres M., Kuhlmann J., Waldmann H., Wittinghofer A., Bastiaens P. I. (2005) An acylation cycle regulates localization and activity of palmitoylated Ras isoforms. Science 307, 1746–1752 [DOI] [PubMed] [Google Scholar]
- 5. Rocks O., Gerauer M., Vartak N., Koch S., Huang Z. P., Pechlivanis M., Kuhlmann J., Brunsveld L., Chandra A., Ellinger B., Waldmann H., Bastiaens P. I. (2010) The palmitoylation machinery is a spatially organizing system for peripheral membrane proteins. Cell 141, 458–471 [DOI] [PubMed] [Google Scholar]
- 6. Chen Z., Otto J. C., Bergo M. O., Young S. G., Casey P. J. (2000) The C-terminal polylysine region and methylation of K-Ras are critical for the interaction between K-Ras and microtubules. J. Biol. Chem. 275, 41251–41257 [DOI] [PubMed] [Google Scholar]
- 7. Thissen J. A., Gross J. M., Subramanian K., Meyer T., Casey P. J. (1997) Prenylation-dependent association of Ki-Ras with microtubules. Evidence for a role in subcellular trafficking. J. Biol. Chem. 272, 30362–30370 [DOI] [PubMed] [Google Scholar]
- 8. Wang G., Deschenes R. J. (2006) Plasma membrane localization of Ras requires class C Vps proteins and functional mitochondria in Saccharomyces cerevisiae. Mol. Cell Biol. 26, 3243–3255 [DOI] [PMC free article] [PubMed] [Google Scholar]
- 9. Yeung T., Gilbert G. E., Shi J., Silvius J., Kapus A., Grinstein S. (2008) Membrane phosphatidylserine regulates surface charge and protein localization. Science 319, 210–213 [DOI] [PubMed] [Google Scholar]
- 10. Okeley N. M., Gelb M. H. (2004) A designed probe for acidic phospholipids reveals the unique enriched anionic character of the cytosolic face of the mammalian plasma membrane. J. Biol. Chem. 279, 21833–21840 [DOI] [PubMed] [Google Scholar]
- 11. Roy M. O., Leventis R., Silvius J. R. (2000) Mutational and biochemical analysis of plasma membrane targeting mediated by the farnesylated, polybasic carboxyl terminus of K-ras4B. Biochemistry 39, 8298–8307 [DOI] [PubMed] [Google Scholar]
- 12. Bhagatji P., Leventis R., Rich R., Lin C. J., Silvius J. R. (2010) Multiple cellular proteins modulate the dynamics of K-ras association with the plasma membrane. Biophys. J. 99, 3327–3335 [DOI] [PMC free article] [PubMed] [Google Scholar]
- 13. Chandra A., Grecco H. E., Pisupati V., Perera D., Cassidy L., Skoulidis F., Ismail S. A., Hedberg C., Hanzal-Bayer M., Venkitaraman A. R., Wittinghofer A., Bastiaens P. I. (2012) The GDI-like solubilizing factor PDEδ sustains the spatial organization and signalling of Ras family proteins. Nat. Cell Biol. 14, 148–158 [DOI] [PubMed] [Google Scholar]
- 14. Ismail S. A., Chen Y. X., Rusinova A., Chandra A., Bierbaum M., Gremer L., Triola G., Waldmann H., Bastiaens P. I., Wittinghofer A. (2011) Arl2-GTP and Arl3-GTP regulate a GDI-like transport system for farnesylated cargo. Nat. Chem. Biol. 7, 942–949 [DOI] [PubMed] [Google Scholar]
- 15. Prior I. A., Lewis P. D., Mattos C. (2012) A comprehensive survey of Ras mutations in cancer. Cancer Res. 72, 2457–2467 [DOI] [PMC free article] [PubMed] [Google Scholar]
- 16. Baines A. T., Xu D., Der C. J. (2011) Inhibition of Ras for cancer treatment. The search continues. Future Med. Chem. 3, 1787–1808 [DOI] [PMC free article] [PubMed] [Google Scholar]
- 17. Willumsen B. M., Christensen A., Hubbert N. L., Papageorge A. G., Lowy D. R. (1984) The p21 ras C terminus is required for transformation and membrane association. Nature 310, 583–586 [DOI] [PubMed] [Google Scholar]
- 18. Whyte D. B., Kirschmeier P., Hockenberry T. N., Nunez-Oliva I., James L., Catino J. J., Bishop W. R., Pai J. K. (1997) K- and N-Ras are geranylgeranylated in cells treated with farnesyl protein transferase inhibitors. J. Biol. Chem. 272, 14459–14464 [DOI] [PubMed] [Google Scholar]
- 19. Cox A. D., Hisaka M. M., Buss J. E., Der C. J. (1992) Specific isoprenoid modification is required for function of normal, but not oncogenic, Ras protein. Mol. Cell. Biol. 12, 2606–2615 [DOI] [PMC free article] [PubMed] [Google Scholar]
- 20. Lu A., Tebar F., Alvarez-Moya B., López-Alcalá C., Calvo M., Enrich C., Agell N., Nakamura T., Matsuda M., Bachs O. (2009) A clathrin-dependent pathway leads to KRas signaling on late endosomes en route to lysosomes. J. Cell Biol. 184, 863–879 [DOI] [PMC free article] [PubMed] [Google Scholar]
- 21. Osada H., Koshino H., Kudo T., Onose R., Isono K. (1992) A new inhibitor of protein kinase C, RK-1409 (7-oxostaurosporine). I. Taxonomy and biological activity. J. Antibiot. 45, 189–194 [DOI] [PubMed] [Google Scholar]
- 22. Courage C., Budworth J., Gescher A. (1995) Comparison of ability of protein kinase C inhibitors to arrest cell growth and to alter cellular protein kinase C localization. Br J. Cancer 71, 697–704 [DOI] [PMC free article] [PubMed] [Google Scholar]
- 23. Seynaeve C. M., Kazanietz M. G., Blumberg P. M., Sausville E. A., Worland P. J. (1994) Differential inhibition of protein kinase C isozymes by UCN-01, a staurosporine analogue. Mol. Pharmacol. 45, 1207–1214 [PubMed] [Google Scholar]
- 24. Bivona T. G., Quatela S. E., Bodemann B. O., Ahearn I. M., Soskis M. J., Mor A., Miura J., Wiener H. H., Wright L., Saba S. G., Yim D., Fein A., Pérez de Castro I., Li C., Thompson C. B., Cox A. D., Philips M. R. (2006) PKC regulates a farnesyl-electrostatic switch on K-Ras that promotes its association with Bcl-XL on mitochondria and induces apoptosis. Mol. Cell 21, 481–493 [DOI] [PubMed] [Google Scholar]
- 25. Abankwa D., Gorfe A. A., Inder K., Hancock J. F. (2010) Ras membrane orientation and nanodomain localization generate isoform diversity. Proc. Natl. Acad. Sci. U.S.A. 107, 1130–1135 [DOI] [PMC free article] [PubMed] [Google Scholar]
- 26. Abankwa D., Hanzal-Bayer M., Ariotti N., Plowman S. J., Gorfe A. A., Parton R. G., McCammon J. A., Hancock J. F. (2008) A novel switch region regulates H-ras membrane orientation and signal output. EMBO J. 27, 727–735 [DOI] [PMC free article] [PubMed] [Google Scholar]
- 27. Gorfe A. A., Babakhani A., McCammon J. A. (2007) H-ras protein in a bilayer. Interaction and structure perturbation. J. Am. Chem. Soc. 129, 12280–12286 [DOI] [PMC free article] [PubMed] [Google Scholar]
- 28. Leventis P. A., Grinstein S. (2010) The distribution and function of phosphatidylserine in cellular membranes. Annu. Rev. Biophys. 39, 407–427 [DOI] [PubMed] [Google Scholar]
- 29. Fairn G. D., Schieber N. L., Ariotti N., Murphy S., Kuerschner L., Webb R. I., Grinstein S., Parton R. G. (2011) High resolution mapping reveals topologically distinct cellular pools of phosphatidylserine. J. Cell Biol. 194, 257–275 [DOI] [PMC free article] [PubMed] [Google Scholar]
- 30. Zeniou-Meyer M., Zabari N., Ashery U., Chasserot-Golaz S., Haeberlé A. M., Demais V., Bailly Y., Gottfried I., Nakanishi H., Neiman A. M., Du G., Frohman M. A., Bader M. F., Vitale N. (2007) Phospholipase D1 production of phosphatidic acid at the plasma membrane promotes exocytosis of large dense-core granules at a late stage. J. Biol. Chem. 282, 21746–21757 [DOI] [PubMed] [Google Scholar]
- 31. Ariotti N., Liang H., Xu Y., Zhang Y., Yonekubo Y., Inder K., Du G., Parton R. G., Hancock J. F., Plowman S. J. (2010) Epidermal growth factor receptor activation remodels the plasma membrane lipid environment to induce nanocluster formation. Mol. Cell. Biol. 30, 3795–3804 [DOI] [PMC free article] [PubMed] [Google Scholar]
- 32. Yeung T., Terebiznik M., Yu L., Silvius J., Abidi W. M., Philips M., Levine T., Kapus A., Grinstein S. (2006) Receptor activation alters inner surface potential during phagocytosis. Science 313, 347–351 [DOI] [PubMed] [Google Scholar]
- 33. Holthuis J. C., Levine T. P. (2005) Lipid traffic. Floppy drives and a superhighway. Nat. Rev. Mol. Cell Biol. 6, 209–220 [DOI] [PubMed] [Google Scholar]
- 34. Daleke D. L. (2007) Phospholipid flippases. J. Biol. Chem. 282, 821–825 [DOI] [PubMed] [Google Scholar]
- 35. Kay J. G., Koivusalo M., Ma X., Wohland T., Grinstein S. (2012) Phosphatidylserine dynamics in cellular membranes. Mol. Biol. Cell 23, 2198–2212 [DOI] [PMC free article] [PubMed] [Google Scholar]
- 36. Elad G., Paz A., Haklai R., Marciano D., Cox A., Kloog Y. (1999) Targeting of K-Ras 4B by S-trans, trans-farnesyl thiosalicylic acid. Biochim. Biophys. Acta 1452, 228–242 [DOI] [PubMed] [Google Scholar]
- 37. Hancock J. F. (1995) Prenylation and palmitoylation analysis. Methods Enzymol. 255, 237–245 [DOI] [PubMed] [Google Scholar]
- 38. Tian T., Harding A., Inder K., Plowman S., Parton R. G., Hancock J. F. (2007) Plasma membrane nanoswitches generate high fidelity Ras signal transduction. Nat. Cell Biol. 9, 905–914 [DOI] [PubMed] [Google Scholar]
- 39. Wimley W. C., White S. H. (1996) Experimentally determined hydrophobicity scale for proteins at membrane interfaces. Nat. Struct. Biol. 3, 842–848 [DOI] [PubMed] [Google Scholar]
- 40. Gorfe A. A., Baron R., McCammon J. A. (2008) Water-membrane partition thermodynamics of an amphiphilic lipopeptide. An enthalpy-driven hydrophobic effect. Biophys. J. 95, 3269–3277 [DOI] [PMC free article] [PubMed] [Google Scholar]
- 41. Janosi L., Gorfe A. A. (2010) Segregation of negatively charged phospholipids by the polycationic and farnesylated membrane anchor of Kras. Biophys. J. 99, 3666–3674 [DOI] [PMC free article] [PubMed] [Google Scholar]
- 42. Weise K., Kapoor S., Denter C., Nikolaus J., Opitz N., Koch S., Triola G., Herrmann A., Waldmann H., Winter R. (2011) Membrane-mediated induction and sorting of K-Ras microdomain signaling platforms. J. Am. Chem. Soc. 133, 880–887 [DOI] [PubMed] [Google Scholar]
- 43. Uchida Y., Hasegawa J., Chinnapen D., Inoue T., Okazaki S., Kato R., Wakatsuki S., Misaki R., Koike M., Uchiyama Y., Iemura S., Natsume T., Kuwahara R., Nakagawa T., Nishikawa K., Mukai K., Miyoshi E., Taniguchi N., Sheff D., Lencer W. I., Taguchi T., Arai H. (2011) Intracellular phosphatidylserine is essential for retrograde membrane traffic through endosomes. Proc. Natl. Acad. Sci. U.S.A. 108, 15846–15851 [DOI] [PMC free article] [PubMed] [Google Scholar]
- 44. Misaki R., Morimatsu M., Uemura T., Waguri S., Miyoshi E., Taniguchi N., Matsuda M., Taguchi T. (2010) Palmitoylated Ras proteins traffic through recycling endosomes to the plasma membrane during exocytosis. J. Cell Biol. 191, 23–29 [DOI] [PMC free article] [PubMed] [Google Scholar]
- 45. Kholodenko B. N., Hancock J. F., Kolch W. (2010) Signalling ballet in space and time. Nat. Rev. Mol. Cell Biol. 11, 414–426 [DOI] [PMC free article] [PubMed] [Google Scholar]
- 46. Prior I. A., Muncke C., Parton R. G., Hancock J. F. (2003) Direct visualization of Ras proteins in spatially distinct cell surface microdomains. J. Cell Biol. 160, 165–170 [DOI] [PMC free article] [PubMed] [Google Scholar]
- 47. Rotblat B., Prior I. A., Muncke C., Parton R. G., Kloog Y., Henis Y. I., Hancock J. F. (2004) Three separable domains regulate GTP-dependent association of H-ras with the plasma membrane. Mol. Cell. Biol. 24, 6799–6810 [DOI] [PMC free article] [PubMed] [Google Scholar]
- 48. Fong-ngern K., Chiangjong W., Thongboonkerd V. (2009) Peeling as a novel, simple, and effective method for isolation of apical membrane from intact polarized epithelial cells. Anal. Biochem. 395, 25–32 [DOI] [PubMed] [Google Scholar]
- 49. Hancock J. F., Prior I. A. (2005) Electron microscopic imaging of Ras signaling domains. Methods 37, 165–172 [DOI] [PMC free article] [PubMed] [Google Scholar]
- 50. Plowman S. J., Muncke C., Parton R. G., Hancock J. F. (2005) H-ras, K-ras, and inner plasma membrane raft proteins operate in nanoclusters with differential dependence on the actin cytoskeleton. Proc. Natl. Acad. Sci. U.S.A. 102, 15500–15505 [DOI] [PMC free article] [PubMed] [Google Scholar]