

Abstract
We have previously demonstrated amelioration of Huntington's disease (HD)-related phenotypes in R6/2 transgenic mice in response to treatment with the novel histone deacetylase (HDAC) inhibitor 4b. Here we have measured the selectivity profiles of 4b and related compounds against class I and class II HDACs and have tested their ability to restore altered expression of genes related to HD pathology in mice and to rescue disease effects in cell culture and Drosophila models of HD. R6/2 transgenic and wild-type (wt) mice received daily injections of HDAC inhibitors for 3 days followed by real-time PCR analysis to detect expression differences for 13 HD-related genes. We find that HDACi 4b and 136, two compounds showing high potency for inhibiting HDAC3 were most effective in reversing the expression of genes relevant to HD, including Ppp1r1b, which encodes DARPP-32, a marker for medium spiny striatal neurons. In contrast, compounds targeting HDAC1 were less effective at correcting gene expression abnormalities in R6/2 transgenic mice, but did cause significant increases in the expression of selected genes. An additional panel of 4b-related compounds was tested in a Drosophila model of HD and in STHdhQ111 striatal cells to further distinguish HDAC selectivity. Significant improvement in huntingtin-elicited Drosophila eye neurodegeneration in the fly was observed in response to treatment with compounds targeting human HDAC1 and/or HDAC3. In STHdhQ111 striatal cells, the ability of HDAC inhibitors to improve Htt-elicited metabolic deficits correlated with the potency at inhibiting HDAC1 and HDAC3, although the IC50 values for HDAC1 inhibition were typically 10-fold higher than for inhibition of HDAC3. Assessment of HDAC protein localization in brain tissue by Western blot analysis revealed accumulation of HDAC1 and HDAC3 in the nucleus of HD transgenic mice compared to wt mice, with a concurrent decrease in cytoplasmic localization, suggesting that these HDACs contribute to a repressive chromatin environment in HD. No differences were detected in the localization of HDAC2, HDAC4 or HDAC7. These results suggest that inhibition of HDACs 1 and 3 can relieve HD-like phenotypes in model systems and that HDAC inhibitors targeting these isotypes might show therapeutic benefit in human HD.
Keywords: neurodegenerative, striatum, disease, epigenetic, therapeutic, chromatin, gene expression
Introduction
Novel treatment strategies for neurodegenerative disorders have included histone deacetylase (HDAC) inhibitors, which act to modify gene expression (Morrison et al., 2007; Abel and Zukin, 2008; Hahnen et al., 2008; Kazantsev and Thompson, 2008; Marsh et al., 2008). This is especially the case for Huntington's disease (HD), a devastating neurodegenerative disorder caused by a CAG repeat expansion within the coding region of the HTT gene (Group, 1993). HD has been associated with transcriptional abnormalities on several levels (Steffan et al., 2001; Freiman and Tjian, 2002; Okazawa, 2003; Sugars and Rubinsztein, 2003; Ferrante et al., 2004; Zhai et al., 2005; Ryu et al., 2006; Thomas, 2006; Sadri-Vakili et al., 2007; Stack et al., 2007), hence, HDAC inhibitors as potential therapies for this disease have gained considerable attention in recent years. An important question for HDAC inhibitor therapeutics, however, is which HDAC enzyme(s) is/are important for disease phenotype amelioration in HD. The HDACs comprise a large family of proteins, with 18 HDAC enzymes currently having been identified in humans (Xu et al., 2007). The HDAC enzymes have been divided into distinct groups: class I consists of HDACs 1, 2, 3 and 8. Class II HDACs are further distinguished into two groups: class IIa, consisting of HDACs 4, 5, 7 and 9, and class IIb, consisting of HDACs 6 and 10 (Xu et al., 2007). Class II enzymes share significant sequence and structural homology and, like class I HDACs, require Zn2+ for catalytic activity. Members of a third class of HDACs, called the “sirtuins”, are distinct from classes I and II and require NAD+ for their enzymatic activity (Blander and Guarente, 2004). Finally, class IV is represented by a single member, HDAC11(Gao et al., 2002).
Non-selective HDAC inhibitors, such as SAHA, phenylbutyrate and sodium butyrate have been shown to be beneficial in cell (McCampbell et al., 2001; Nucifora et al., 2001), Drosophila (Steffan et al., 2001) and mouse models of HD (Ferrante et al., 2003; Hockly et al., 2003; Gardian et al., 2005); however, their clinical use for neurodegenerative disorders is limited by toxicity. Therefore, developing selective HDAC inhibitors to target the relevant HDACs in HD is essential for these compounds to move forward for human therapeutics. Our previous studies have shown beneficial effects of a novel HDAC inhibitor, HDACi 4b, in R6/2 mice, by ameliorating motor and behavioral symptoms and correcting transcriptional abnormalities associated with mutant huntingtin (Htt) protein, without conferring toxic effects (Thomas et al., 2008); however, the HDAC targets of this compound have not been previously reported.
In the current study, we show that HDACi 4b preferentially inhibits HDAC3, followed by HDAC1, in agreement with studies on structurally related compounds (Chou et al., 2008; Xu et al., 2009). In light of these properties, a library of 4b-related compounds have been synthesized and were tested for their ability to ameliorate Htt-elicited phenotypes in fly, cell and mouse models of HD in this study. Our findings demonstrate that class I HDAC inhibitors are effective in suppressing HD pathogenic symptoms in various HD models with HDAC3-selective compounds exhibiting some of the strongest effects. We further find that challenge with mutant Htt selectively causes HDACs 1 and 3 to accumulate in the nucleus, providing rationale for the efficacy of these novel HDAC inhibitors in HD models. The implications for therapeutics in HD are discussed
Materials and Methods
IC50 determinations for HDAC inhibitors
Serial dilutions of HDAC inhibitors were prepared in HDAC assay buffer (50 mM Tris/HCl, 137 mM NaCl, 2.7 mM KC1, 1 mM MgCl2, pH 8.0, 100 μg/mL BSA) and pre-incubated for 2 hours at ambient temperature with purified HDAC1 (BPS Biosciences, 50051), HDAC2 (BPS Biosciences, 50053), or HDAC3/NcoR2 (BPS Biosciences, 50003) at concentrations of 4.5, 2, or 0.6 μg/mL, respectively in 96-well assay plates (Fisher scientific, 07-200-309). Following pre-incubation, Fluor-de-Lys™ substrate (Enzo Life Sciences, BML-KI104-0050) was added to a final concentration of 10 μM and plates were further incubated for 30 minutes at ambient temperature. Trichostatin A (Sigma-Aldrich, T8552) and trypsin (MP Biomedicals, 02101179) were added at final concentrations of 100nM and 100μg/mL to respectively halt deacetylation and liberate the fluor from the deacetylated substrate. Following a 15 min incubation at ambient temperature, fluorescence at 460nm was measured in a Spectromax M2 fluorometer (Molecular Devices) with excitation at 365nm and IC50 values were determined using GraphPad Prism® 5 software. The compounds were tested for inhibition of Class II HDAC isoforms at Reaction Biology (Malvern, PA) using proprietary protocols
Mice and Drug injections
An R6/2 line of the CBA × C57BL/6 strain origin (Jackson Laboratories, Bar Harbor, ME) (Mangiarini et al., 1996) has been maintained at The Scripps Research Institute by breeding male heterozygous R6/2 mice with F1 hybrids of the same background. Transgenic N171-82Q HD mice were maintained by breeding heterozygous N171-82Q males with C3B6F1 females (Jackson Laboratories, Bar Harbor, ME). At the age of 4 weeks, mice were genotyped according to the Jackson Laboratories protocol to determine hemizygosity for the HD transgene. The CAG repeat lengths in these mice were verified by commercial genotyping (Laragen, Los Angeles, CA) and found to be 125 ± 5 CAGs in the R6/2 mice and 82 ± 1 CAGs in the N1 171-82Q mice. The lifespan of this R6/2 mouse colony is approximately 12-14 weeks, with HD-like phenotypes evident from 8 weeks of age. The lifespan of the N171-82Q HD is ∼17-20 weeks with HD-like symptoms beginning at 10-12 weeks of age. Groups of R6/2 transgenic mice (n=4 per genotype and drug condition) were injected s.c. with HDAC inhibitors (150 mg/kg/day) or an equal amount of vehicle (50:50, DMSO: PBS) once a day for three days. Mice were sacrificed 6 hrs after the final injection and brains removed for gene expression measurements. All procedures were in strict accordance with the National Institutes of Health Guidelines for the Care and Use of Laboratory Animals.
Real-Time PCR Analysis
Real-time PCR experiments were performed using the ABI PRISMs 7900HT Sequence Detection System (Applied Biosystems, Foster City, CA) as described previously (Desplats et al., 2006). Amplification was performed on a cDNA amount equivalent to 25 ng total RNA with 1 × SYBR® Green universal PCR Master mix (Applied Biosystems) containing deoxyribonucleotide triphosphates, MgCl2, AmpliTaq Gold DNA polymerase, and forward and reverse primers. PCR reactions were performed on two independent sets of template (n= 4 mice per condition). Specific primers for each sequence were designed using Primer Express 1.5 software and their specificity for binding to the desired sequence was searched against NCBI database (Supp. Table 1). Standard curves were generated for each gene of interest using serial dilutions of mouse cDNAs. Experimental samples and no-template controls were all run in duplicate. The PCR cycling parameters were: 50°C for 2 min, 95°C for 10 min, and 40 cycles of 94°C for 15 s, 60°C for 1 min. The amount of cDNA in each sample was calculated using SDS2.1 software by the comparative threshold cycle (Ct) method and expressed as 2exp(Ct) using hypoxanthine guanine phosphoribosyl transferase (Hprt) as an internal control. One-way ANOVAs with Bonferroni post-tests for multiple comparisons followed by Student's t test for determination of exact p-values were used to determined significant effects of HDAC inhibitors on gene expression levels in wt and R6/2 transgenic mice. All statistical tests were performed using GraphPad software (GraphPad Prism, San Diego, CA).
Western blotting for HDAC Expression
Levels of HDAC 1, 2, 3, 4 and 7 were determined by Western blotting. Nuclear and cytosolic fractions were prepared separately from cortical tissue. Samples were homogenized in nuclear extraction buffer (0.32 M sucrose, 4 mM HEPES) with protease inhibitor cocktail (Roche) and then centrifuged at 800g for 15 min. The supernatant was kept at −80°C and designated as the cytoplasmic fraction. The pellet was incubated for 2 hours with nuclear extraction buffer containing 0.5% NP-40, then homogenized a second time followed by centrifugation at 800g for 15 min. The pellet was kept at −80°C and designated as the nuclear fraction. The cytosolic and nuclear fractions were evaluated by the BCA protein assay (Pierce) to ensure equal loading. Protein aliquots were subjected to 4-12% SDS-PAGE and transferred onto nitrocellulose membranes using standard methods. Membranes were blocked with 5% nonfat milk in TBS-T (20 mM Tris, 500 mM NaCl, and 0.1% Tween 20) and incubated overnight at 4 °C with the following primary polyclonal rabbit antibodies (Abcam): anti-HDAC1 (1:5000), anti-HDAC3 (1:5000), anti-HDAC2 (1:2000), anti-HDAC4 (1:2000), anti-HDAC5 (1:2000), anti-HDAC7 (1:2000) and polyclonal rabbit antibody against beta actin (1:2000) or histone H3 (1:5000) in blocking solution. After washing with TBS-T 3 times for 5 min each, membranes were incubated with horseradish-peroxidase-conjugated secondary antibodies (goat anti-rabbit 1:2000 for HDAC2, HDAC4, HDAC5, HDAC7, 1:5000 goat anti-rabbit for HDAC1, HDAC3, beta-actin and histone H3 in blocking solution at room temperature for 1–2 h. Chemiluminescent signals were visualized using Western blotting luminol reagent (Pierce) and exposed to X-ray film.
Neurodegeneration Rescue in HD flies
Drosophila melanogaster flies expressing N-terminal Htt fragments (N-ter Htt) (i.e. human Htt exon1 (Httex1)) were treated with HDAC inhibitors as described previously (Steffan et al., 2001). UAS-Httex1p Q93 flies were mated to elav > Gal4 at 25 °C, and the freshly eclosed polyQ-expressing females transferred to vials containing standard Drosophila medium supplemented with an HDAC inhibitor or vehicle (DMSO). Flies were transferred to fresh food every day and assayed for neurodegeneration at 7 days post eclosion by using the pseudopupil technique (1). At least 30 ommatidia in 4–8 flies were scored by blinded reviewers, and the average number of rhabdomeres per ommatidium was calculated for each fly. Two independent trials were conducted. Significance of the difference from the no compound (DMSO) control was evaluated using One-way ANOVA, followed by Dunnett's post-test.
Cell Proliferation Inhibition Assays
Hct1 16 cells (human colorectal carcinoma cells) or IMR90 cells (human lung fibroblast cells) (5000 cells/well) were grown in 80 mL McCoy's 5A medium containing 10% v/v FBS, 1% v/v penicillin/streptomycin and 1% v/v L-glutamine (5% CO2 atmosphere). Cells were incubated in 96-well plates with compounds at various concentrations for 72h at 37°C. The compound dilutions were made in 100% DMSO followed by parallel dilutions in media. The final concentration of DMSO in each well was 0.05%. After 72h, 20 mL of Cell titer 96 aqueous one solution (Promega Corporation, Madison, WI) were added to the cells and the plate was incubated at 37°C for another 4h. The absorbance at 490 nm was then recorded on a 96-well plate reader (Spectramax M2, Molecular Devices, Sunnyvale, CA). Data analysis was performed in Microsoft Excel (Microsoft Corp, Redmond, WA).((O.D. sample – average O.D. positive control)/(average O.D negative control - average O.D. positive control))* 100, where O.D. is the measured absorbance, O.D. positive control is the absorbance from cells incubated with trichostatin A at 5 mM and O.D. negative control is the absorbance measured from cells incubated without any compound, was plotted against compound concentration and an IC50 was determined by graphical interpolation of the concentration required for 50% inhibition of cell growth.
XTT Assays in Striatal cells
STHdhQ111 striatal cells were plated at 2×l05 cells/well in a 24 well plates containing DMEM media supplemented with 10% FBS, 100μg/ml penicillin, 100μg/ml streptomycin and kept at 33°C with 5% CO2. After 16-18hrs, cells were washed once with PBS and incubated with different dilutions of the compound in triplicate in DMEM supplemented with 0.5% FBS (heat inactivated) and shifted to 39°C. XTT assays (Sigma Aldrich # X4251) were performed at 24 and 48 hrs after shifting the cells to 39°C by adding the XTT reagent, followed by absorbance readings at 450 nm.
Results
Selectivity profiles for novel HDAC inhibitors
Our previous studies showed that the novel HDAC inhibitor, HDACi 4b, ameliorated motor and behavioral symptoms associated with disease progression in R6/2 transgenic mice and corrected transcriptional abnormalities associated with mutant Htt protein in the mouse brain (Thomas et al., 2008). We tested the HDAC inhibitory properties of HDACi 4b against different recombinant HDAC enzymes in cell-free assays and found that, unlike the nonselective HDAC inhibitor, SAHA, HDACi 4b, showed a ∼3-, ∼25-, and ∼72-fold selectivity for HDAC3 over HDACs 1, 2 and 8, respectively, and essentially no activity against the class II HDACs, HDAC 4, 5 and 7 (Table 1). Fmportantly, the EC50 for inhibition of proliferation of Hct1 16 cells was 10 μM, nearly 100-fold higher than the IC50 for inhibition of HDACs 1 and 3. A library of novel o-aminobenzamide-type HDAC inhibitors was synthesized based on the structure of HDACi 4b and tested for HDAC inhibitory properties. These compounds showed similar HDAC inhibitory profiles as 4b in their lack of activity against class II HDACs and HDAC8, but displayed varying potencies for inhibition of HDACs 1, 2 and 3 (Tables 1 and 2, Suppl. Table 2). Compounds were also tested for cytostatic activity in proliferation inhibition assays in Hct1 16 or IMR90 cells. Similar to HDACi 4b, we find that the cytostatic activity of these compounds IC50 was in the micromolar range, whereby inhibition of relevant HDACs typically occurred at 10-100-fold lower concentrations.
Table 1.
HDAC subtype selectivity profiles for the HDAC inhibitors tested in qPCR analysis (plus SAHA as a reference).
| IC50 for Class I HDAC enzymes: | IC50 for Class II HDAC enzymes: | Selectivity: | Proliferation inhibition Hct116, IC50: | Proliferation inhibition IMR90, IC50: | |||||||
|---|---|---|---|---|---|---|---|---|---|---|---|
| Compound | Structure | HDAC1 | HDAC2 | HDAC3 | HDAC8 | HDAC4 | HDAC5 | HDAC7 | |||
| 4b |
|
199 nM | 1.59 μM | 69 nM | 5μM | >180 μM | >180 μM | >180 μM | HDAC1/3 | 10 μM | ND |
| 109 |
|
300 nM | 1.28 μM | 63 nM | 10.7 μM | >180 μM | >180 μM | >180 μM | HDAC1/3 | 6.5 μM | 50 μM |
| 13S |
|
5.2 μM | 3.0 μM | 400 nM | 13.2 μM | >180 μM | >180 μM | >180 μM | HDAC3 | 40 μM | >50 μM |
| 228 |
|
61 nM | 314 nM | 3 33 μM | >100 μM | >180 μM | >180 μM | >180 μM | HDAC1 | 1 8 μM | ND |
| SAHA* |
|
171 nM | 389 nM | 200 nM | 306 nM | 282 nM | 400 nM | 510 nM | NS | 1.0 μM | 1.0 μM |
HDACs 6, 9, and 10 were not tested.
IC50 values for SAHA taken from Reaction Biology Corp (www.reactionbiology.com)
NS, non-selective. ND, not determined.
Table 2. Compounds tested for metabolic improvement in mutant STHdh striatal cells.
| ID# | HDAC1 IC50 (μM) | HDAC2 IC50 (μM) | HDAC3 IC50 (μM) | HDAC3 vs. HDAC1 selectivity | BPR | CYP3A4 IC50 (μM) | CYP2D6 IC50 (μM) | MEC: |
|---|---|---|---|---|---|---|---|---|
| 874 | 0.090 | 0.893 | 0.032 | 2.81 | 0.55 | 3.17 | >10 | 0.5 μM |
| 968 | 0.095 | 0.552 | 0.052 | 1.83 | 0.42 | 7.14 | >10 | 0.5 μM |
| 963 | 0.118 | 0.557 | 0.055 | 2.15 | 0.90 | 5.23 | >10 | 0.3 μM |
| 1016 | 0.282 | ND | 0.065 | 4.34 | 0.46 | 5.99 | >10 | 1 μM |
| 4b | 0.199 | 1.590 | 0.069 | 2.88 | 0.45 | >10 | >10 | 0.5 μM |
| 1029 | 0.155 | ND | 0.070 | 2.21 | 0.10 | 1.02 | >10 | 0.1 μM |
| 1006 | 1.759 | 3.538 | 0.086 | 20.45 | 0.45 | >10 | >10 | 1 μM |
| 1009 | 0.115 | 0.886 | 0.087 | 1.32 | 0.18 | 2.67 | >10 | 1 μM |
| 974 | 0.065 | 0.472 | 0.094 | 0.69 4 | ^91 | 4.67 | >10 | 0.5 μM |
| 1022 | 0.110 | ND | 0.103 | 1.07 | W36 | 12.46 | >10 | 0.1 μM |
| MS275 | 0.036 | 0.219 | 0.115 | 0.31 | 0.06 | 7.39 | >10 | 1 μM |
| 941 | 0.029 | 0.360 | 0.117 | 0.25 | 0.64 | 6.57 | >10 | 0.1 μM |
| 983 | 0.735 | 1.940 | 0.126 | 5.83 | 0.74 | >10 | >10 | 1 μM |
| 971 | 0.932 | 1.779 | 0.148 | 6.30 | 0.31 | >10 | >10 | 3 μM |
| 970 | 0.643 | 2.108 | 0.2/2y | 2.90 | 0.50 | >10 | >10 | 3 μM |
| 1030 | 1.721 | ND | 0.259 | 6.64 | 0.70 | 5.15 | ND | 3 μM |
| 996 | 3.208 | 5.538 | 0.284 | 11.30 | 0.23 | >10 | >10 | 3 μM |
| 991 | 3.636 | 3.657 | 0.344 | 10.57 | 0.72 | >10 | >10 | 3 μM |
| 993 | 14.470 | 19.710 | 0.386 | 37.51 | 0.54 | 2.70 | >10 | 3 μM |
| 136 | 5.200 | 3.000 | 0.400 | 13.00 | 0.25 | 10 | >10 | 1 μM |
| 998 | 0.425 | 1.362 | 0.718 | 0.59 | 0.67 | 1.80 | >10 | 1 μM |
| 233* | 0.008 | 0.070 | 2.096 | 0.00 | 0.00 | 0.11 | >10 | 0.5 μM |
| 934 | >30 | >30 | >30 | N/A | 0.00 | 6.43 | >10 | NE |
BPR, brain to plasma ratio; CYP3A4 and CYP2D6 denote the IC50 values for inhibition of cytochrome P450 enzymes in liver cells.
MEC, minimum effective concentration.
only effective at 24 hrs, not 48 hrs.
Gene expression studies in R6/2 transgenic mice
Given that 4b inhibits both HDAC1 and HDAC3, we tested whether additional compounds targeting HDAC1 and/or HDAC3 could restore gene expression abnormalities elicited by mutant Htt in a mouse model. R6/2 transgenic and wt mice received injections of each inhibitor (150 mg/kg; s.c.) for three days and the expression of HD-related genes was measured in the striatum. Thirteen genes that have been previously found to be altered in their expression in the striatum of several HD mouse models and in post-mortem human caudate from HD patients, in addition to genes regulated by HDACi 4b treatment in our previous studies, were selected for qRT-PCR analysis (Suppl Table 3). The regulation of a subset of five genes by our novel HDAC inhibitors is spown in Figure 1, with the complete data summarized in Table 3. We found that HDACi 136, a compound showing greater selectivity for HDAC3 compared to HDACi 4b (Table 1), was most effective in reversing the expression of genes relevant to HD, including Ppp1r1b, which encodes DARPP-32, a marker for medium spiny striatal neurons (Figure 1; Table 3). In contrast, the HDAC1- selective inhibitor (HDACi 228) and the HDAC 1/3-equiselective inhibitor (HDACi 109) were less effective at correcting gene expression abnormalities in R6/2 transgenic mice, although modified expression levels for a set of genes, including Pde1b, Ccr6 and Cnih2 (Figure 1; Table 3). Interestingly, compound 228, which selectively and potently inhibits HDAC1, elicited greater changes in gene expression in wt mice compared to R6/2 transgenic mice (Table 3).
Figure 1.
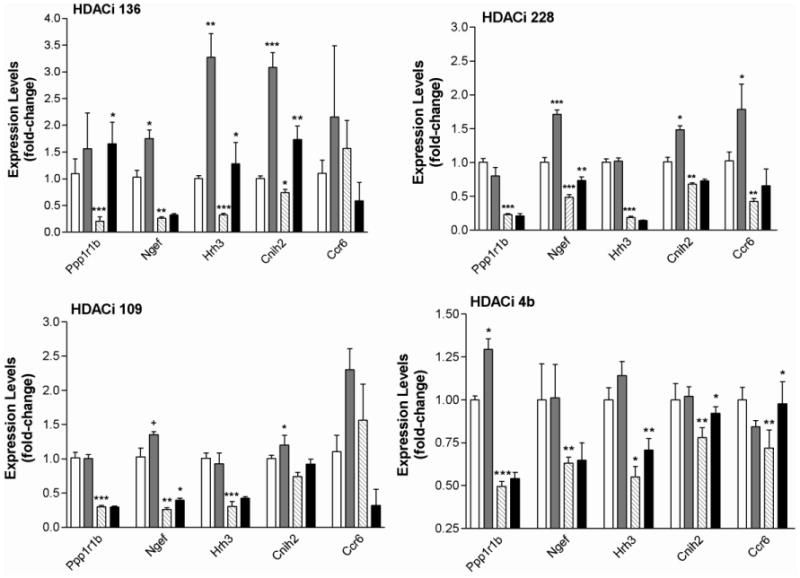
Real-time PCR results showing expression changes for selected genes with the indicated HDAC inhibitors. Values shown are the mean +/− S.E.M. expression value from n=4 mice per group. Open bars represent wt-vehicle-treated; gray bars, wt-drug-treated; striped bars, HD-vehicle-treated; black bars, HD-drug-treated. Complete data for all genes are shown in Table 3. One-way ANOVA for multiple comparisons followed by Student's t test for determination of exact p-values were used to determined significant effects of HDAC inhibitors on gene expression levels in wt and R6/2 transgenic mice. Significant differences are indicated by asterisks: *, p<0.05; **, p<0.01, ***, p<0.001, +, p<0.08.
Table 3.
Summary of real-time PCR gene expression results with the indicated compounds.
| 4b | 109 | |||||||
|---|---|---|---|---|---|---|---|---|
| Gene ID: | Fold-change wt | signif. wt: | Fold-change Tg | signif. Tg: | Fold-change wt | signif. wt: | Fold-change Tg | signif. Tg: |
| Agxt2l1: | 1.00 ±0.09 | ns | 3.00 ±0.62 | * | 1.25 ±0.19 | ns | 1.48 ±0.17 | * |
| Asl: | 1.01 ±0.06 | ns | 1.27 ±0.04 | * | 1.06 ±0.09 | ns | 0.93 ±0.03 | ns |
| Ccr6: | 1.49 ±0.20 | ns | 2.13 ±0.69 | * | 2.30 ±0.31 | * | 1.20 ±0.8 | ns |
| Cnih2: | 1.02 ±0.06 | ns | 1.18 ±0.05 | * | 1.20 ±0.14 | * | 1.26 ±0.10 | * |
| Ppp1r1b: | 1.29 ±0.05 | * | 1.09 ±0.07 | ns | 1.00 ±0.06 | ns | 1.00 ±0.06 | ns |
| Dst: | 1.34 ±0.04 | * | 0.80 ±0.04 | † | 1.38 ±0.05 | * | 1.00 ±0.06 | ns |
| Hrh3: | 1.14 ±0.08 | ns | 1.28 ±0.12 | † | 0.93 ±0.16 | ns | 1.50 ±0.09 | ns |
| Mt3: | 0.82 ±0.12 | ns | 1.77 ±0.15 | * | 0.98 ±0.06 | ns | 1.00 ±0.04 | ns |
| Ngef | 1.01 ±0.05 | ns | 0.97 ±0.05 | ns | 1.36 ±0.04 | † | 1.55 ±0.11 | * |
| Pde1b | 0.96 ±0.10 | ns | 1.07 ±0.09 | ns | 0.80 ±0.06 | * | 0.73 ±0.10 | ns |
| Rasd2 | 0.98 ±0.12 | ns | 1.23 ±0.09 | † | 0.82 ±0.02 | ns | 0.65 ±0.10 | † |
| Ttc3: | 0.89 ±0.02 | ns | 1.15 ±0.10 | * | 0.64 ±0.13 | ns | 1.30 ±0.07 | ns |
| Zfp238: | 1.01 ±0.07 | ns | 0.75 ±0.05 | * | 1.07 ±0.02 | ns | 0.92 ±0.02 | ns |
| 136 | 228 | |||||||
| Gene ID: | Fold-change wt | signif. wt: | Fold-change Tg | signif. Tg: | Fold-change wt | signif. wt: | Fold-change Tg | signif. Tg: |
| Agxt2l1: | 1.75 ±0.34 | * | 2.63 ±0.46 | * | 1.04 ±0.12 | ns | 1.28 ±0.24 | ns |
| Asl: | 1.43 ±0.25 | ns | 3.47 ±0.68 | * | 0.88 ±0.08 | ns | 0.93 ±0.12 | ns |
| Ccr6: | 2.15 ±0.13 | ns | 0.61 ±0.36 | ns | 1.79 ±0.37 | * | 1.58 ±0.59 | ns |
| Cnih2: | 3.08 ±0.27 | *** | 2.36 ±0.34 | ** | 1.49 ± 0.06 | * | 1.07 ±0.04 | ns |
| Ppp1r1b: | 1.56 ± 0.67y | ns | 10.0 ±2.43 | ** | 0.80 ±0.13 | ns | 0.94 ±0.14 | ns |
| Dst: | 2.14±0.32 | * | 2.46 ±0.50 | * | 1.33 ±0.06 | * | 0.99 ±0.08 | ns |
| Hrh3: | 3.27 ±0.04 | ** | 4.09 ±1.25 | * | 1.02 ±0.05 | ns | 0.80 ±0.02 | ns |
| Mt3: | 8.41 ±0.20 | *** | 7.30 ±0.90 | *** | 1.03 ±0.02 | ns | 1.02 ±0.02 | ns |
| Ngef | 1.75 ±0.16 | * | 1.25 ±0.10 | ns | 1.71 ±0.07 | *** | 1.52 ±0.11 | ** |
| Pde1b | 1.04 ±0.15 | ns | 1.06 ±0.09 | ns | 1.40 ± 0.07 | * | 1.08 ±0.09 | ns |
| Rasd2 | 1.04 ±0.17 | ns | 1.15 ±0.20 | ns | 1.00 ±0.18 | ns | 1.13 ±0.12 | ns |
| Ttc3: | 2.43 ±0.36 | ** | 3.61 ±1.20 | * | 1.04 ±0.11 | ns | 1.09 ±0.14 | ns |
| Zfp238: | 0.30 ±0.19 | * | 1.45 ±0.29 | ns | 1.32 ±0.19 | ns | 1.16 ±0.11 | ns |
ns, not significant;
p<0.07;
p<0.05;
p<0.01;
p<0.0001
4b expression data from Asl, Cnih2, Ppp1r1b, Hrh3 and Zfp238 represent microarray data from GEO accession # GSE26317.
Disease rescue in HD flies
Twenty nine 4b-related compounds showing varying selectivities for HDACs 1-3, were assessed for their disease-rescuing effects in Drosophila melanogaster expressing N-terminal Htt fragments from human HD exonl (Httexlp Q93). Freshly eclosed flies expressing Httexl Q93 in all neurons were fed medium supplemented with a given HDAC inhibitor or vehicle (DMSO), and neuronal degeneration was assessed 7 days later by using the pseudopupil technique, which scores the number of surviving rhabdomeres (photoreceptor neurons) per ommatidium. Both 4b and 136, the two top compounds from the mouse studies, showed concentration-dependent effects at improving the number of rhabdomeres per ommatidium (Figure 2); however, additional derivatives showed more potent neuroprotective effects. These included another HDAC3-selective compound, HDACi 971, an HDAC1/3-selective compound, HDACi 974, and an HDAC1-selective compound, HDACi 233 (Figure 2; Suppl. Table 1). Similar to the mouse studies, HDACi 109 was not effective. No correlation between HDAC1- or HDAC3-selectivity of the inhibitors and disease rescue was observed (Suppl Table 1), as both types of compounds were effective in this model, and efficacy at inhibiting HDAC2 was not a factor.
Figure 2.
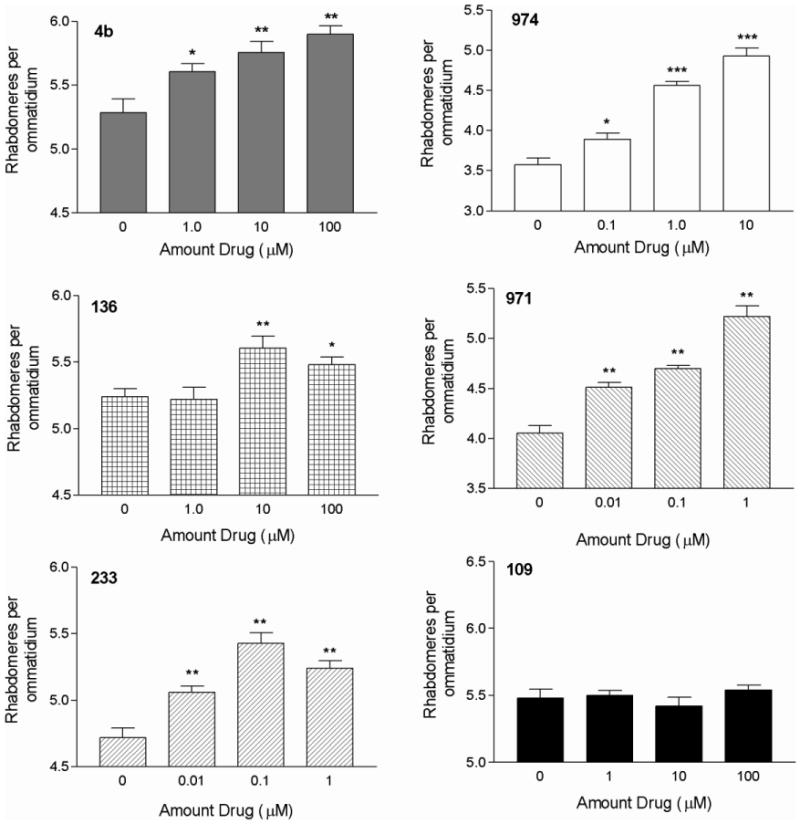
Neurodegeneration of 7-day old HttexlpQ93 flies fed HDACi 4b (HDAC3-selective), 974 (HDAC 1/3-selective), 233 (HDAC1-selective) or 136 (HDAC3-selective) compounds from eclosion on, as assayed by the pseudopupil technique. Asterisks denote significant difference due to drug treatment compared to DMSO control as determined by One-way ANOVA, followed by Dunnett's post-test, *, p<0.05; **, p<0.01;***, P<0.001.
Reversal of Htt-elicited effects in immortalized striatal cells
We next assessed the ability of our novel HDAC inhibitors to improve the metabolic deficit exhibited by immortalized cells generated from striatal tissue of HdhQ111 knock-in mice (Trettel et al., 2000). These cells express full-length endogenous Htt protein containing 111 glutamines and display a mutant phenotype of decreased mitochondrial function and energy metabolism when compared to wt cells expressing an Htt gene with 7 glutamines (Cui et al., 2006; Lee et al., 2007). STHdhQ111 cells were incubated with different HDAC inhibitors and metabolic activity was measured after 24 and 48 hrs. Again, 4b and 136 significantly improved the metabolic deficit exhibited by these cells (Figure 3). However, additional compounds showing potent inhibition of HDAC3 (IC50< 100 nM), such as HDACi 1029, were more efficacious at improving the metabolic deficit of STHdhQ111 cells, showing significant effects at lower concentrations and with greater magnitudes of improvement (Figure 3; Table 2). In contrast, compounds with nearly 5-fold lower potency at HDAC3, such as HDACi 991, were less effective (Figure 3; Table 2). Comparing all 23 compounds tested in these cells, we found that the potency for inhibiting HDAC3 (as measured by their IC50 values) was significantly correlated with the minimum effective dose at improving the HD phenotype (Pearson's r=0.477; p=0.033; Figure 3). Three of the potent HDAC3-targetting compounds also showed potent inhibition (<100 nM) of HDAC1 (Table 2), and, although the IC50 values for inhibition of HDAC1 were also significantly correlated with the minimum effective dose for phenotypic improvement, the IC50 values for HDAC1 inhibition were typically 10-fold higher than for inhibition of HDAC3 (Table 2, Figure 3).
Figure 3.
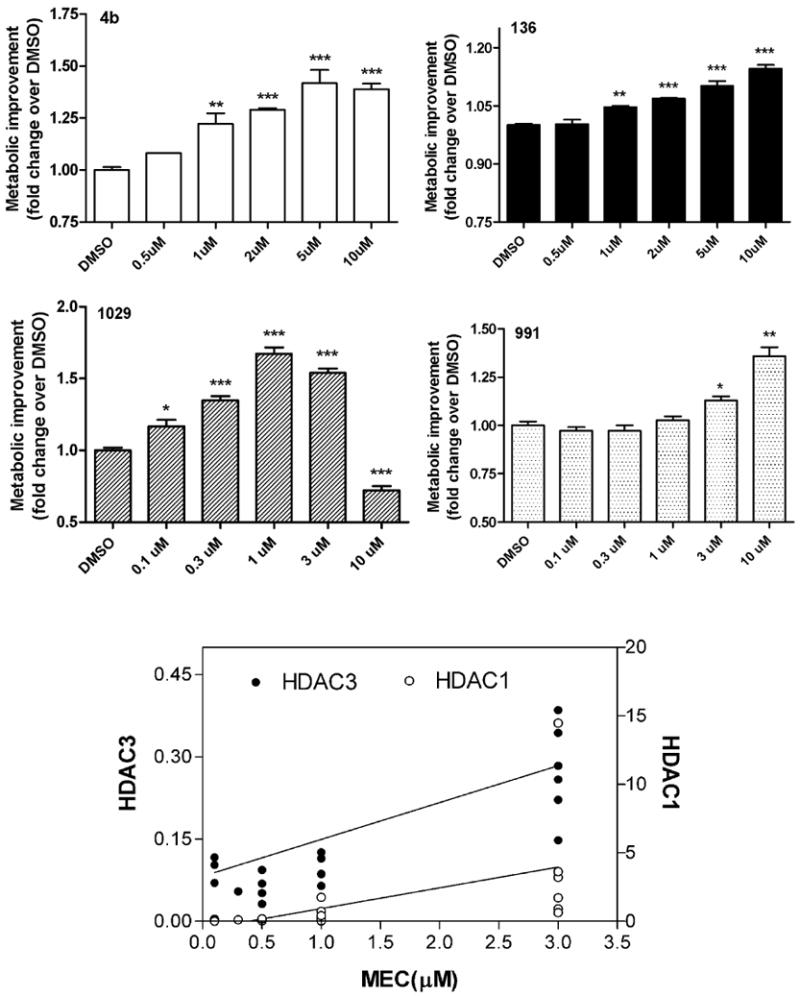
Improvement of Htt-elicited metabolic deficits in STHdhQ111 striatal cells elicited by HDACi 1029 (IC50 value for HDAC3=70 nM) (A), and HDACi 991, (IC50 value for HDAC3=344 nM) (B). Data are presented as mean ± SEM, N=4 experiments. Significant differences in the data values were determined by ANOVA with Dunnett's post-test against the control group (0μM). *, p<0.05; **, p<0.001; ***, p<0.0001. C. Linear correlation between minimum effective concentration at increasing metabolic activity in STHdhQ111 striatal cells (X-axis) and potency for HDAC3 (left y-axis) and HDAC1 (right y-axis). Pearson's correlation values for HDAC3: r=0.477; p=0.033; HDAC1: r=0.546; p=0.012.
STHdhQ111 cells have been shown to exhibit gene expression deficits when compared to wt STHdhQ7 cells (Sadri-Vakili et al., 2007). We tested the effects of 4b and the panel of 4b-related compounds for their ability to increase the expression of the vitamin D receptor (Vdr) and dehydrogenase/reductase (SDR family) member 4 (Dhrs4) two genes showing significant downregulation in mutant striatal cells compared to wt. We found that 4b, as well as other HDAC3/1 -targeting compounds were effective at reversing gene expression deficits in these cells (Suppl. Table 4).
Subcellular localization of Class I and II HDAC enzymes
Given the distinct selectivity profiles of the HDAC inhibitors described above, and cellular activities in HD models, we measured protein levels of class I and class II HDACs in both nuclear and cytoplasmic cortical fractions from HD N171-82Q transgenic mice and wt littermates using Western blot analysis. For class I HDACs, we find prominent differences in the subcellular localization of these enzymes in HD transgenic mice compared to wt controls (Figure 4). Both HDACs 1 and 3 show increased nuclear accumulation and decreased cytoplasmic accumulation in HD transgenic mice compared to wt mice, suggesting that these isoforms are translocated into the nucleus in the presence of mutant Htt protein. No differences were found for HDAC2. Of the class II HDACs tested, HDAC4 showed very low expression and HDAC7 could not be detected in nuclear fractions, but both showed prominent cytoplasmic localization (Figure 4). No overall differences in expression or cellular localization were observed for these class II HDACs in HD transgenic mice compared to wt (Figure 4).
Figure 4.
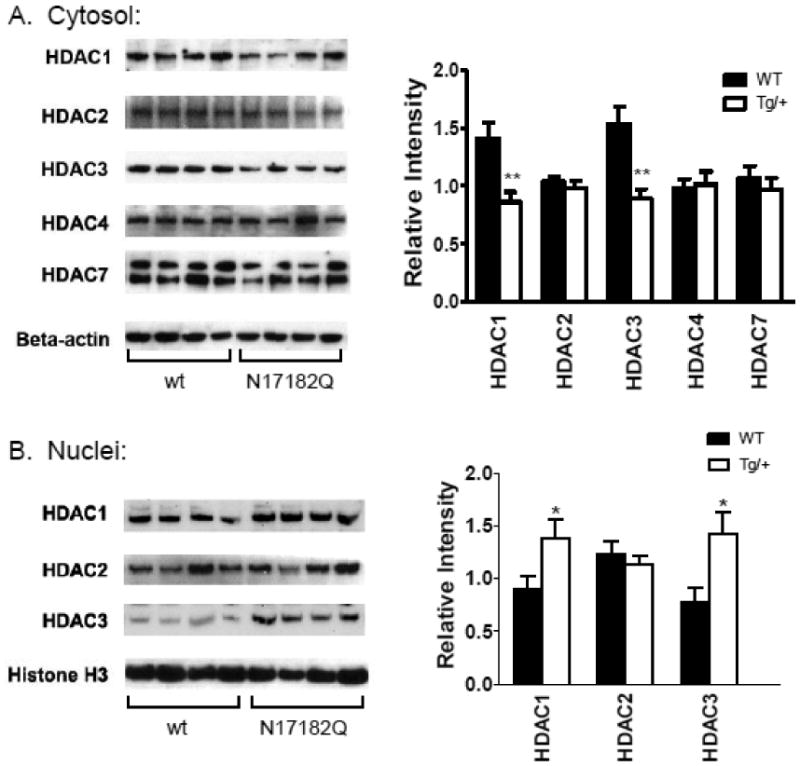
Expression of HDACs in cytoplasmic and nuclear fractions from cortex of wt and N171-82Q transgenic mice (Tg/+). Western blot analysis was performed on n=10-12 animals per group; representative blots showing n=4 per group are shown. Bar graph quantification of protein expression is shown to the right of the Western blots. *, p<0.05; **, p<0.01 as determined by Student's t test (unpaired, two-tailed). Note: nuclear expression of HDACs 4 and 7 was undetectable to very low in these samples, hence is not shown.
Discussion
Previous studies have demonstrated that non-selective class I and II HDAC inhibitors, such as SAHA (Table 1), phenylbutyrate and sodium butyrate, ameliorate disease symptoms in mouse models for HD (Ferrante et al., 2003; Hockly et al., 2003; Gardian et al., 2005) and show neuroprotective effects in Htt-challenged cell and Drosophila models of the disease (Steffan et al., 2001). However, these compounds can elicit toxic side effects, which are presumably due to the general inhibition of many or all class I and II HDAC isotypes. Hence, it is essential to determine which HDAC subtype(s) might be most beneficial for therapeutic efficacy in HD. Here we show that HDAC inhibitors that target HDAC3 with high potency, as well as HDAC1, display efficacy in reversing/preventing Htt-elicited phenotypes. HDAC3-targeting compounds, 4b and 136, showed beneficial effects in all three of our HD model systems: R6/2 transgenice mice, StHdhQ111 striatal cells and Httexlp Q93 Drosophila, while the testing of additional 4b derivatives in fly and cell culture models validated the involvement of HDAC3, as well as HDAC1, in the disease rescuing properties of these inhibitors. Importantly, these compounds inhibit HDACs 1 and 3 at 10-100-fold concentrations lower than those causing cytostatic effects in Hct116 cells (Tables 1 and 2). In comparison, SAHA showed cytostatic effects at concentrations only 4 to 5-fold higher than that observed for HDAC enzyme inhibition (Table 1).
The results from our qRT-PCR analysis revealed that HDACi 136 was most efficacious at restoring gene expression abnormalities elicited by mutant Htt protein, correcting deficits in eight of the 13 genes tested; this inhibitor shows > ∼10-fold selectivity for HDAC3 over the other class I HDACs. This same compound has been shown to have beneficial effects in a mouse model for Friedreich's ataxia (Sandi et al., 2011) and has been found to significantly enhance long-term memory in wt mice (McQuown et al.). The HDAC1-selective compound 228 also elevated gene expression levels to some extent, but more so in wt mice compared to R6/2 transgenic mice. We further found that HDACi 109 was less efficacious than HDACi 4b at reversing gene expression deficits in HD mice despite showing a similar selectivity profile as HDACi 4b. However, pharmacokinetic data show that HDACi 4b has a four-fold higher blood-brain ratio, (which reflects the percentage of drug that penetrates the brain relative to the plasma), than HDACi 109 (data not shown). This likely explains the greater effects of HDACi 4b on gene expression in the brain. Importantly, several of the new compounds tested in cell and fly models show much higher brain penetration than 4b (see Table 2), suggesting that they will be more effective in vivo.
Our studies in the HD transgenic fly model also provide strong evidence that rescue of eye neurodegeneration can be achieved by administration of HDAC inhibitors targeting human HDAC3, with compounds 4b, 136 and 971 showing statistically significant effects in the fly model. However, compounds inhibiting HDAC1 were also effective at reducing eye neurodegeneration, with the HDAC1-selective compound, HDACi 233, showing the most potent effect (i.e. 10 nM). This is consistent with previous studies using genetic strategies to examine the contribution of different HDAC subtypes to disease phenotypes in the same HD Drosophila model (Pallos et al., 2008). The results from the Pallos et al., study revealed that Httexlp-induced neurodegeneration in flies was protected by genetic knock-down of Rpd3, a Drosophila HDAC that is homologous to all class I human HDACs. However, amelioration of lethality or of neuronal degeneration in HD flies was not observed with targeted knock-down of fly HDAC3 (Pallos et al., 2008). This discrepancy could be due to several reasons. Firstly, it is possible that compounds selective for human HDAC3 do not discriminate between the two Drosophila enzymes Rpd3 and dHDAC3. Human HDAC3 is 57.3 and 65.7% identical to Rpd3 and dHDAC3 respectively thus having only ∼8% difference between the two while human HDAC1 shares almost 20% greater identity with Rpd3 than dHDAC3. Thus the selectivity of our HDAC3 inhibitors for the two related enzymes in the fly may be reduced thus allowing a greater degree of potential cross inhibition. Secondly, it is possible that the two fly HDACs, Rpd3 and dHDAC3, are redundant to some degree, such that genetically reducing HDAC3 by only 50% does not result in a detectable effect. Our HDAC inhibitors may target both enzymes in the fly, thereby explaining the disease rescue with HDAC3-targeting compounds. Finally, there could be species differences in the HDAC enzymes, although, we have observed that these compounds elevate both histone H3 and H4 acetylation levels in fly neuronal cells, and therefore, appear to be active against fly HDACs (Penalver and Gottesfeld, in preparation).
Our studies in striatal cultures also confirmed a role for HDAC3 in improving polyglutamine-elicited metabolic deficits. Notably, we found that the potency for inhibiting HDAC3 was significantly correlated with the minimum effective dose at improving the HD phenotype in striatal cells. We further observed a correlation between inhibition of HDAC1 and the minimum effective dose for phenotypic improvement, however, the IC50 values for HDAC1 inhibition were typically 10-fold higher than for inhibition of HDAC3.
Growing evidence suggests that aberrant chromatin remodeling plays a central role in the pathogenesis of HD (Steffan et al 2001; Ryu et al., 2006; Sadri-Vakili et al., 2007; Stack et al., 2007). Studies have demonstrated reduced histone H3 and H4 acetylation (Stack et al., 2007) (Sadri-Vakili et al., 2007) and increased histone H3 tri-methylation (Ryu et al., 2006; Stack et al., 2007) in the brains of HD transgenic mice and HD human patients. These chromatin marks are typically associated with repressed transcriptional activity (Kornberg and Lorch, 1999), which is also observed in HD (Okazawa, 2003; Sugars and Rubinsztein, 2003; Thomas, 2006). In this study, we found that HDAC1 and HDAC3 were translocated into the nucleus in the presence of mutant Htt, suggesting that these two HDAC isoforms may contribute to a repressed chromatin environment in HD. In contrast, no differences in the localization of HDAC2, or the class II HDACs, HDAC4 and HDAC7, were found. The nuclear accumulation of HDAC1 and HDAC3 may provide a mechanism to account for the efficacy of our compounds, which selectively target these isoforms in HD model systems.
Consistent with the notion that inhibition of HDAC3 is beneficial in the CNS, previous studies have demonstrated that overexpression of HDAC3 is selectively toxic to neurons (Bardai and D'Mello, 2011). In this study, overexpression of HDAC3 induced death of rat cerebellar granule and cortical neurons, whereby shRNA-mediated suppression of HDAC3 expression protected against potassium-induced neuronal death (Bardai and D'Mello, 2011). Furthermore, it was shown that HDAC3 is directly phosphorylated by GSK3β, and that inhibiting GSK3β can reduce HDAC3-mediated neuronal toxicity (Bardai and D'Mello, 2011). Interestingly, other studies have shown that GSK3β is upregulated in an HD knock-in mouse model (Valencia et al., 2011).
While our results indicate that targeting HDAC3 and HDAC1, would be most beneficial for HD therapeutics, this does not preclude the involvement of other HDAC enzymes, such as the sirtuins (class III HDACs), in the pathology of, or therapeutic application for, HD. Previous studies have demonstrated that the mechanism of HDAC activity for the class II HDACs, HDAC4 and HDAC5, involves HDAC3 (Fischle et al., 2002). Fischle and colleagues demonstrated that the HDAC domains of HDAC4 and HDAC5 do not possess intrinsic enzymatic activity as isolated polypeptides but are associated with HDAC activity only by interacting with HDAC3, via the transcriptional corepressor N-CoR/SMRT (Fischle et al., 2002). Interestingly, recent work has suggested that class IIa HDACs are not HDACs at all, but rather acetyl-lysine binding proteins, that recruit HDAC3 to active chromatin in order to alter gene transcription (Bradner et al., 2011).
The involvement of HDAC enzymes in the pathology of HD may be complex. HDACs exist in large multiprotein complexes, and there is evidence that most, if not all, HDAC isoforms require interaction with other HDACs or proteins for optimal enzymatic activity (Adcock et al., 2006; Hildmann et al., 2007). However, our findings provide strong evidence that inhibition of the HDAC3, and to a lesser extent HDAC1, can prevent HD-like phenotypes in cell, fly and mouse models of the HD. Furthermore, we suggest that HDAC inhibitors targeting either or both of these isotypes could show therapeutic benefits in the treatment of human HD.
Supplementary Material
Research Highlights.
Inhibition of the HDAC3 subtype is necessary for amelioration of gene expression deficits related to HD.
Rescue of neurodegeneration in HD flies can be achieved by treating with compounds that target class I HDACs.
Amelioration of Htt-elicited metabolic deficits in striatal cells is correlated with potency of HDAC3 and HDAC1 inhibition.
HDAC1 and HDAC3 accumulate in the nucleus of HD transgenic mice.
HDAC1 and HDAC3 contribute to a repressive chromatin environment in HD.
Acknowledgments
NIH R01NS44169 to E.A.T.; HDSA35326 and NIH R01NS045283 to J.L.M.; NIH R01NS055158, U01NS063953 and R01NS62856 to J.M.G.; Repligen Corporation.
Abbreviations
- HDAC
histone deacetylase
- HDACi
HDAC inhibitor
- HD
Huntington's disease
- Ppp1r1b
Protein phosphatase 1 regulatory (inhibitor) subunit 1B
- Htt
Huntingtin
Footnotes
Publisher's Disclaimer: This is a PDF file of an unedited manuscript that has been accepted for publication. As a service to our customers we are providing this early version of the manuscript. The manuscript will undergo copyediting, typesetting, and review of the resulting proof before it is published in its final citable form. Please note that during the production process errors may be discovered which could affect the content, and all legal disclaimers that apply to the journal pertain.
References
- Abel T, Zukin RS. Epigenetic targets of HDAC inhibition in neurodegenerative and psychiatric disorders. Curr Opin Pharmacol. 2008;8:57–64. doi: 10.1016/j.coph.2007.12.002. [DOI] [PMC free article] [PubMed] [Google Scholar]
- Adcock IM, Ford P, Ito K, Barnes PJ. Epigenetics and airways disease. Respir Res. 2006;7:21. doi: 10.1186/1465-9921-7-21. [DOI] [PMC free article] [PubMed] [Google Scholar]
- Bardai FH, D'Mello SR. Selective toxicity by HDAC3 in neurons: regulation by Akt and GSK3beta. J Neurosci. 2011;31:1746–51. doi: 10.1523/JNEUROSCI.5704-10.2011. [DOI] [PMC free article] [PubMed] [Google Scholar]
- Blander G, Guarente L. The Sir2 family of protein deacetylases. Annu Rev Biochem. 2004;73:417–35. doi: 10.1146/annurev.biochem.73.011303.073651. [DOI] [PubMed] [Google Scholar]
- Bradner JE, West N, Grachan ML, Greenberg EF, et al. Chemical phylogenetics of histone deacetylases. Nat Chem Biol. 2011;6:238–43. doi: 10.1038/nchembio.313. [DOI] [PMC free article] [PubMed] [Google Scholar]
- Chou CJ, Herman DM, Gottesfeld JM. Pimelic diphenylamide 106 is a slow, tight-binding inhibitor of class I histone deacetylases. J Biol Chem. 2008;283:35402–9. doi: 10.1074/jbc.M807045200. [DOI] [PMC free article] [PubMed] [Google Scholar]
- Cui L, Jeong H, Borovecki F, Parkhurst CN, et al. Transcriptional repression of PGC-1 alpha by mutant huntingtin leads to mitochondrial dysfunction and neurodegeneration. Cell. 2006;127:59–69. doi: 10.1016/j.cell.2006.09.015. [DOI] [PubMed] [Google Scholar]
- Desplats PA, Kass KE, Gilmartin T, Stanwood GD, et al. Selective deficits in the expression of striatal-enriched mRNAs in Huntington's disease. J Neurochem. 2006;96:743–57. doi: 10.1111/j.1471-4159.2005.03588.x. [DOI] [PubMed] [Google Scholar]
- Ferrante RJ, Kubilus JK, Lee J, Ryu H, et al. Histone deacetylase inhibition by sodium butyrate chemotherapy ameliorates the neurodegenerative phenotype in Huntington's disease mice. J Neurosci. 2003;23:9418–27. doi: 10.1523/JNEUROSCI.23-28-09418.2003. [DOI] [PMC free article] [PubMed] [Google Scholar]
- Ferrante RJ, Ryu H, Kubilus JK, D'Mello S, et al. Chemotherapy for the brain: the antitumor antibiotic mithramycin prolongs survival in a mouse model of Huntington's disease. J Neurosci. 2004;24:10335–42. doi: 10.1523/JNEUROSCI.2599-04.2004. [DOI] [PMC free article] [PubMed] [Google Scholar]
- Fischle W, Dequiedt F, Hendzel MJ, Guenther MG, et al. Enzymatic activity associated with class II HDACs is dependent on a multiprotein complex containing HDAC3 and SMRT/N-CoR. Mol Cell. 2002;9:45–57. doi: 10.1016/s1097-2765(01)00429-4. [DOI] [PubMed] [Google Scholar]
- Freiman RN, Tjian R. Neurodegeneration. A glutamine-rich trail leads to transcription factors. Science. 2002;296:2149–50. doi: 10.1126/science.1073845. [DOI] [PubMed] [Google Scholar]
- Gao L, Cueto MA, Asselbergs F, Atadja P. Cloning and functional characterization of HDAC11, a novel member of the human histone deacetylase family. J Biol Chem. 2002;277:25748–55. doi: 10.1074/jbc.M111871200. [DOI] [PubMed] [Google Scholar]
- Gardian G, Browne SE, Choi DK, Klivenyi P, et al. Neuroprotective effects of phenylbutyrate in the N171-82Q transgenic mouse model of Huntington's disease. J Biol Chem. 2005;280:556–63. doi: 10.1074/jbc.M410210200. [DOI] [PubMed] [Google Scholar]
- Group HsDCR. A novel gene containing a trinucleotide repeat that is expanded and unstable on Huntington's disease chromosomes. The Huntington's Disease Collaborative Research Group. Cell. 1993;72:971–83. doi: 10.1016/0092-8674(93)90585-e. [DOI] [PubMed] [Google Scholar]
- Hahnen E, Hauke J, Trankle C, Eyupoglu IY, et al. Histone deacetylase inhibitors: possible implications for neurodegenerative disorders. Expert Opin Investig Drugs. 2008;17:169–84. doi: 10.1517/13543784.17.2.169. [DOI] [PubMed] [Google Scholar]
- Hildmann C, Riester D, Schwienhorst A. Histone deacetylases--an important class of cellular regulators with a variety of functions. Appl Microbiol Biotechnol. 2007;75:487–97. doi: 10.1007/s00253-007-0911-2. [DOI] [PubMed] [Google Scholar]
- Hockly E, Richon VM, Woodman B, Smith DL, et al. Suberoylanilide hydroxamic acid, a histone deacetylase inhibitor, ameliorates motor deficits in a mouse model of Huntington's disease. Proc Natl Acad Sci U S A. 2003;100:2041–6. doi: 10.1073/pnas.0437870100. [DOI] [PMC free article] [PubMed] [Google Scholar]
- Kazantsev AG, Thompson LM. Therapeutic application of histone deacetylase inhibitors for central nervous system disorders. Nat Rev Drug Discov. 2008;7:854–68. doi: 10.1038/nrd2681. [DOI] [PubMed] [Google Scholar]
- Kornberg RD, Lorch Y. Twenty-five years of the nucleosome, fundamental particle of the eukaryote chromosome. Cell. 1999;98:285–94. doi: 10.1016/s0092-8674(00)81958-3. [DOI] [PubMed] [Google Scholar]
- Lee JM, Ivanova EV, Seong IS, Cashorali T, et al. Unbiased gene expression analysis implicates the huntingtin polyglutamine tract in extra-mitochondrial energy metabolism. PLoS Genet. 2007;3:e135. doi: 10.1371/journal.pgen.0030135. [DOI] [PMC free article] [PubMed] [Google Scholar]
- Mangiarini L, Sathasivam K, Seller M, Cozens B, et al. Exon 1 of the HD gene with an expanded CAG repeat is sufficient to cause a progressive neurological phenotype in transgenic mice. Cell. 1996;87:493–506. doi: 10.1016/s0092-8674(00)81369-0. [DOI] [PubMed] [Google Scholar]
- Marsh JL, Lukacsovich T, Thompson LM. Animal models of polyglutamine diseases and therapeutic approaches. J Biol Chem. 2008 doi: 10.1074/jbc.R800065200. [DOI] [PMC free article] [PubMed] [Google Scholar]
- McCampbell A, Taye AA, Whitty L, Penney E, et al. Histone deacetylase inhibitors reduce polyglutamine toxicity. Proc Natl Acad Sci U S A. 2001;98:15179–84. doi: 10.1073/pnas.261400698. [DOI] [PMC free article] [PubMed] [Google Scholar]
- McQuown SC, Barrett RM, Matheos DP, Post RJ, et al. HDAC3 is a critical negative regulator of long-term memory formation. J Neurosci. 31:764–74. doi: 10.1523/JNEUROSCI.5052-10.2011. [DOI] [PMC free article] [PubMed] [Google Scholar]
- Morrison BE, Majdzadeh N, D'Mello SR. Histone deacetylases: focus on the nervous system. Cell Mol Life Sci. 2007;64:2258–69. doi: 10.1007/s00018-007-7035-9. [DOI] [PMC free article] [PubMed] [Google Scholar]
- Nucifora FC, Jr, Sasaki M, Peters MF, Huang H, et al. Interference by huntingtin and atrophin-1 with cbp-mediated transcription leading to cellular toxicity. Science. 2001;291:2423–8. doi: 10.1126/science.1056784. [DOI] [PubMed] [Google Scholar]
- Okazawa H. Polyglutamine diseases: a transcription disorder? Cell Mol Life Sci. 2003;60:1427–39. doi: 10.1007/s00018-003-3013-z. [DOI] [PMC free article] [PubMed] [Google Scholar]
- Pallos J, Bodai L, Lukacsovich T, Purcell JM, et al. Inhibition of specific HDACs and sirtuins suppresses pathogenesis in a Drosophila model of Huntington's disease. Hum Mol Genet. 2008;17:3767–75. doi: 10.1093/hmg/ddn273. [DOI] [PMC free article] [PubMed] [Google Scholar]
- Ryu H, Lee J, Hagerty SW, Soh BY, et al. ESET/SETDB1 gene expression and histone H3 (K9) trimethylation in Huntington's disease. Proc Natl Acad Sci U S A. 2006;103:19176–81. doi: 10.1073/pnas.0606373103. [DOI] [PMC free article] [PubMed] [Google Scholar]
- Sadri-Vakili G, Bouzou B, Benn CL, Kim MO, et al. Histones associated with downregulated genes are hypo-acetylated in Huntington's disease models. Hum Mol Genet. 2007;16:1293–306. doi: 10.1093/hmg/ddm078. [DOI] [PubMed] [Google Scholar]
- Sandi C, Pinto RM, Al-Mahdawi S, Ezzatizadeh V, et al. Prolonged treatment with pimelic o- aminobenzamide HDAC inhibitors ameliorates the disease phenotype of a Friedreich ataxia mouse model. Neurobiol Dis. 2011;42:496–505. doi: 10.1016/j.nbd.2011.02.016. [DOI] [PMC free article] [PubMed] [Google Scholar]
- Stack EC, Del Signore SJ, Luthi-Carter R, Soh BY, et al. Modulation of nucleosome dynamics in Huntington's disease. Hum Mol Genet. 2007;16:1164–75. doi: 10.1093/hmg/ddm064. [DOI] [PubMed] [Google Scholar]
- Steffan JS, Bodai L, Pallos J, Poelman M, et al. Histone deacetylase inhibitors arrest polyglutamine-dependent neurodegeneration in Drosophila. Nature. 2001;413:739–43. doi: 10.1038/35099568. [DOI] [PubMed] [Google Scholar]
- Sugars KL, Rubinsztein DC. Transcriptional abnormalities in Huntington disease. Trends Genet. 2003;19:233–8. doi: 10.1016/S0168-9525(03)00074-X. [DOI] [PubMed] [Google Scholar]
- Thomas EA. Striatal specificity of gene expression dysregulation in Huntington's disease. J Neurosci Res. 2006;84:1151–64. doi: 10.1002/jnr.21046. [DOI] [PubMed] [Google Scholar]
- Thomas EA, Coppola G, Desplats PA, Tang B, et al. The HDAC Inhibitor, 4b, Ameliorates the Disease Phenotype and Transcriptional Abnormalities in Huntington's Disease Transgenic Mice. Proc Natl Acad Sci U S A. 2008;105:15564–9. doi: 10.1073/pnas.0804249105. [DOI] [PMC free article] [PubMed] [Google Scholar]
- Trettel F, Rigamonti D, Hilditch-Maguire P, Wheeler VC, et al. Dominant phenotypes produced by the HD mutation in STHdh(Q111) striatal cells. Hum Mol Genet. 2000;9:2799–809. doi: 10.1093/hmg/9.19.2799. [DOI] [PubMed] [Google Scholar]
- Valencia A, Reeves PB, Sapp E, Li X, et al. Mutant huntingtin and glycogen synthase kinase 3-beta accumulate in neuronal lipid rafts of a presymptomatic knock-in mouse model of Huntington's disease. J Neurosci Res. 2011;88:179–90. doi: 10.1002/jnr.22184. [DOI] [PubMed] [Google Scholar]
- Xu C, Soragni E, Chou CJ, Herman D, et al. Chemical probes identify a role for histone deacetylase 3 in Friedreich's ataxia gene silencing. Chem Biol. 2009;16:980–9. doi: 10.1016/j.chembiol.2009.07.010. [DOI] [PMC free article] [PubMed] [Google Scholar]
- Xu WS, Parmigiani RB, Marks PA. Histone deacetylase inhibitors: molecular mechanisms of action. Oncogene. 2007;26:5541–52. doi: 10.1038/sj.onc.1210620. [DOI] [PubMed] [Google Scholar]
- Zhai W, Jeong H, Cui L, Krainc D, et al. In vitro analysis of huntingtin-mediated transcriptional repression reveals multiple transcription factor targets. Cell. 2005;123:1241–53. doi: 10.1016/j.cell.2005.10.030. [DOI] [PubMed] [Google Scholar]
Associated Data
This section collects any data citations, data availability statements, or supplementary materials included in this article.