Abstract
Kynurenic acid, an intermediate metabolite of L-kynurenine, is a competitive antagonist of inotropic excitatory amino acid (EAA) receptors as well as a non competitive antagonist of 7 alpha nicotine cholinergic receptors and its involvement in memory deficit and cognition impairment has been suggested. Alterations of kynurenic acid metabolism in the brain after HIV-1 (human immunodeficiency virus type-1) infection have been demonstrated. The present study evaluates the biosynthetic machinery of kynurenic acid e.g. the content of L-kynurenine and kynurenic acid, as well as the activity of enzymes synthesizing kynurenic acid, kynurenine aminotransferase I (KAT I) and kynurenine aminotransferase II (KAT II) in the frontal cortex and cerebellum of HIV-1 infected patients in relation to different types of pathology classified as follows: HIV in brain (HIV); opportunistic infection (OPP); infarction of brain (INF); malignant lymphoma of brain (LY); and glial dystrophy (GD) and of control (CO) subjects. Of all investigated pathologies the most frequent was OPP (65%), followed by HIV (26%), LY, INF, and GD (each 22%, respectively). Further, 68% of HIV-1 patients had bronchopneumonia, the highest incidence of which, at 60%, was seen in the OPP and LY group. Kynurenic acid was increased significantly in the frontal cortex of LY (392% of CO, P < 0.001), HIV (231% of CO, P < 0.01) and GD (193% of CO, P < 0.05), as well as in the cerebellum of GD (261% of CO, P < 0.01). A significant increase of L-kynurenine was observed in the frontal cortex of LY (385% of CO, P < 0.001) and INF (206% of CO, P < 0.01), and in the cerebellum of GD, LY, OPP and HIV (between 177% and 147% of CO). The KAT I activity increased significantly in the frontal cortex of all pathological subgroups, ie OPP = 420% > INF > LY > HIV > GD = 192% of CO. In the cerebellum, too, all pathological subgroups showed marked increase of KAT I activity (OPP = 320% > LY, HIV > GD > INF = 176% of CO). On contrary, the activity of KAT II was moderately, but significantly, higher in the frontal cortex of INF and OPP; in the cerebellum of HIV, OPP and LY it was comparable to the control, while mildly reduced in INF and GD. Interestingly, normal subjects with the diagnosis of bronchopneumonia were characterized by high kynurenic acid metabolism in the brain, too. Correlation analyses between kynurenine parameters revealed association between high ratio KAT I/KAT II and increased kynurenic acid level and lower L-kynurenine in the frontal cortex and cerebellum of HIV and LY subgroups. The present study revealed a different pattern of alteration of kynurenic acid metabolism in frontal cortex and cerebellum among investigated pathological subgroups of HIV-1 infected patients. Interestingly, a marked enhancement of kynurenic acid metabolism in the brain has been found with occurrence of bronchopneumonia. This finding indicates a notable association between impaired conditions of oxygen availability and enhancement of kynurenic acid formation in the human brain. These observation(s) might have an impact on the understanding of pathological processes in the brain after HIV-1 infection involving the development of neuropsychiatric and neurological symptoms, including memory and cognition impairment.
Keywords: HIV-1 infection, excitatory amino acid, kynurenic acid, kynurenine aminotransferases, neuroprotection, dementia, bronchopneumonia
Introduction
A disturbance of L-tryptophan metabolism was demonstrated in human immunodeficiency virus type-1 (HIV-1) associated neurological deficits. Some reports have described lowered L-tryptophan, elevated L-kynurenine, quinolinic acid and kynurenic acid in the CSF of HIV-1 patients.1–5 Quinolinic acid and many others neurotoxins are enhanced in the brain after cerebral HIV-1 infection and likely might contribute to the pathogenesis of neurological impairment.6–10 Furthermore, after HIV-1 infection, an increase of kynurenic acid levels and an enhancement of kynurenine aminotransferase I (KAT I) and kynurenine aminotransferase II (KAT II) activities, the enzymes synthesizing kynurenic acid, were found in the brain.11 The ability of kynurenic acid to block excitotoxic neuronal damage caused by neurotoxins and hypoxia/ischemia in animal experiments strongly supports the idea that kynurenic acid might function as a neuroinhibitory/modulatory metabolite in the human brain.3,12,13 On the other hand, increased kynurenic levels in the brain of Alzheimer’s patients14 or during aging process15 was suggested as a significant event contributing to cognitive impairment and memory deficit. This assumption was supported by the observation that the anti-dementia drug Cerebrolysin lowered kynurenic acid synthesis, at least in an in vitro human study.16 An animal experimental study also provides significant evidence that increased levels of kynurenic acid in the brain enhances memory impairment.17,18
After HIV-1 infection neuronal cell death accompanied by astrocytosis takes place.10,19–21,34 Major characteristics are widespread reactive astrocytosis, myelin pallor, and infiltration of monocytic cells, including blood-derived macrophages, resident microglia, and multinucleated giant cells. Most of these cells expressed very high metabolism (turnover) accompanied by complex tissue damage. After HIV-1 infection, a complex brain damage takes place described by different types of pathology thus HIV-1 in brain as found by anti-HIV immunocytochemistry (HIV), opportunistic infection (OPP), infarction of brain (INF), malignant lymphoma of brain (LY), and glial dystrophy (GD).20 Beside the different brain pathology, HIV-1 infected subjects often develop pneumonia or bronchopneumonia and a high mortality has been observed.21 The aim of the present study was to evaluate the alterations of kynurenic acid metabolism in relation to different types of brain pathology in HIV-1 infected patients and possible involvement in cognitive impairment and dementia is discussed. A part of this study was published in abstract form.22
Materials and Methods
Chemicals
L-kynurenine, kynurenic acid, pyruvate, pyridoxal-5′-phosphate and 2-amino-2-methyl-1-propanol (AMPOL) were purchased from Sigma. All other chemicals used were of the highest commercially available purity.
Brain tissue
Post mortem human brain samples of frontal cortex and cerebellum had been stored frozen at the Institute of Neurology, University of Vienna. Patients were clinically assessed and their diagnoses were based on clinical history and neuro-histopathological20 examination eg, 23 patients infected with HIV-1 aged 40.1 ± 3.0 years, and 16 controls (CO) aged 58.2 ± 3.4 years. Ratio male/female was 20/3 for HIV-1 patients, and 9/7 for CO. Post mortem time was 25.4 ± 4.4 hrs in HIV-1 and 10.1 ± 1.6 hrs in CO. In addition, as a separate group of 3 controls patients, aged 51.0 ± 8.3 years, with bronchopneumonia were analyzed in this study (post mortem time was 9.0 ± 0.6 hrs; ratio male/female was 2/1). Brain samples were stored at −70 °C before analysis. None of the patients was treated with anti-retroviral drugs. Samples were always taken from areas without gross lesions.
Pathology
HIV-1 infection leads to a broad spectrum of pathology types in the brain and these were classified as follows: OPP (n = 15); HIV (n = 6); LY (n = 5); INF (n = 5); and GD (n = 5) (Table 1). The occurrence of bronchopneumonia and tuberculosis in pathological subgroups is shown in the Table 2.
Table 1.
Occurrence of pathologies after HIV-1 infection.
| OPP | HIV | LY | INF | GD | |
|---|---|---|---|---|---|
| Ratio of pathology cases/total patient numbers infected with HIV-1; expressed in % | 15/23 (65%) | 6/23 (26%) | 5/23 (22%) | 5/23 (22%) | 5/23 (22%) |
Abbreviations: OPP, Opportunistic infection; HIV, HIV in brain as seen by immunocytochemistry/HIVE, HIVL; LY, Malignant lymphoma; GD, Glial dystrophy; INF, Infarction of brain.
Table 2.
Occurrence of bronchopneumonia (BR) and tuberculosis (TB) in different pathological group of patients after HIV-1 infection.
| Ratio | OPP | HIV | LY | INF | GD |
|---|---|---|---|---|---|
| Number of pathology cases with BR/total number of pathology cases; expressed in % | 9/15 (60%) | 1/6 (17%) | 3/5 (60%) | 2/5 (40%) | 2/5 (40%) |
| Number of pathology cases with TB/total number of pathology cases; expressed in % | 2/15 (13%) | 2/6 (33%) | 1/5 (20%) | No case with TB | 1/5 (20%) |
Abbreviations: OPP, Opportunistic infection; HIV, HIV in brain as seen by immunocytochemistry/HIVE, HIVL; INF, Infarction of brain; LY, Malignant lymphoma; GD, Glial dystrophy; BR, Bronchopneumonia; TB, Tuberculosis.
Tissue preparation
Brain samples were homogenized in an ice bath in 6 volumes (wt/vol) of 5 mM Tris-acetate buffer pH 7.4 containing 50 μM pyridoxal-5′-phosphate and 10 mM mercaptoethanol. Obtained homogenate was divided in two parts one for L-kynurenine and kynurenic acid determinations, and the other for KATs activities measurements.
Determination of kynurenic acid and L-kynurenine
Homogenate was mixed with 0.2 M HCl (vol/vol) and centrifuged (20 min, 15,000 g). Obtained supernatant was applied to a Dowex 50 W cation exchange column prewashed with 0.1 M HCl. Subsequently, the column was washed with 1 mL 0.1 M HCl and 1 mL distilled water, and kynurenic acid was eluted with 2 mL distilled water,23 while L-kynurenine was eluted with 2 mL of 1 M NH4OH.24 Kynurenic acid was determined by HPLC coupled to fluorescence detection system as previously reported.25 The HPLC system used for analysis of kynurenic acid consisted of the following: a pump (Shimadzu, LC-6A), a fluorescence detector (Shimadzu, RF-535) set at an excitation wave length of 340 nm and an emission wavelength of 398 nm, and a Shimadzu C-R5A Chromatopac Integrator. The mobile phase (isocratic system) consisted of 50 mM sodium acetate, 250 mM zinc acetate and 4% acetonitrile, pH 6.2, and was pumped through a 10 cm × 0.4 cm column (HR-80, C-18, particle size 3 μM, InChrom, Austria) at a flow rate of 1.0 mL/min, run at room temperature (23 °C). L-kynurenine was quantitated by HPLC coupled with UV detector at 365 nm. Mobile phase contained 0.1 M ammonium acetate, 0.1 M acetic acid, and 2% acetonitrile.26
Determination of KAT I and KAT II activities
KAT I and KAT II were determined by the method of Mason 195427 followed by modification.14,28 Briefly, the reaction mixture contained the homogenate, 2 μM L-kynurenine, 1 mM pyruvate, 70 μM pyridoxal 5′-phosphate and 150 mM AMPOL buffer, pH 9.6 (for KAT I) or 150 mM Tris-acetate buffer, pH 7.4 (for KAT II), in a total volume of 0.2 mL. After the incubation for 16 hrs at 37 °C (linearity of enzyme activity up to 18 hrs was ascertained in pilot experiments) the reaction was terminated by the addition of 10 μL of 50% TCA. Subsequently, 1 mL of 0.1 M HCl was added and denatured protein was removed by 10 min centrifugation. The supernatant was applied to a Dowex 50 W cation exchange column. Eluted kynurenic acid from the column was determined by HPLC method, as described above. The blanks were obtained by using tissue which has been heat inactivated for 30 min in a boiling water bath.
Protein determination
Protein was measured according to the method of Bradford (1976)29 using a commercially available kit (BIO-RAD) and bovine serum albumin as a standard.
Statistics
All data are presented as the means ± standard error of the mean. For statistical analyses, one-way ANOVA analysis of variance and a Student’s t-test were applied. Each sample was determined in duplicate or triplicate. The level for statistical significance was P < 0.05. *P < 0.05, **P < 0.01, and ***P < 0.001 indicate a significance compared with control group. Linear regression analysis was performed using the least squares methods. Correlation between kynurenine parameters, eg, between kynurenic acid and L- kynurenine or KAT I, KAT II, ratio KAT I/KAT II, and combined KAT I and KAT II was analyzed.
Results
Subgroups of HIV-1 infected patients
Among investigated HIV-1 infected patients, different pathologies were detected. The most frequent pathology was OPP (65%) followed by HIV (26%) then LY, INF, and GD (each 22%, respectively) (Table 1). Among different pathologies bronchopneumonia was present in all subgroups but frequently present in OPP and LY group (60% each group) and tuberculosis was present in all pathological subgroups, except of INF, but to lesser extent (Table 2).
Kynurenic acid in different pathologies after HIV-1 infection
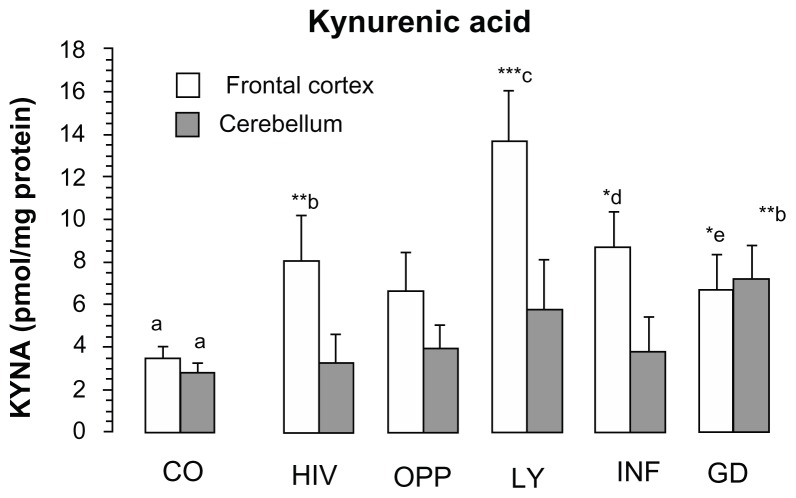
Kynurenic acid increased significantly in the frontal cortex of LY (392% of CO, P < 0.001), INF (247% of CO, P = 0.056), HIV (231% of CO, P < 0.01) and GD (193% of CO, P < 0.05) and in the cerebellum of GD (261% of CO, P < 0.01), (Fig. 1). No significant increase of kynurenic acid was found in the frontal cortex of OPP, and in the cerebellum of LY, OPP and INF. One-way analysis of variance (ANOVA) between the groups revealed the means of kynurenic acid statistically different in the frontal cortex (F = 2.4140, P = 0.050, one-way ANOVA, Fig. 1) and not statistically different in the cerebellum (F = 1.5210, P = 0.2050, one-way ANOVA, Fig. 1).
Figure 1.
Kynurenic acid level in the frontal cortex and in the cerebellum of different pathological sub-groups of patients after HIV-1 infection.
Notes: Values represent the mean ± SEM of following: Control (CO, n = 16); Pathological subgroups: HIV in brain tissue by immunocytochemistry (HIV, n = 6); opportunistic infection (OPP, n = 15); malignant lymphoma (LY, n = 5); infarction of brain (INF, n = 5) and glial dystrophy (GD, n = 5). Significance: *P < 0.05; **P < 0.01; ***P < 0.001 compared with control. Statistical analysis for frontal cortex: a, d and a, e indicate statistical significance at P < 0.05; a, b indicates statistical significance at P < 0.01; a, c indicates statistical significance at P < 0.001. Analysis of variance: F = 2.4140, P = 0.050. Statistical analysis for cerebellum: a,b indicates statistical significance at P < 0.01. One-way analysis of variance: F = 1.5210, P = 0.2030.
L-kynurenine in different pathologies after HIV-1 infection
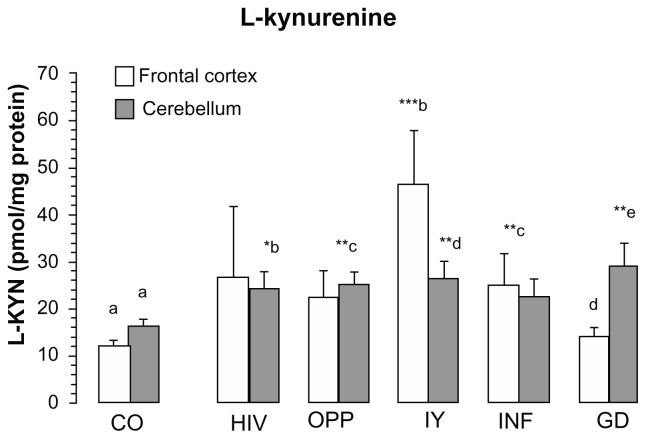
L-kynurenine increased significantly in the frontal cortex of LY (385% of CO, P = 0.001) and INF (206% of CO, P < 0.01) and in the cerebellum (between 147 and 177% of CO) of all pathologies, except of GD, (Fig. 2). One-way ANOVA between 6 groups revealed the means of L-kynurenine statistically different in the frontal cortex (F = 2.7017, P = 0.0319, one-way ANOVA, Fig. 2) and in the cerebellum (F = 2.9019, P = 0.0233, one-way ANOVA, Fig. 2).
Figure 2.
L-kynurenine content in frontal cortex and cerebellum of different pathological subgroups HIV-1 infection.
Notes: Values represent the mean ± SEM: Control (CO, n = 16); Pathological subgroups: HIV in brain tissue by immunocytochemistry (HIV, n = 6); opportunistic infection (OPP, n = 15); malignant lymphoma (LY, n = 5); infarction of brain (INF, n = 5) and glial dystrophy (GD, n = 5). Significance: *P < 0.05; **P < 0.01; ***P < 0.001 compared with control. Statistical analysis for frontal cortex: b, d indicate statistical significance at P < 0.05; a, c indicates statistical significance at P < 0.01; a, b indicates statistical significance at P < 0.001, analysis of variance: F = 2.7017, P = 0.0319. Statistical analysis for cerebellum: a, b indicates statistical significance at P < 0.05; a, c; a, d; a, e indicate statistical significance at P < 0.01, one-way analysis of variance: F = 2.9019, P = 0.0233.
KAT I activity in different pathologies after HIV-1 infection
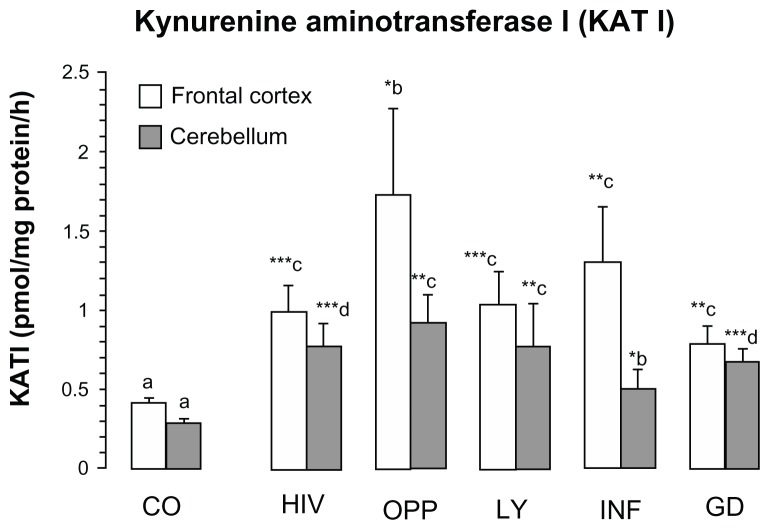
KAT I activity was significantly increased in the frontal cortex of all pathological subgroups, ie, OPP = 420% > INF > LY > HIV > GD = 192% of CO, respectively (Fig. 3). In the cerebellum of all pathological subgroups KAT I activity increased (OPP = 320% > LY, HIV > GD > INF = 192% of CO, Fig. 3) significantly, too, one-way ANOVA between 6 groups revealed no statistical difference in the means of KAT I activity in the frontal cortex (F = 1.9226, P = 0.1088, one-way ANOVA, Fig. 3), but statistically different in the cerebellum (F = 3.2938, P = 0.0126, one-way ANOVA, Fig. 3).
Figure 3.
Kynurenine aminotransferase I (KAT I) in the frontal cortex and cerebellum of different pathological subgroups of patients after HIV-1 infection.
Notes: Values represent the mean ± SEM of following groups: Control (CO, n = 16); Pathological subgroups: HIV in brain tissue by immunocytochemistry (HIV, n = 6); opportunistic infection (OPP, n = 15); malignant lymphoma (LY, n = 5); infarction of brain (INF, n = 5) and glial dystrophy (GD, n = 5). Significance: *P < 0.05; **P < 0.01; ***P < 0.001 compared with control. Statistical analysis for frontal cortex: a, b indicates statistical significance at P < 0.05; a, c indicates statistical significance at P < 0.001; analysis of variance: F = 1.9226, P = 0.1088. Statistical analysis for cerebellum: a, b indicates statistical significance at P < 0.05; a, c indicates statistical significance at P < 0.01, a, d indicates statistical significance at P < 0.001, one-way analysis of variance, F = 3.2938, P = 0.0126.
KAT II activities in different pathologies after HIV-1 infection
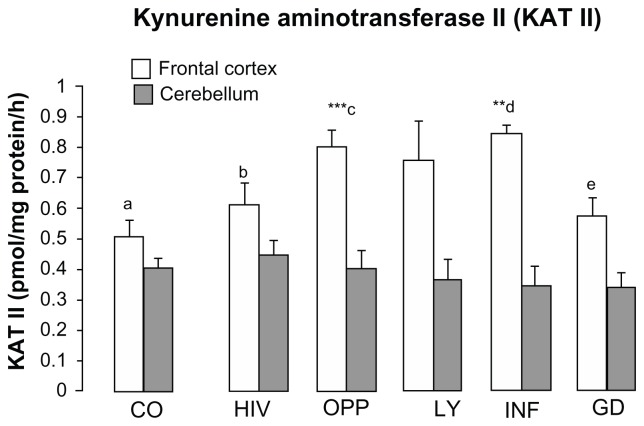
KAT II activity was moderately but significantly increased in the frontal cortex of INF and OPP, whereas in the cerebellum of HIV, OPP and LY, KAT II activity was comparable to control, while mildly reduced in INF and GD (Fig. 4). One-way ANOVA between 6 groups revealed the means of KAT II activity statistically different in the frontal cortex (F = 4.3664, P = 0.0025, one-way ANOVA, Fig. 4), but not statistically different in the cerebellum (F = 0.3238, P = 0.8961, one-way ANOVA, Fig. 4).
Figure 4.
Kynurenine aminotransferase II (KAT II) in the frontal cortex and cerebellum of different pathological subgroups of patients after HIV-1 infection.
Notes: Values represent the mean ± SEM of following groups: Control (CO, n = 16); Pathological subgroups: HIV in brain tissue by immunocytochemistry (HIV, n = 6); opportunistic infection (OPP, n = 15); malignant lymphoma (LY, n = 5); infarction of brain (INF, n = 5) and glial dystrophy (GD, n = 5). Significance: **P < 0.01; ***P < 0.001 compared with control Statistical analysis for frontal cortex: c, e indicates statistical significance at P < 0.05; b, d indicates statistical significance at P < 0.02; a, d indicates statistical significance at P < 0.01; d, e indicates statistical significance at P < 0.003; a, c indicates statistical significance at P < 0.001, analysis of variance: F = 4.366, P = 0.002. Statistical analysis for cerebellum; one-way analysis of variance, F = 0.3238, P = 0.8960.
Kynurenic acid metabolism in the brain of subjects with bronchopneumonia
Three control cases with bronchopneumonia had abnormal L-kynurenine parameters in the brain (Table 3). A marked increase of kynurenic acid level was found in the frontal cortex (383% of CO, P < 0.01), but a tendency towards decreased kynurenic acid was observed in the cerebellum. On the contrary to KAT II, KAT I activity was significantly increased in the frontal cortex (877% of CO, P < 0.01) and cerebellum (479% of CO; P < 0.05), (Table 3).
Table 3.
Kynurenic acid levels and activity of KAT I and KAT II in the frontal cortex and cerebellum of 3 patients with bronchopneumonia.
| Brain region | KYNA | KAT I | KAT II |
|---|---|---|---|
| Frontal cortex expressed in % | 13.383 ± 2.290 (383% of CO)** | 3.603 ± 1.226 (877% of CO)** | 0.511 ± 0.028 (101% of CO) |
| Cerebellum expressed in % | 2.117 ± 0.005 (76% of CO) | 1.371 ± 0.680 (479% of CO)* | 0.513 ± 0.168 (127% of CO) |
Notes: Values represent the mean ± SEM. Significance:
P < 0.05;
P < 0.01 compared with control (CO).
Values of CO parameters in the frontal cortex (n = 16) and cerebellum (n = 16) for KYNA were 3.49 ± 0.55 and 2.77 ± 0.63 (pmol/mg protein), respectively; for KAT I were 0.41 ± 0.04 and 0.29 ± 0.03 (pmol/mg protein/h), respectively; for KAT II were 0.51 ± 0.06 and 0.40 ± 0.06 (pmol/mg protein/h), respectively.
Correlation between kynurenic acid and L-kynurenine in the frontal cortex and cerebellum
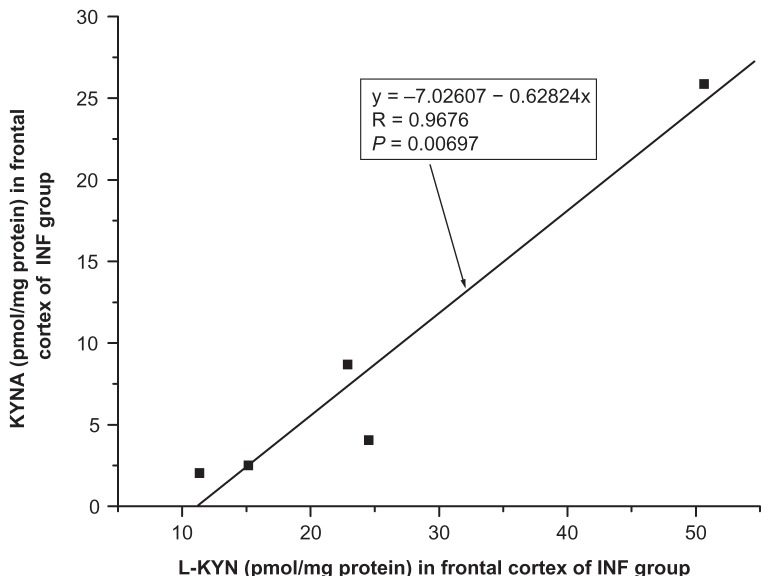
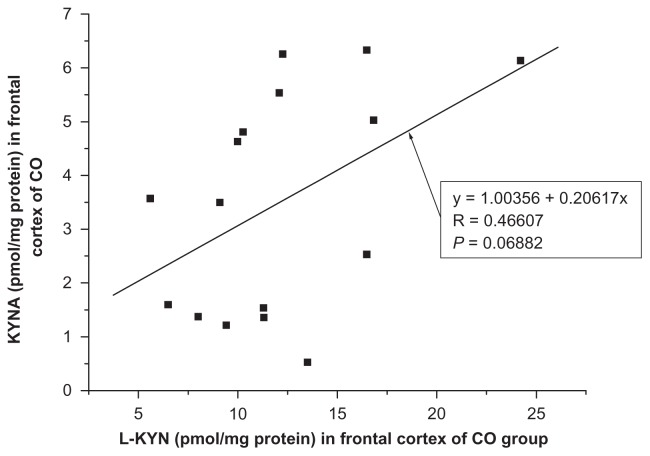
A positive correlation between kynurenic acid and L-kynurenine was found in the frontal cortex of INF group (R = 0.9676, F = 44.0554, P = 0.0069, one-way ANOVA, Fig. 5) and no significant correlation between kynurenic acid and L-kynurenine was seen in the frontal cortex of remaining groups ie, HIV (R = −0.5986, F = 2.2339, P = 0.2093); OPP (R = −0.0921, F = 0.1112, P = 0.7442); LY (R = 0.4795, F = 0.8956, P = 0.4138); GD (R = 0.6270, F = 1.9436, P = 0.2576) and of CO (R = 0.0688, F = 3.8851, P = 0.0688, one-way ANOVA, Fig. 6). Also, no significant correlation of kynurenic acid and L-kynurenine was seen in the cerebellum of CO (R = −0.1609, F = 0.3723, P = 0.5515); HIV (R = 0.1289, F = 0.0068, P = 0.8076); OPP (R = 0.0037, F = 0.0018, P = 0.9896); LY (R = 0.2975, F = 0.2912, P = 0.6269); INF (R = 0.3137, F = 0.3275, P = 0.6072) and GD (R = 0.4508, F = 0.7653, P = 0.4461), using one-way ANOVA.
Figure 5.
Relationship between kynurenic acid (KYNA) and L-kynurenine (L-KYN) in the frontal cortex of infarction of brain (INF, n = 5) group, one-way analysis of variance, F = 44.0554.
Figure 6.
Relationship between kynurenic acid (KYNA) and L-kynurenine (L-KYN) concentration in the frontal cortex of control (CO, n = 16) group, one-way analysis of variance, F = 3.88506.
Correlation between kynurenic acid and KAT I in the frontal cortex and cerebellum
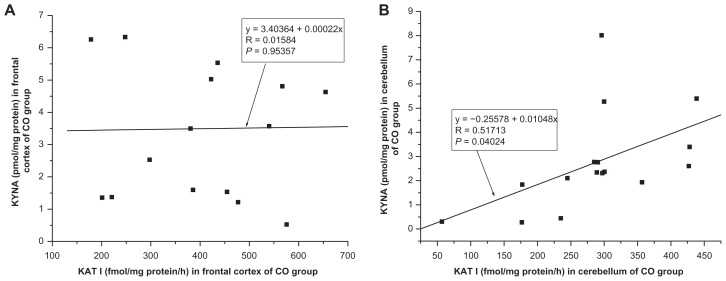
No significant correlation was found between kynurenic acid level and KAT I activity in the frontal cortex of CO (R = 0.0158, F = 0.0035, P = 0.9536, one-way ANOVA, Fig. 7A) and of pathological groups ie, HIV (R = −0.1794, F = 0.1331, P = 0.7338); OPP (R = −0.0940, F = 0.1159, P = 0.7389), LY (R = 0.0233, F = 0.0016, P = 0.9703); INF (R = −0.0789, F = 0.0188, P = 0.8997) and GD (R = −0.4018, F = 0.5025, P = 0.5025) using one-way ANOVA. No significant correlation was seen between kynurenic acid level and KAT I activity in the cerebellum of HIV (R = 0.2786, F = 0.3366, P = 0.5929); OPP (R = −0.1728, F = 0.4002, P = 0.5379); LY (R = 0.6836, F = 2.6318, P = 0.2032); INF (R = −0.4050, F = 0.5888, P = 0.4987) and GD (R = −0.0488, F = 0.0072, P = 0.9379) except for significant correlation between kynurenic acid and KAT I in the cerebellum of CO (R = 0.5171, F = 6.1106, P = 0.0402, one-way ANOVA, Fig. 7B).
Figure 7.
(A and B) Relationship between kynurenic acid (KYNA) level and kynurenine aminotransferase I (KAT I) activity in the frontal cortex, one-way analysis of variance, F = 0.00351 (A) and in the cerebellum, one-way analysis of variance, F = 5.11059 (B), of control (CO, n = 16) group.
Correlation between kynurenic acid and KAT II in the frontal cortex and cerebellum
No significant correlation was observed between kynurenic acid level and KAT II activity in the frontal cortex of CO (R = 0.0103, F = 0.1501, P = 0.7042) and of all pathological subgroups ie, HIV (R = −0.2036, F = 0.1730, P = 0.6988), OPP (R = 0.2529, F = 0.8887, P = 0.3630); LY (R = 0.6945, F = 2.7952, P = 0.1931); INF (R = 0.3462, F = 0.4085, P = 0.5682) and GD (R = 0.0745, F = 0.0167, P = 0.9052) using one-way ANOVA. In addition, no significant correlation was found between kynurenic acid level and KAT II activity in the cerebellum of CO (R = 0.1392, F = 0.2767, P = 0.6071) and pathological subgroups HIV (R = −0.0506, F = 0.0103, P = 0.9242); 0PP (R = −0.1547, F = 0.3187, P = 0.5820); LY (R = −0.4748, F = 0.8732, P = 0.4190); INF (R = 0.3959, F = 0.55766, P = 0.5094) and GD (R = −0.2944, F = 0.2848, P = 0.6306), using one-way ANOVA.
Relationship between KAT I and KAT II in the frontal cortex and cerebellum
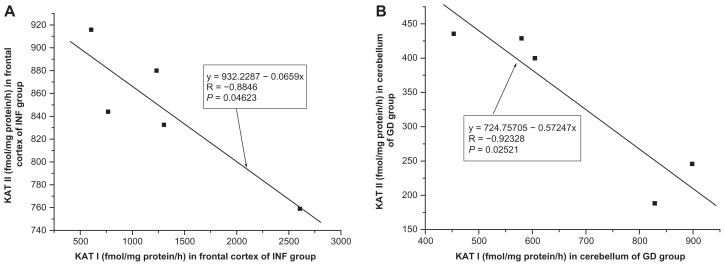
A significant correlation was found between KAT II and KAT I in the frontal cortex of INF (R = −0.8846, F = 10.7948, P = 0.0462, one-way ANOVA, Fig. 8A), a moderate correlation was found between KAT II and KAT I in the frontal cortex of GD (R = −0.7943, F = 5.1269, P = 0.1085) and of CO (R = 0.4219, F = 3.0313, P = 0.1036), and no significant correlation was seen in the frontal cortex of OPP (R = −0.3336, F = 1.6285, P = 0.2242); HIV (R = −0,1561, F = 0.0999, P = 0.7677) and LY (R = 0.0182, F = 0.9768, P = 0.9768), using one-way ANOVA. In the cerebellum, a correlation was stated between KAT I and KAT II of GD (R = −0.92328, F = 17.3318, P = 0.0252, one-way ANOVA, Fig. 8B) and a moderate correlation between KAT I and KAT II was seen in the cerebellum of HIV (R = 0.6799, F = 3.4400, P = 0.1372). No significant correlation was observed between KAT I and KAT II in the cerebellum of CO (R = 0.1963, F = 0.5614, P = 0.4661); OPP (R = 0.0452, F = 0.0266, P = 0.8729); LY (R = −0.1757, F = 0.0956, P = 0.7774) and INF (R = 0.3997, F = 0.5705, P = 0.5049), using one-way ANOVA.
Figure 8.
(A) Relationship between kynurenine aminotransferase II (KAT II) and kynurenine aminotransferase I (KAT I) in the frontal cortex of infarction of brain (INF, n = 5) group, one-way analysis of variance, F = 10.79478. (B) Relationship between kynurenine aminotransferase II (KAT II) and kynurenine aminotransferase I (KAT I) in the cerebellum of glial dystrophy (GD, n = 5) group, one-way analysis of variance, F = 17.3318.
Correlation between kynurenic acid and ratio KAT I/KAT II in the frontal cortex and cerebellum
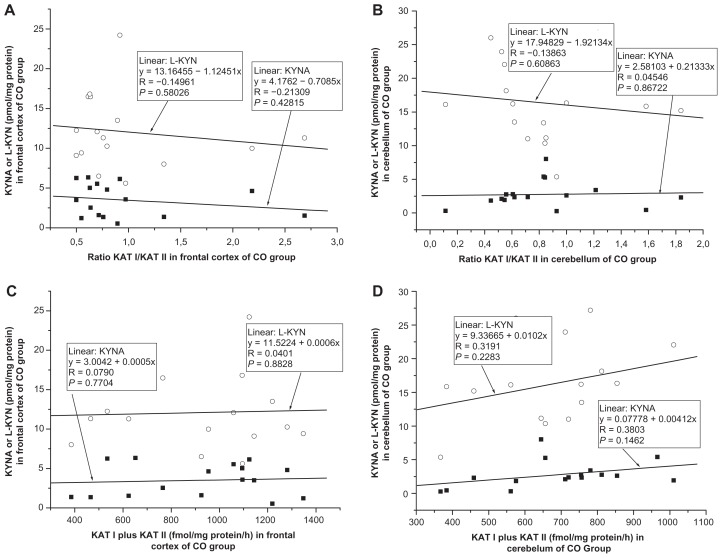
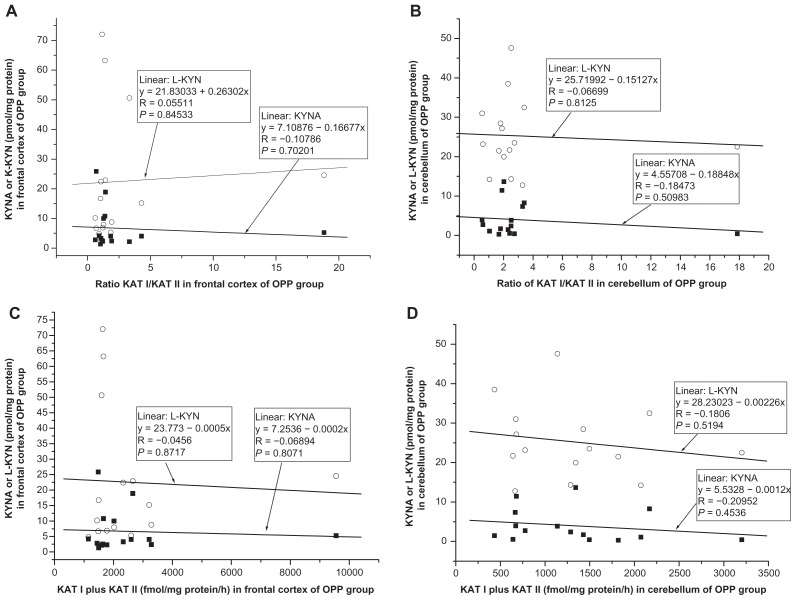
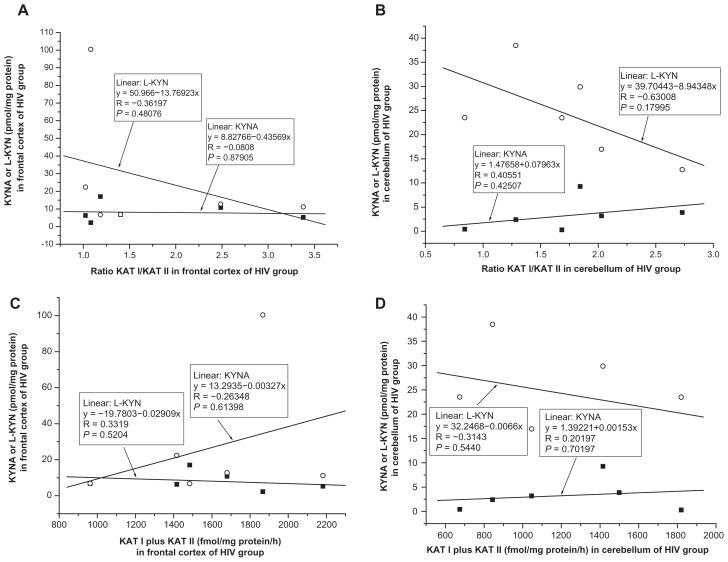
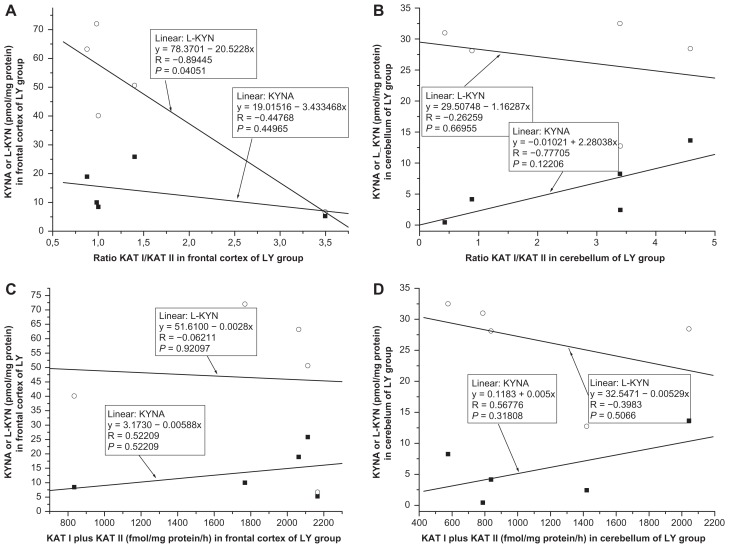
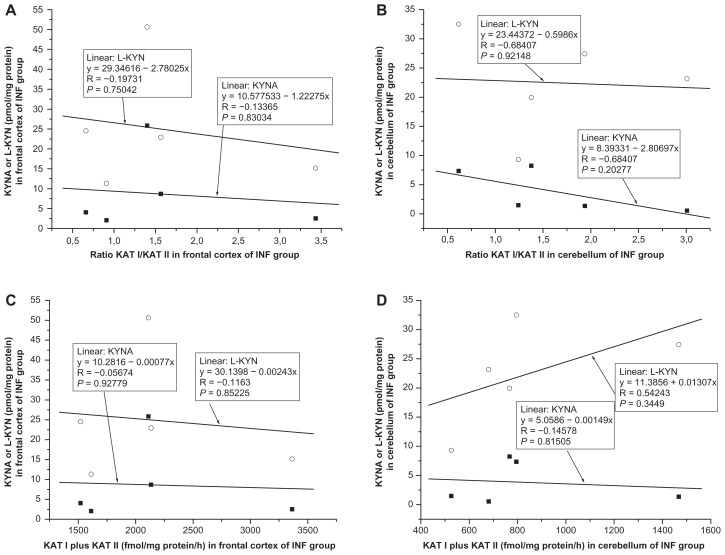
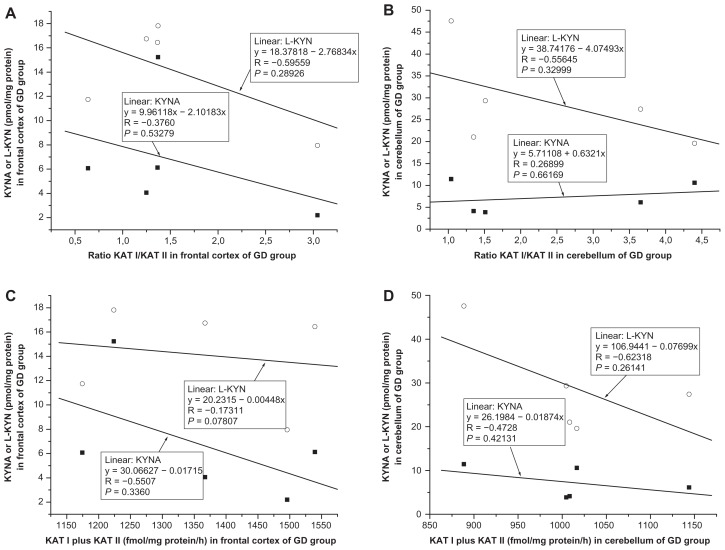
No significant correlation was found between kynurenic acid and ratio KAT I/KAT II in the frontal cortex of CO (R = −0.2130, F = 0.6652, P = 0.4281, Fig. 9A); OPP (R = −0.1077, F = 0.1530, P = 0.7020, Fig. 10A), HIV (R = −0.0808, F = 0.0263, P = 0.8791, Fig. 11A); LY (R = −0.4477, F = 0.7519, P = 0.4496, Fig. 12A); INF (R = −0.1336, F = 0.0545, P = 0.8303, Fig. 13A) and GD (R = −0.5121, F = 0.4939, P = 0.5327, Fig. 14A), using one-way ANOVA. No significant correlation was observed between kynurenic acid levels and ratio KAT I/KAT II in the cerebellum of CO (R = 0.0455, F = 0.0290, P = 0.8672, Fig. 9B); OPP (R = −0.1847, F = 0.4593, P = 0.5098 Fig. 10B); HIV (R = 0.4055, F = 0.7872, P = 0.4250, Fig. 11B); INF (R = −0.6841, F = 2.6385, P = 0.2028, Fig. 13B) and GD (R = 0.2689, F = 0.66169, P = 0.6617, Fig. 14B), using one-way ANOVA, and only a moderate relationship between kynurenic acid and ratio KAT I/KAT II could be seen in the cerebellum of LY (R = 0.7770, F = 4.57207, P = 0.12206, Fig. 12B).
Figure 9.
(A and B) Relationship between kynurenic acid (KYNA) or L-kynurenine (L-KYN) and ration of kynurenine aminotransferase I (KAT I)/kynurenine aminotransferase I (KAT I) in the frontal cortex (A) and cerebellum (B) of control (CO, n = 16) group, using one-way analysis of variance. (C and D) Relationship between kynurenic acid (KYNA) or L-kynurenine (L-KYN) and combined activity of kynurenine aminotransferase I (KAT I) and kynurenine aminotransferase II (KAT II) in the frontal cortex (C) and cerebellum (D) of control (CO, n = 16) group, using one-way analysis of variance.
Figure 10.
(A and B) Relationship between kynurenic acid (KYNA) or L-kynurenine (L-KYN) and ration of kynurenine aminotransferase I (KAT I)/kynurenine aminotransferase I (KAT I) in the frontal cortex (A) and cerebellum (B) of opportunistic infection (OPP, n = 15) group, using one-way analysis of variance. (C and D) Relationship between kynurenic acid (KYNA) or L-kynurenine (L-KYN) and combined activity of kynurenine aminotransferase I (KAT I) and kynurenine aminotransferase II (KAT II) in the frontal cortex (C) and in the cerebellum (D) of opportunistic infection (OPP, n = 15) group, using one-way analysis of variance.
Figure 11.
(A and B) Relationship between kynurenic acid (KYNA) or L-kynurenine (L-KYN) and ration of kynurenine aminotransferase I (KAT I)/kynurenine aminotransferase I (KAT I) in the frontal cortex (A) and cerebellum (B) of HIV-1 in brain tissue as found by anti-HIV immunocytochemistry (HIV, n = 6) group, using one-way analysis of variance. (C and D) Relationship between kynurenic acid (KYNA) or L-kynurenine (L-KYN) and combined kynurenine aminotransferase I (KAT I) and kynurenine aminotransferase II (KAT II) in the frontal cortex (C) cerebellum (D) of HIV-1 in brain tissue as found by anti-HIV immunocytochemistry (HIV, n = 6) group, using one-way analysis of variance.
Figure 12.
(A and B) Relationship between kynurenic acid (KYNA) or L-kynurenine (L-KYN) and ration of kynurenine aminotransferase I (KAT I)/kynurenine aminotransferase I (KAT I) in the frontal cortex (A) and cererbellum (B) of malignant lymphoma (LY, n = 5) group, using one-way analysis of variance. (C and D) Relationship between kynurenic acid (KYNA) or L-kynurenine (L-KYN) and combined activity of kynurenine aminotransferase I (KAT I) and kynurenine aminotransferase II (KAT II) in the frontal cortex (C) and cerebellum (D) of malignant lymphoma (LY, n = 5) group, using one-way analysis of variance.
Figure 13.
(A and B) Relationship between kynurenic acid (KYNA) or L-kynurenine (L-KYN) and ration of kynurenine aminotransferase I (KAT I)/kynurenine aminotransferase I (KAT I) in the frontal cortex (A) and cerebellum (B) of infarction of brain (INF, n = 5) group, using one-way analysis of variance. (C and D) Relationship between kynurenic acid (KYNA) or L-kynurenine (L-KYN) and combined kynurenine aminotransferase I (KAT I) and kynurenine aminotransferase II (KAT I)) in the frontal cortex (C) and cerebellum (D) of infarction of brain (INF, n = 5) group, using one-way analysis of variance.
Figure 14.
(A and B) Relationship between kynurenic acid (KYNA) or L-kynurenine (L-KYN) and ration of kynurenine aminotransferase I (KAT I)/kynurenine aminotransferase I (KAT I) in the frontal cortex (A) and cerebellum (B) of glial dystrophy (GD, n = 5) group, using one-way analysis of variance. (C and D) Relationship between kynurenic acid (KYNA) or L-kynurenine (L-KYN) and combined activity of kynurenine aminotransferase I (KAT I) and kynurenine aminotransferase II (KAT II) in the frontal cortex (C) and cerebellum (D) of glial dystrophy (GD, n = 5) group, using one-way analysis of variance.
Correlation between L-kynurenine and ratio KAT I/KAT II in the frontal cortex and cerebellum
No relationship was found between L-kynurenine and ratio KAT I/KAT II in the frontal cortex of CO (R = −0.1496, F = 0.3200, P = 0.5802, Fig. 9A); OPP (R = 0,0551, F = 0.0396, P = 0.8453, Fig. 10A), HIV (R = −0.3619, F = 0.6031, P = 0.4807, Fig. 11A); INF (R = −0.1973, F = 1215, P = 0.7504, Fig. 13A), and GD (R = −0.5956, F = 1.6492, P = 0.2893, Fig. 14A), using one-way ANOVA, but a correlation between L-kynurenine and ratio KAT I/KAT II was stated in the frontal cortex of LY (R = −0.8944, F = 12,0033, P = 0.0405, Fig. 12A). No significant correlation was observed between L-kynurenine levels and ratio KAT I/KAT II in the cerebellum of CO (R = −0.1386, F = 0.2743, P = 0.6086, Fig. 9B); OPP (R = −0.0669, F = 0.0586, P = 0.8125, Fig. 10B); LY (R = −0.2626, F = 0.2222, P = 0.6695, Fig. 12B); INF (R = −0.0617, F = 0.0115, P = 0.9215, Fig. 13B), and GD (R = −0.5564, F = 1.3455, P = 0.3299, Fig. 14B), using one-way ANOVA, and only a moderate relationship between L-kynurenine and ratio KAT I/KAT II was seen in the cerebellum of HIV (R = −0.6301, F = 2.6335, P = 0.1799, one-way ANOVA, Fig. 11B).
Relationship between kynurenic acid or L- kynurenine and combined KAT I and KAT II activities in the frontal cortex and cerebellum
Correlation between kynurenic acid or L- kynurenine and combined with KAT I and KAT II in the frontal cortex and cerebellum of all groups was analyzed using one-way ANOVA, and data are presented in Figure 9C and D; Figure 10C and D; Figure 11C and D; Figure 12C and D; Fig 13C and D; and Figure 14C and D.
High levels of KAT I/KAT II or high levels of combined KAT I and KAT II were associated with high kynurenic acid level and low L-kynurenine in the frontal cortex (Fig. 11A and C) and cerebellum (Fig. 11B and D) of HIV group, and also in the frontal cortex (Fig. 12C) and cerebellum (Fig. 12B and D) of LY group and in cerebellum of GD group (Fig. 14B). Whereas in the frontal cortex and cerebellum of OPP, INF and GD, high levels of KAT I/KAT II or high levels of combined KAT I and KAT II were associated with lower L-kynurenine levels and no changes of kynurenic acid or even moderate reduction, but this association could not be statistically proved.
One-way ANOVA between post mortem time or length of disease and kynurenic acid or L-kynurenine or KATs revealed no statistically significant correlation.
Discussion
We have previously reported increased kynurenic acid metabolism in the brain after HIV-1 infection.11 Our results corroborate the findings of Heyes on increased kynurenic acid levels in the cerebrospinal fluid.4,5 The present study extends the information on kynurenine metabolism in the brain considering the different types of pathology found after HIV-1 infection ie, HIV, OPP, INF, LY and GD.20 The most frequent pathology was OPP (65%) followed by HIV (26%), LY (22%), INF (22%) and GD (22%). These observations are in line with previously published data.19–21 An enhancement of kynurenic acid was present in the frontal cortex of all subgroups; however, the highest levels were measured in the LY, INF, and HIV. In contrast, in the cerebellum a significantly increased kynurenic acid content was seen only in the GD group, whereas in other pathological groups like LY it was moderately enhanced and in the OPP, INF and HIV it was comparable to controls. The fact that different increases of kynurenic acid synthesis in the brain of HIV-1 infected patients may reflect several different reasonable conditions for its synthesis, including different pathologies. In addition, a weakening of the blood brain barrier in AIDS brain20 might account for increased kynurenic acid permeation and of other metabolites, including L-kynurenine.30 Furthermore, chronic immune stimulation of the brain with widespread microglia and astroglial activation may lead to excessive γ-interferon production1,3,31 and subsequently induction of tryptophan metabolism, followed by an increase of L-kynurenine and enhancement of kynurenic acid levels in the brain.23 Experimental data provides significant evidence that the increase of kynurenic acid easily takes place due to elevated L-kynurenine levels.23,32 Indeed, our data revealed an increase of L-kynurenine in the frontal cortex of all pathologies, markedly of LY. However, the positive correlation between L-kynurenine and kynurenic acid was found in the frontal cortex of INF, LY, GD and CO, while negative correlation was stated in the frontal cortex of HIV and OPP. This might have an impact on the high ration of quinolinic acid/kynurenic acid shown in the CNS of HIV infected patients.4,5 In the cerebellum of all pathologies, the content of L-kynurenine was enhanced moderately and significantly. The content of kynurenic acid, however, increased only in GD and LY and not in the HIV, OPP or INF. This finding allowed us to speculate the involvement of L-kynurenine in the synthesis of quinolinic acid rather than in the formation of kynurenic acid. Besides L-kynurenine involvement, other biochemical events have an impact on kynurenic acid formation. Enzymes responsible for kynurenic acid formation, KAT I and KAT II, are significantly and differently altered in the frontal cortex and cerebellum of all pathologies. Whereas, KAT I activity increased significantly in the frontal cortex and cerebellum of all pathologies, KAT II elevation was found only in the frontal cortex of INF and OPP. Interestingly, changes of kynurenic acid, L-kynurenine, KAT I and KAT II in the frontal cortex and cerebellum of INF group correlated well with published data of INF but not-HIV-1 subject.14 Analysis on the relationship between kynurenic acid level and KAT I or KAT II activity changes in frontal cortex and cerebellum of all pathologies, however, revealed significant positive correlation between kynurenic acid level and KAT I activity only in the cerebellum of CO.
Surprisingly, analysis on the relationship between KAT II and KAT I activity revealed negative correlation between them in the frontal cortex of INF and GD, and in the cerebellum of GD, in comparison to positive correlation between KAT II and KAT I in the frontal cortex and cerebellum of CO group. A positive correlation between KAT II and KAT I activity was observed in the cerebellum of HIV. In order to find more understanding in the difference between pathological subgroups, the relationship between the ration of KA I/KAT II or combined activity of KAT I and KAT II, and kynurenic acid or L-kynurenine was analyzed. Interestingly, in the frontal cortex and cerebellum of the HIV and LY group, we found association between high enzyme activity and increased kynurenic acid and lower L-kynurenine. Whereas, in the frontal cortex and cerebellum of GD group, the high ratios of KAT I/KAT II were associated with low L-kynurenine and low kynurenic acid. Furthermore, in the frontal cortex and cerebellum of CO and OPP group, both L-kynurenine and kynurenic acid were not or only moderately associated with high ratio of KAT I/KAT II. This data is interesting and might have a functional meaning, however further study with a higher number of pathological cases are necessary to prove this observation.
The highest increases of KAT I (460% of CO) and KAT II (160% of CO) found in the frontal cortex of OPP were accompanied by moderate increase of kynurenic acid levels. It is not known if widespread reactive astrocytosis in the human HIV-1 brain and elevated KAT I activity are common occurrences. It has been noted previously that in the putamen and caudate nucleus of Alzheimer diseased brains, KAT I activity is increased.14 Interestingly, these regions are both characterized by astrocytosis.33,49 It is therefore questionable if common insight exists between the noticed increases in KAT I activity and astrocytosis in the frontal cortex of HIV-1 patients.20,34 Marked elevation of KAT I activity in the brain indicates activation and/or proliferations of astrocytes.20 On the other hand, if we believe that KAT II is the enzyme which affects physiological functions, its increase in the frontal cortex, particularly of OPP and INF, might have adaptive physiological functions after HIV-1 infection, on contrary to lacking increase of KAT II in the cerebellum.
Bronchopneumonia, lobar pneumonia, oedema of the lung, or tuberculosis occurs frequently after HIV-1 infection, an observation in line with previously published data.35,36 Our data for the first time demonstrates a marked increase of KAT I in the frontal cortex and cerebellum of non-HIV infected subjects (control cases) with pathology of bronchopneumonia. These observations allow us to postulate that pneumonia and/or bronchopneumonia might have a significant impact on kynurenic acid metabolism in the CNS. No increase of KAT II activity has been seen in the brains of these patients with bronchopneumonia and, in good correlation, among pathological HIV-1 subgroups the increase of KAT II was only moderate. Furthermore, in the model of encephalomyocarditis (EMCV) by piglets, after infection with Picornea virus, we found breeding difficulty, circulation insufficiency, depression, and a marked increase of kynurenic acid levels in the blood.37 It has also been found that the infection with Picornea virus is accompanied by increased kynurenic acid, but not by dramatic changes of enzyme activity in the brain, at least in the acute phase. Furthermore, the disease was characterized by high lethality of piglets.37,38 An increased kynurenic acid level in the brain or serum seems to be a confounding factor related to lethality by HIV-1 patients, too. A high mortality has been reported in patients infected with HIV-1 virus21 and this may be related to increased kynurenic acid, which plays a pivotal role with respect to cardio-respiratory function. In our previous study, we have shown that an increase in kynurenic acid lowered oxygen consumption of the heart mitochondria and ATP synthesis.39 In addition, another study showed that a deficit in oxygen, due to asphyxia, caused a marked increase of kynurenic acid in the brain.40 Also of interest is the finding that the longer the period of oxygen deficit, the higher the lethality and the higher the observed peak of kynurenic acid in the brain.40
A growing amount of data indicates that increased kynurenic acid formation in the brain is involved in the development of neuropsychiatric diseases, such as Alzheimer’s, Downs Syndrome, and Schizophrenia and dementia.14,41–43 A high probability for development of dementia due to CNS lymphoma in the CNS has been described.44 The occurrence of dementia in HIV-1 patients with INF44 has been reported, too, and elderly people with silent brain infarcts have an increased risk of dementia.45 In this line, increased kynurenic acid has been found in the CSF of elderly patients.15 Additionally, in the other subgroup of pathology, like OPP or HIV, the development of dementia and/or cognitive impairment have been well documented.19–21,46 Thus, a marked and permanent increase of kynurenic acid in the frontal cortex of LY might have contributed to the development of dementia. In this regard, the action of antidementia agent Cerebrolysin47,48 involves lowering of kynurenic acid formation in the human brain,15 although its mechanism of action needs to be still clarified. It is important to mention that also quinolinic acid plays a crucial role in the development of dementia after HIV-1 infection.8 Unfortunately quinolinic acid was not investigated in this study due to limited capacity of HPLC method.
In summary, the present data demonstrates differences in kynurenic acid metabolism of the frontal cortex and cerebellum among different pathological groups of HIV-1 patients. OPP was the most frequent pathology with relatively selective alterations of kynurenine metabolites. The neurochemical changes seen in the brains of different pathological groups after HIV-1 infection correlates in part with the neurochemical changes described by different neurological conditions. We suggest that modulation of kynurenic acid synthesis by lowering kynurenic acid synthesis supports the cardio-respiratory system and acts, at least in part, as an antidementia agent. However, it is still questionable if conditions related to respiratory deficits, dementia and lethality share dose dependent involvement when it comes to the increased kynurenic acid metabolism observed.
Acknowledgments
We thank Prof. Dr. H. Budka for supporting this project. We also express our thank to Dr. Mazal for support in evaluation of pathology. The study was performed in part at the Neurochemical Laboratory of the Department for Neurology, Medical University Vienna & Vienna General Hospital.
Footnotes
Author Contributions
Conceived and designed the experiments: H.B. Analysed the data: H.B and J.A.H. Wrote the first draft of the manuscript: H.B. Contributed to the writing of the manuscript: J.A.H and B.K. Agree with manuscript results and conclusions: H.B., J.B.K., B.K. Jointly developed the structure and arguments for the paper: H.B., J.B.K., B.K. Made critical revisions and approved final version: H.B., J.B.K., B.K. All authors reviewed and approved of the final manuscript.
Competing Interests
Author(s) disclose no potential conflicts of interest.
Disclosures and Ethics
As a requirement of publication author(s) have provided to the publisher signed confirmation of compliance with legal and ethical obligations including but not limited to the following: authorship and contributorship, conflicts of interest, privacy and confidentiality and (where applicable) protection of human and animal research subjects. The authors have read and confirmed their agreement with the ICMJE authorship and conflict of interest criteria. The authors have also confirmed that this article is unique and not under consideration or published in any other publication, and that they have permission from rights holders to reproduce any copyrighted material. Any disclosures are made in this section. The external blind peer reviewers report no conflicts of interest.
Funding
This study was supported in part by grant of Austrian Science Research Fund (FWF) HOO 43-Med to HB and in part of grant of Life Science Krems 10-032 to BK and HB.
References
- 1.Fuchs D, Forsman A, Hagberg L, et al. Immune activation and decreased tryptophan in patients with HIV-1 infection. J Interferon Res. 1990 Dec;10(6):599–603. doi: 10.1089/jir.1990.10.599. [DOI] [PubMed] [Google Scholar]
- 2.Fuchs D, Möller AA, Reibnegger G, Stöckle E, Werner ER, Wachter H. Decreased serum tryptophan in patients with HIV-1 infection correlates with increased serum neopterin and with neurologic/psychiatric symptoms. J Acquir Immune Defic Syndr. 1990;3(9):873–6. [PubMed] [Google Scholar]
- 3.Stone TW. Neuropharmacology of quinolinic and kynurenic acids. Pharmacol Rev. 1993 Sep;45(3):309–79. [PubMed] [Google Scholar]
- 4.Heyes MP, Brew BJ, Saito K, et al. Inter-relationships between quinolinic acid, neuroactive kynurenines, neopterin and beta 2-microglobulin in cerebrospinal fluid and serum of HIV-1-infected patients. J Neuroimmunol. 1992 Sep;40(1):71–80. doi: 10.1016/0165-5728(92)90214-6. [DOI] [PubMed] [Google Scholar]
- 5.Heyes MP, Saito K, Crowley JS, et al. Quinolinic acid and kynurenine pathway metabolism in inflammatory and non-inflammatory neurological disease. Brain. 1992 Oct;115(Pt 5):1249–73. doi: 10.1093/brain/115.5.1249. [DOI] [PubMed] [Google Scholar]
- 6.Giulian D, Vaca K, Noonan CA. Secretion of neurotoxins by mononuclear phagocytes infected with HIV-1. Science. 1990 Dec 14;250(4987):1593–6. doi: 10.1126/science.2148832. [DOI] [PubMed] [Google Scholar]
- 7.Magnuson DS, Knudsen BE, Geiger JD, Brownstone RM, Nath A. Human immunodeficiency virus type 1 tat activates non-N-methyl-D-aspartate excitatory amino acid receptors and causes neurotoxicity. Ann Neurol. 1995 Mar;37(3):373–80. doi: 10.1002/ana.410370314. [DOI] [PubMed] [Google Scholar]
- 8.Guillemin GJ, Wang L, Brew BJ. Quinolinic acid selectively induces apoptosis of human astrocytes: potential role in AIDS dementia complex. J Neuroinflammation. 2005 Jul 26;2:16. doi: 10.1186/1742-2094-2-16. [DOI] [PMC free article] [PubMed] [Google Scholar]
- 9.Heyes MP, Saito K, Markey SP. Human macrophages convert L-tryptophan into the neurotoxin quinolinic acid. Biochem J. 1992 May 1;283(Pt 3):633–5. doi: 10.1042/bj2830633. [DOI] [PMC free article] [PubMed] [Google Scholar]
- 10.Lipton SA. Neuronal injury associated with HIV-1: approaches to treatment. Annu Rev Pharmacol Toxicol. 1998;38:159–77. doi: 10.1146/annurev.pharmtox.38.1.159. [DOI] [PubMed] [Google Scholar]
- 11.Baran H, Hainfellner JA, Kepplinger B, Mazal PR, Schmid H, Budka H. Kynurenic acid metabolism in the brain of HIV-1 infected patients. J Neural Transm. 2000;107(10):1127–38. doi: 10.1007/s007020070026. [DOI] [PubMed] [Google Scholar]
- 12.Foster AC, Vezzani A, French ED, Schwarcz R. Kynurenic acid blocks neurotoxicity and seizures induced in rats by the related brain metabolite quinolinic acid. Neurosci Lett. 1984 Aug 10;48(3):273–8. doi: 10.1016/0304-3940(84)90050-8. [DOI] [PubMed] [Google Scholar]
- 13.Andiné P, Lehmann A, Ellrén K, et al. The excitatory amino acid antagonist kynurenic acid administered after hypoxic-ischemia in neonatal rats offers neuroprotection. Neurosci Lett. 1988 Jul 19;90(1–2):208–12. doi: 10.1016/0304-3940(88)90813-0. [DOI] [PubMed] [Google Scholar]
- 14.Baran H, Jellinger K, Deecke L. Kynurenine metabolism in Alzheimer’s disease. J Neural Transm. 1999;106(2):165–81. doi: 10.1007/s007020050149. [DOI] [PubMed] [Google Scholar]
- 15.Kepplinger B, Baran H, Kainz A, Ferraz-Leite H, Newcombe J, Kalina P. Age-related increase of kynurenic acid in human cerebrospinal fluid— IgG and beta2-microglobulin changes. Neurosignals. 2005;14(3):126–35. doi: 10.1159/000086295. [DOI] [PubMed] [Google Scholar]
- 16.Baran H, Kepplinger B. Cerebrolysin lowers kynurenic acid formation—an in vitro study. Eur Neuropsychopharmacol. 2009 Mar;19(3):161–8. doi: 10.1016/j.euroneuro.2008.09.003. Epub Nov 12, 2008. [DOI] [PubMed] [Google Scholar]
- 17.Pocivavsek A, Wu HQ, Potter MC, Elmer GI, Pellicciari R, Schwarcz R. Fluctuations in endogenous kynurenic acid control hippocampal glutamate memory. Neuropsychopharmacology. 2011 Oct;36(11):2357–67. doi: 10.1038/npp.2011.127. Epub Jul 27, 2011. [DOI] [PMC free article] [PubMed] [Google Scholar]
- 18.Alkondon M, Pereira EF, Eisenberg HM, Kajii Y, Schwarcz R, Albuquerque EX. Age dependency of inhibition of alpha7 nicotinic receptors tonically active N-methyl-D-aspartate receptors by endogenously produced kynurenic acid in the brain. J Pharmacol Exp Ther. 2011 Jun;337(3):572–582. doi: 10.1124/jpet.110.177386. Epub Jan 26, 2011. [DOI] [PMC free article] [PubMed] [Google Scholar]
- 19.Budka H, Costanzi G, Cristina S, et al. Brain pathology induced by infection with the human immunodeficiency virus (HIV). A histological, immunocytochemical, and electron microscopical study of 100 autopsy cases. Acta Neuropathol. 1987;75(2):185–98. doi: 10.1007/BF00687080. [DOI] [PubMed] [Google Scholar]
- 20.Budka H. Neuropathology of human immunodeficiency virus infection. Brain Pathol. 1991 Apr;1(3):163–75. doi: 10.1111/j.1750-3639.1991.tb00656.x. [DOI] [PubMed] [Google Scholar]
- 21.Lucas SB, Hounnou A, Peacock C, et al. The mortality and pathology of HIV infection in a west African city. AIDS. 1993 Dec;7(12):1569–79. doi: 10.1097/00002030-199312000-00005. [DOI] [PubMed] [Google Scholar]
- 22.Baran H, Kepplinger B, Heinfelner JA, Lubec G, Budka H. Kynurenic acid metabolism in different types of brain pathology in HIV-1 infected patients. Eur J Neurology. 2002;9(Suppl 2):16, Sc 115. [Google Scholar]
- 23.Turski WA, Nakamura M, Todd WP, Carpenter BK, Whetsell WO, Jr, Schwarcz R. Identification and quantification of kynurenic acid in human brain tissue. Brain Res. 1988 Jun 28;454(1–2):164–9. doi: 10.1016/0006-8993(88)90815-3. [DOI] [PubMed] [Google Scholar]
- 24.Nakamura M, Kawai J, Minatogawa Y, Kido R. The Metabolic Degradation of Kynurenine At Tissue Level by Rat. In: Bender DA, Josef MH, Kochen W, Steinhart H, editors. Progress in tryptophan and serotonin research. De Gruyter W&Co; Berlin-New York: 1986. pp. 55–8. Printed in Germany. [Google Scholar]
- 25.Swartz KJ, Matson WR, MacGarvey U, Ryan EA, Beal MF. Measurement of kynurenic acid in mammalian brain extracts and cerebrospinal fluid by high-performance liquid chromatography with fluorometric and coulometric electrode array detection. Anal Biochem. 1990 Mar;185(2):363–76. doi: 10.1016/0003-2697(90)90309-w. [DOI] [PubMed] [Google Scholar]
- 26.Chiarugi A, Carpenedo R, Molina MT, Mattoli L, Pellicciari R, Moroni F. Comparison of the neurochemical and behavioral effects resulting from the inhibition of kynurenine hydroxylase and/or kynureninase. J Neurochem. 1995 Sep;65(3):1176–83. doi: 10.1046/j.1471-4159.1995.65031176.x. [DOI] [PubMed] [Google Scholar]
- 27.Mason M. The kynurenine transaminase of rat kidney. J Biol Chem. 1954 Dec;211(2):839–44. [PubMed] [Google Scholar]
- 28.Okuno E, Nakamura M, Schwarcz R. Two kynurenine aminotransferases in human brain. Brain Res. 1991 Mar 1;542(2):307–12. doi: 10.1016/0006-8993(91)91583-m. [DOI] [PubMed] [Google Scholar]
- 29.Bradford MM. A rapid and sensitive method for the quantitation of microgram quantities of protein utilizing the principle of protein-dye binding. Anal Biochem. 1976 May 7;72:248–54. doi: 10.1006/abio.1976.9999. [DOI] [PubMed] [Google Scholar]
- 30.Fukui S, Schwarcz R, Rapoport SI, Takada Y, Smith QR. Blood-brain barrier transport of kynurenines: implications for brain synthesis and metabolism. J Neurochem. 1991 Jun;56(6):2007–17. doi: 10.1111/j.1471-4159.1991.tb03460.x. [DOI] [PubMed] [Google Scholar]
- 31.Guillemin GJ, Kerr SJ, Pemberton LA, et al. IFN-beta1b induces kynurenine pathway metabolism in human macrophages: potential implications for multiple sclerosis treatment. J Interferon Cytokine Res. 2001 Dec;21(12):1097–101. doi: 10.1089/107999001317205231. [DOI] [PubMed] [Google Scholar]
- 32.Speciale C, Wu HQ, Gramsbergen JB, Turski WA, Ungerstedt U, Schwarcz R. Determination of extracellular kynurenic acid in the striatum of unanesthetized rats: effect of aminooxyacetic acid. Neurosci Lett. 1990 Aug 14;116(1–2):198–203. doi: 10.1016/0304-3940(90)90410-b. [DOI] [PubMed] [Google Scholar]
- 33.Jellinger K. The neuropathological diagnosis of Alzheimer disease. J Neural Transm Suppl. 1998;53:97–118. doi: 10.1007/978-3-7091-6467-9_9. [DOI] [PubMed] [Google Scholar]
- 34.Ketzler S, Weis S, Haug H, Budka H. Loss of neurons in the frontal cortex in AIDS brains. Acta Neuropathol. 1990;80(1):92–4. doi: 10.1007/BF00294228. [DOI] [PubMed] [Google Scholar]
- 35.Gordin FM, Roediger MP, Girard PM, et al. Pneumonia in HIV-infected persons: increased risk with cigarette smoking and treatment interruption. Am J Respir Crit Care Med. 2008 Sep 15;178(6):630–6. doi: 10.1164/rccm.200804-617OC. Epub Jul 10, 2008. [DOI] [PMC free article] [PubMed] [Google Scholar]
- 36.Kerr-Pontes LR, Oliveira FA, Freire CA. Tuberculosis associated with AIDS: the situation in a Northeastern region of Brazil. Rev Saude Publica. 1997 Aug;31(4):323–9. doi: 10.1590/s0034-89101997000400001. [DOI] [PubMed] [Google Scholar]
- 37.Baran H, Draxler M, Kepplinger B, et al. Kynurenine metabolism in piglet brain due to EMCV infection. Pharmacology. 2003;69:212–7. 1. [Google Scholar]
- 38.Holtze M, Asp L, Schwieler L, Engberg G, Karlsson H. Induction of the kynurenine pathway by neurotropic influenza A virus infection. J Neurosci Res. 2008 Dec;86(16):3674–83. doi: 10.1002/jnr.21799. [DOI] [PubMed] [Google Scholar]
- 39.Baran H, Staniek K, Kepplinger B, Stur I, Draxler M, Nohl H. Kynurenines and the respiratory parameters in rat heart mitochondria. Life Sci. 2003;72(10):1103–15. doi: 10.1016/s0024-3205(02)02365-2. [DOI] [PubMed] [Google Scholar]
- 40.Baran H, Kepplinger B, Herrera-Marschitz M, Stolze K, Lubec G, Nohl H. Increased kynurenic acid in the brain after neonatal asphyxia. Life Sci. 2001 Aug 3;69(11):1249–56. doi: 10.1016/s0024-3205(01)01215-2. [DOI] [PubMed] [Google Scholar]
- 41.Baran H, Cairns N, Lubec B, Lubec G. Increased kynurenic acid levels and decreased brain kynurenine aminotransferase I in patients with Down syndrome. Life Sci. 1996;58(21):1891–9. doi: 10.1016/0024-3205(96)00173-7. [DOI] [PubMed] [Google Scholar]
- 42.Erhardt S, Schwieler L, Nilsson L, Linderholm K, Engberg G. The kynurenic acid hypothesis of schizophrenia. Physiol Behav. 2007 Sep 10;92(1–2):203–9. doi: 10.1016/j.physbeh.2007.05.025. Epub May 21, 2007. [DOI] [PubMed] [Google Scholar]
- 43.Stone TW. Kynurenines in the CNS: from endogenous obscurity to therapeutic importance. Prog Neurobiol. 2001 Jun;64(2):185–218. doi: 10.1016/s0301-0082(00)00032-0. [DOI] [PubMed] [Google Scholar]
- 44.Carlson BA. Rapidly progressive dementia caused by nonenhancing primary lymphoma of the central nervous system. AJNR Am J Neuroradiol. 1996 Oct;17(9):1695–7. [PMC free article] [PubMed] [Google Scholar]
- 45.Vermeer SE, Prins ND, den Heijer T, Hofman A, Koudstaal PJ, Breteler MM. Silent brain infarcts and the risk of dementia and cognitive decline. N Engl J Med. 2003 Mar 27;348(13):1215–22. doi: 10.1056/NEJMoa022066. [DOI] [PubMed] [Google Scholar]
- 46.Davies NW, Guillemin G, Brew BJ. Tryptophan, Neurodegeneration and HIV-associated neurodegenerative disorder. Int J Tryptophan Res. 2010;3:121–40. doi: 10.4137/ijtr.s4321. [DOI] [PMC free article] [PubMed] [Google Scholar]
- 47.Ren J, Sietsma D, Qiu S, Moessler H, Finklestein SP. Cerebrolysin enhances functional recovery following focal cerebral infarction in rats. Restor Neurol Neurosci. 2007;25(1):25–31. [PubMed] [Google Scholar]
- 48.Xiao S, Yan H, Yao P the Cerebrolysin Study Group. The efficacy of cerebrolysin in patients with vascular dementia: results of a chinese multicentre, randomized, double-blind, placebo-controlled trial. Hong Kong J Psychiatry. 1999;9(2):13–9. [Google Scholar]
- 49.Snowdon DA, Greiner LH, Mortimer JA, Riley KP, Greiner PA, Markesbery WR. Brain infarction and the clinical expression of Alzheimer disease. The Nun Study. JAMA. 1997 Mar 12;277(10):813–7. [PubMed] [Google Scholar]


