

Abstract
Objectives
To assess changes in facial skin temperature over time, to identify sources of variation related to skin temperature and to evaluate interobserver reproducibility in measurements of the thermograms.
Methods
62 volunteers (32 females, 30 males, mean age 23.4, range 19.5–29.5 years) underwent thermography of the face (left and right side lateral images) on four occasions with approximately 2 months between each session. Three observers recorded the images and marked regions of interest (ROIs) in each image using dedicated software. Smoking, exercise habits and use of oral contraceptives were recorded.
Results
A significant difference between sessions (≤1 °C, p < 0.001) and between observers (≤0.11 °C, p < 0.001) was identified. The difference between sides was not significant (≤0.07 °C, p = 0.7). None of the interactions between side, session and observer were significant. Smoking, exercise habits and oral contraceptive intake were not significant impact factors when included as covariates in the analysis (p > 0.1). ROI temperature was significantly higher in males than in females (0.7 °C, p < 0.001). A mixed model analysis of variance showed that observer had little impact on the expected standard deviation, whereas session and subject had a greater impact.
Conclusions
Face temperature is symmetrical and varies over time. The non-significant difference between sides is highly reproducible, even between observers.
Keywords: thermography, longitudinal studies
Introduction
Thermography is an imaging method to display heat emitted from a surface. It may find use within dentistry to assess inflammation objectively after, for example, oral surgery. However, to be able to quantify inflammation in research studies or in clinical diagnostics, the method's ability to measure absolute temperature must be evaluated in healthy subjects. Depending on the purpose, an imaging method must satisfy a number of criteria in order for it to be applicable as a diagnostic method. First, the method must possess intrinsic reproducibility, i.e. the technology must be able to display two identical images when the same setting is used in two successive recordings. Second, the method must allow a high inter- and intraobserver reproducibility in interpreting the image, and finally the method must be accurate in measuring the outcome of interest.
Previous studies have shown that heat emission from the surface of the body is symmetrical.1-11 All of these studies measured differences between the left and right side of different areas of the head, except Uematsu et al,10 who focused on differences between the two sides over the whole body. Some studies recorded absolute temperature differences and found that the right and left side were symmetrical (non-significant temperature differences between the two sides within the range 0.1–0.4 °C),1,6-8,10 while others assessed the temperature distribution of the two sides of the face by assessing the different colours constituting the image4 or used a grid system to determine the degree of symmetry.3,5 However, many of these studies have focused on detection of pathology such as peripheral nerve injuries,6,7,9 atypical odontalgia4 or temporomandibular joint disorders5 rather than focusing on healthy subjects and normal methodology. All but one of the studies involving healthy subjects lacked data on temperature variation over time. The one study that followed subjects over a longer period of time included only four subjects, and the temperature variation was sparsely reported.10 Longitudinal data are necessary to determine whether temperature changes over time in normal subjects. Further, only Gratt et al4 included multiple observers in their study and assessed whether experience was important for detecting pathology in thermograms; thus, little is known about observer reproducibility in thermograms.
Most previous studies are more than 25 years old, and as thermography, just like any other technology, has developed quickly over time, new thermographic equipment has been introduced since these studies were carried out, and therefore new studies are warranted.
The objectives of this study were to assess changes in facial skin temperature over time in healthy subjects and to identify sources of variation related to skin temperature. Interobserver reproducibility in measurements of the thermograms was also evaluated.
Materials and methods
Subjects
62 subjects (32 females, 30 males, mean age 23.4, range 19.5–29.5 years at first examination) were included in the study. The subjects were students at Aarhus University, Aarhus, Denmark. Subjects with systemic disease were not included.
Imaging
Each subject was imaged four times (Session 1, 2, 3 and 4) with approximately 2 months between each session (December 2008, February 2009, April 2009, June–August 2009). All images were recorded in the same room by three trained and calibrated observers.
The camera used to record the images was a FLIR® ThermaCAMTM E320 (Precisions Teknik AB, Halmstad, Sweden). The camera used infrared technology, making it possible to obtain a thermographic image without direct contact between camera and subject, as opposed to liquid crystal thermography, which requires direct contact. According to the manufacturer it had a thermal sensitivity of 0.1 °C, an accuracy of ±2% and an intrinsic reproducibility of ±1%. The camera is calibrated once a year by the manufacturer to ensure the stability of these parameters. The detector was a focal plane array uncooled microbolometer. Images were taken with an emissivity (a surface's ability to emit heat at a given temperature) of 0.98.
Room temperature was recorded using a mercury thermometer that had been lying on the table in the imaging room for a minimum of 5 min before reading (recorded as the nearest degree centigrade), and body temperature was recorded using an ear thermometer (Omron GentleTempTM 510; Omron Healthcare Co., Ltd., Kyoto, Japan), to the nearest 0.1 °C.
At each session standardized thermograms were taken of the subject's face in profile, one left and one right side image. Before imaging the subject had rested for a minimum of 10 min, which included not eating or drinking. Male subjects were shaved the morning before imaging. The subject sat on a chair with the head positioned according to the Frankfort horizontal plane, and the camera was placed on a tripod and aligned with the subject's cheek (Figure 1). The distance from the cheek to the lens of the camera was fixed at 25 cm. When the camera was correctly positioned the lens was manipulated to bring the subject into focus, and the image was taken.
Figure 1.
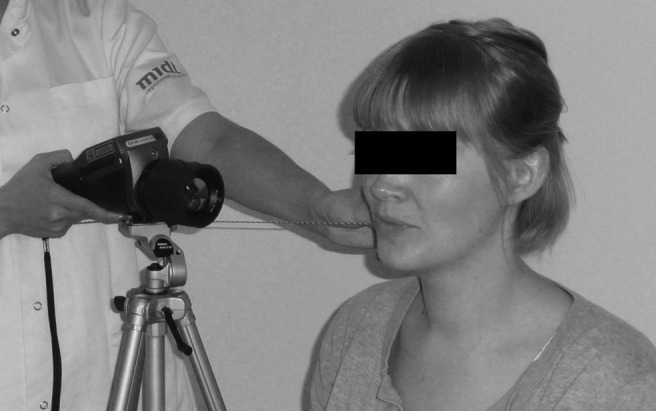
Setting for thermographic imaging
Anamnestic recordings
At each session, smoking (yes/no) and exercise (less than 200 min, 200–300 min, more than 300 min of exercise/week) habits were recorded. These factors were recorded by asking the subjects to recall their behaviour during the week prior to imaging. Furthermore, use of oral contraceptives (yes/no) was recorded for female subjects.
Temperature measurements
All images were saved with a resolution of 320×240 pixels and were processed using the software provided by the manufacturer of the camera (FLIR Systems ThermaCAM QuickReport 1.1, Precisions Teknik AB). The thermograms depicted the subject's face and the surroundings in different colours according to temperature. Each colour represented a temperature, shown on a scale on the right side of the image (Figure 2). The typical temperature range for these images was 24–35 °C, but the temperature colour scale adapted according to the actual temperatures and therefore could vary between images.
Figure 2.
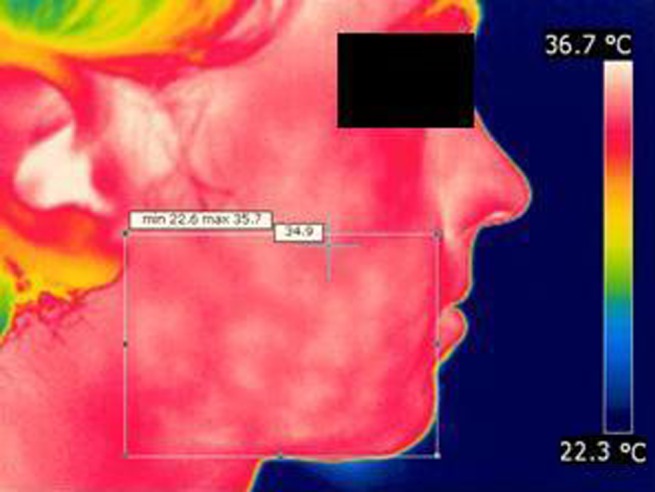
Thermogram of right side of a subject's face with region of interest. Max, maximum; min, minimum
Rectangles containing a region of interest (ROI) were marked on each image. The ROI was defined as follows: the frontal border by the commissure of the lips, the posterior border by the meatus acusticus externus, the superior border by the most caudal part of the nasal ala and the inferior border by the most caudal part of the chin (Figure 2). Three observers marked ROIs separately on all images. The observers were unable to see each other's markings. The temperature data for each pixel in the ROIs were transferred to Microsoft Excel (Microsoft Corporation, Redmond, WA) and saved as CSV (comma-separated values) files.
Data management and statistical analysis
The rectangular ROIs included not only facial tissue, but also background air and surfaces with a lower temperature than the subject's skin. In order to avoid misleading mean temperature values, these pixels were excluded. As the temperature scale was not the same for all images owing to variations in the temperatures of the background and the subject's face, eliminating all pixels with a temperature lower than a given temperature, e.g. 28 °C, would have been inaccurate. Therefore, a preliminary mean temperature within the ROI was calculated, and pixels with a temperature more than 4 °C lower than the mean of the preliminary rectangular ROI were excluded. After excluding these pixels, the mean temperature of the ROI was calculated. This temperature is henceforth known by the term “mean”, whereas averages between observers, sides and sessions are known as “average”.
Analysis of variance (ANOVA) with repeated measurements was used to analyse the mean temperature in the ROI. The ANOVA included the following fixed within-subject factors: session (1, 2, 3, 4), side (right, left) and observer (1, 2, 3). To evaluate systematic variation in temperature with time, observer and side, the main effects of session, observer and side were assessed relative to the within-subject variation of these differences. Interactions between these factors were assessed in a similar way. The effect of smoking, exercise, oral contraceptives, body temperature and room temperature on mean temperature in the ROI was assessed by including these variables, one at a time, as covariates in the ANOVA analysis. Difference between males and females was assessed by a two sample t-test.
To assess the importance of the different sources of variation the measurements were further analysed with a mixed model ANOVA in which subject, observer and session, as well as interactions between these factors, were considered as random factors that each contributed to the total variation of the temperature. Based on the results of the ANOVA, the impact of the various sources of variation on the average difference between measurements from two sessions and on the average side (left/right) difference between two sessions was assessed. Stata® v. 10 (StataCorp, College Station, TX) was used for all statistical analyses except the mixed model ANOVA, for which GenStat 10th edition (Lawes Agricultural Trust 2007, VSN International Ltd, Hemel Hempstead, UK) was used.
Results
All 62 subjects attended the first and the third session; at the second session four subjects were missing, and at the last session three subjects were missing. Smoking, exercise habits and use of oral contraceptives, as reported at each session, are shown in Table 1. The temporal variation was modest for all three variables.
Table 1. Number of subjects categorized at each session (S1–S4) according to smoking, exercise habits and intake of oral contraceptives.
| Characteristics | S1 | S2 | S3 | S4 |
| Smoker | ||||
| Yes | 10 | 9 | 10 | 10 |
| No | 52 | 49 | 52 | 49 |
| Exercise (min per week) | ||||
| <200 | 25 | 21 | 19 | 24 |
| 200–300 | 18 | 16 | 21 | 21 |
| >300 | 19 | 21 | 21 | 14 |
| Oral contraceptives (females) | ||||
| Yes | 24 | 22 | 26 | 24 |
| No | 8 | 8 | 6 | 7 |
Min, minimum.
The average of the mean temperatures within the ROI for each side, as recorded by each observer at the four sessions, are shown in Figure 3, and Table 2 provides further information on the average and standard deviation of the differences between sides and between sessions. On both the left and the right side the average temperature developed in a similar pattern over time. The same was true for the average temperatures measured by the three observers.
Figure 3.
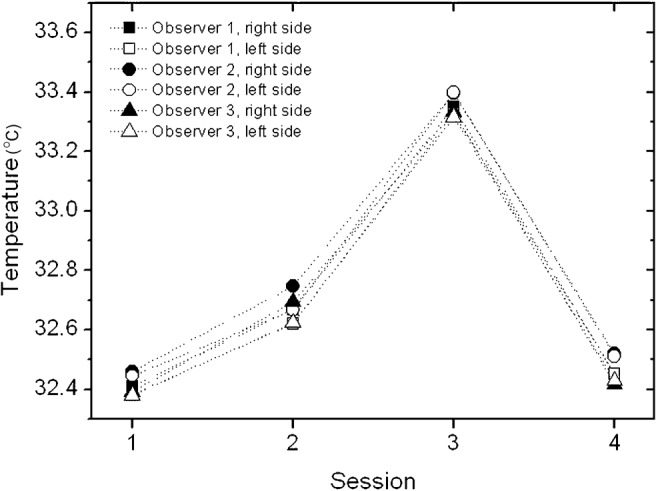
The average of the mean temperatures within the region of interest for each side as recorded by each observer at the four sessions
Table 2. Mean and standard deviation (SD) of average temperature in the region of interest at baseline (Session 1) and change between baseline and Sessions 2, 3 and 4 for each observer, for each side (R and L) and for the difference between the right and left side (R–L).
| S1 |
S2–S1 |
S3–S1 |
S4–S1 |
||||||
| Observer | Side | Mean (SD) | Mean (SD) | Mean (SD) | Mean (SD) | ||||
| 1 | R | 32.41 | (1.30) | 0.24 | (1.57) | 0.94 | (1.21) | 0.07 | (1.78) |
| L | 32.38 | (1.31) | 0.22 | (1.59) | 0.95 | (1.17) | 0.10 | (1.70) | |
| R–L | 0.027 | (0.271) | 0.014 | (0.401) | −0.004 | (0.400) | −0.037 | (0.433) | |
| 2 | R | 32.46 | (1.24) | 0.25 | (1.49) | 0.94 | (1.13) | 0.09 | (1.69) |
| L | 32.44 | (1.22) | 0.20 | (1.51) | 0.95 | (1.11) | 0.09 | (1.65) | |
| R–L | 0.015 | (0.232) | 0.055 | (0.403) | −0.017 | (0.341) | −0.008 | (0.385) | |
| 3 | R | 32.39 | (1.31) | 0.27 | (1.57) | 0.94 | (1.21) | 0.05 | (1.78) |
| L | 32.38 | (1.28) | 0.22 | (1.55) | 0.94 | (1.17) | 0.08 | (1.70) | |
| R–L | 0.012 | (0.276) | 0.048 | (0.406) | 0.006 | (0.419) | −0.030 | (0.429) | |
S, session.
In the repeated measurement ANOVA a statistically significant difference between sessions (less than or equal to 1 °C, p < 0.001) and between observers (less than or equal to 0.11 °C, p < 0.001) was identified, whereas the difference between sides was not statistically significant (less than or equal to 0.07 °C, p = 0.7). Moreover, none of the interactions between side, session and observer was statistically significant. Smoking, exercise habits and oral contraceptive intake were not statistically significant factors when included as covariates in the analysis (p > 0.1). The difference between males and females was statistically significant (p < 0.001); the temperature in males was on average 0.7 °C higher than in females. Mean ROI temperature was not affected significantly by body temperature or room temperature.
The mixed model ANOVA identified ten components of variance of which intersubject variation, variation between sessions and their interaction were by far the most important. The results of this analysis were used to estimate the standard deviation to be expected in repeated sampling from a number of different sampling schemes, in which each of the factors subject, session and observer was either kept fixed or selected at random from a population of subjects, sessions or observers, respectively (Table 3). Allowing for different observers had little impact on the standard deviation compared with the effect of different sessions or different subjects.
Table 3. Standard deviation of mean temperature in the region of interest in repeated sampling from eight different sampling schemes in which subject, session and observer are either fixed or random.
| Sampling scheme | Subject | Session | Observer | SD |
| 1 | Fixed | Fixed | Fixed | 0.075 |
| 2 | Fixed | Random | Fixed | 1.089 |
| 3 | Fixed | Fixed | Random | 0.114 |
| 4 | Fixed | Random | Random | 1.091 |
| 5 | Random | Fixed | Fixed | 1.165 |
| 6 | Random | Random | Fixed | 1.237 |
| 7 | Random | Fixed | Random | 1.165 |
| 8 | Random | Random | Random | 1.238 |
SD, standard deviation.
To further illustrate the relative importance of the various sources of variation, the results of the mixed model ANOVA were also used to estimate the expected standard deviations of differences between sides at the same session and between sessions for the same side (Table 4). These estimates were computed assuming that the two temperatures were determined by the same observer (Table 4, left column) or by different observers (Table 4, right column). Table 4, bottom line, shows the standard deviation of the difference between the side differences determined at two sessions. Also here, the standard deviations were essentially unchanged by allowing different observers. More importantly, the change from one session to another session in the difference between sides had a much smaller standard deviation than the change in the temperature of a given side, indicating that the large temporal variation could be eliminated by using a control side.
Table 4. Standard deviation of a comparison of mean temperature between two sides, between two sessions, between two observers, and between two side differences from different sessions, if the measurements are performed by the same observer (left column) or by different observers (right column).
| Comparisons | SD same observer | SD different observers |
| Sides | 0.300 | 0.312 |
| Sessions | 1.540 | 1.543 |
| Observers | – | 0.161 |
| Sides between sessions | 0.415 | 0.416 |
SD, standard deviation.
Discussion
A significant variation in temperature was seen over time (Figure 3), i.e. between the four sessions, which shows that surface temperature fluctuates over time. The temperatures measured in Session 3 in particular were significantly higher than the temperatures measured in other sessions. The explanation for this is unclear, as Session 3 was in the spring time—a higher temperature in the summer might have been caused by a warm-weather period, but this was not the case. We explored whether room temperature or body temperature were higher at Session 3 (data not shown), or whether the pixel exclusion from the ROI analysis could have affected the results (data not shown), but this was not the case. In our data there was no variable that could account for a systematically higher temperature at Session 3, and we can only explain this deviation with natural variations in temperature. This apparently random temperature deviation over time may impede the use of an absolute temperature as an expression for inflammation in a clinical setting.
However, there was no temperature difference between the left and right ROI at any time. The finding that more measurements (two sides instead of one) result in less variation than fewer measurements (one side) is surprising, since it is a well-known statistical phenomenon that using multiple measurements normally results in a greater variation. The stability between sides means that, in spite of the temporal variation that makes absolute temperature a non-valid measurement in a clinical trial or when examining for pathology, thermography can still be used for these purposes as long as the contralateral side is used as a control. This is also in agreement with other studies.1-8,10 However, the method is only valid when pathology is not present bilaterally, as this would eliminate the temperature difference between an affected and a non-affected side.
The average temperature of the ROIs differed significantly between observers. A poor interobserver reproducibility could indicate that the method is not useful for clinical use. However, the reproducibility was high for the difference in temperature between the two sides of the face, and no observer obtained a significant difference between the left and right side at any time. Therefore thermography seems to be a useful method to measure surface temperature differences between, for example, an intervention side and a control side, as three observers, who differed in the marking of ROIs, still reached the same temperature difference between sides. Together with the fact that the intrinsic reproducibility of the camera is 1% (meaning that the deviation in the temperature display in two images taken immediately after each other with exactly the same settings is 1% or lower) and the accuracy 2% (meaning that the temperature display in an image may vary no more than 2% from the true temperature of the imaged object), this means that overall reproducibility of thermography is acceptable.
There was no impact on temperature from different levels of exercise, although muscular activity tends to increase the basic metabolic rate12 and therefore might be expected to have an influence on surface temperature. A previous study similarly showed no difference in skin temperature before and 1 h after a 60 min exercise programme.13 Subjects were not questioned about which type of exercise they performed or for how long they had been exercising; if we had done this a difference between groups (e.g. light exercise vs strenuous exercise or exercise over a long period of time vs occasional exercise) could not be excluded. Future studies randomizing exercise and control groups would be needed to clarify the impact, if any, of exercise on skin temperature.
Smoking affects peripheral circulation and we therefore expected a lower skin temperature in smokers. However, there was no difference between smokers and non-smokers, which may be related to the low number of smokers in our study. The temperature could also be influenced by the number of cigarettes smoked per week, as heavy smokers would be expected to experience the greatest changes in peripheral blood flow owing to a continuous influence of nitrous oxide. No participants in this study were, however, heavy smokers (2 smokers smoked 80 cigarettes per week; the remainder smoked 40 or less).
We found no difference in skin temperature between females taking oral contraceptives and females not taking oral contraceptives. Previous studies disagree on the effect of oral contraceptives on peripheral blood flow: some found that use of oral contraceptives increased blood flow and vascular response,14,15 whereas others found a decrease in vascular response.16 The menstrual cycle of female subjects was not taken into account in this study. Pogrel et al17 indicated that the menstrual cycle may influence skin temperature, but owing to the low number of females not taking oral contraceptives in this study we do not have data to detect this.
Males had a higher average facial skin temperature than females. This could be due to differences in blood circulation in the skin between males and females or the higher basic metabolic rate in males.12 This finding is supported by a previous study.8
We can conclude that face temperature is symmetrical and varies over time. The small difference between sides is highly reproducible, even between observers. Owing to this symmetry and reproducibility, thermography can be a useful tool in research and clinical diagnostics.
Acknowledgments
The authors wish to thank Morten Tang, Jesper Kjerri Rasmussen and Jesper Soegaard Andersen for their help in data collection and ideas for the manuscript. Erik Gotfredsen is thanked for his help in the preliminary data treatment.
Footnotes
The “Calcinfonden” is thanked for the financial support making it possible to buy the thermographic camera.
References
- 1.Ariyaratnam S, Rood JP. Measurement of facial skin temperature. J Dent 1990;18:250–253 [DOI] [PubMed] [Google Scholar]
- 2.Christensen J, Matzen LH, Vaeth M, Schou S, Wenzel A. Thermography as a quantitative imaging method for assessing postoperative inflammation. Dentomaxillofac Radiol 2012;41:494–499 [DOI] [PMC free article] [PubMed] [Google Scholar]
- 3.Gratt BM, Pullinger A, Sickles EA, Lee JJ. Electronic thermography of normal facial structures: a pilot study. Oral Surg Oral Med Oral Pathol 1989;68:346–351 [DOI] [PubMed] [Google Scholar]
- 4.Gratt BM, Sickles EA, Graff-Radford SB, Solberg WK. Electronic thermography in the diagnosis of atypical odontalgia: a pilot study. Oral Surg Oral Med Oral Pathol 1989;68:472–481 [DOI] [PubMed] [Google Scholar]
- 5.Gratt BM, Sickles EA, Ross JB. Electronic thermography in the assessment of internal derangement of the temporomandibular joint. A pilot study. Oral Surg Oral Med Oral Pathol 1991;71:364–370 [DOI] [PubMed] [Google Scholar]
- 6.Gratt BM, Sickles EA, Shetty V. Thermography for the clinical assessment of inferior alveolar nerve deficit: a pilot study. J Orofac Pain 1994;8:369–374 [PubMed] [Google Scholar]
- 7.Gratt BM, Shetty V, Saiar M, Sickles EA. Electronic thermography for the assessment of inferior alveolar nerve deficit. Oral Surg Oral Med Oral Pathol Oral Radiol Endod 1995;80:153–160 [DOI] [PubMed] [Google Scholar]
- 8.Gratt BM, Sickles EA. Electronic facial thermography: an analysis of asymptomatic adult subjects. J Orofac Pain 1995;9:255–265 [PubMed] [Google Scholar]
- 9.Uematsu S. Thermographic imaging of cutaneous sensory segment in patients with peripheral nerve injury. Skin-temperature stability between sides of the body. J Neurosurg 1985;62:716–720 [DOI] [PubMed] [Google Scholar]
- 10.Uematsu S, Edwin DH, Jankel WR, Kozikowski J, Trattner M. Quantification of thermal asymmetry. Part 1: Normal values and reproducibility. J Neurosurg 1988;69:552–555 [DOI] [PubMed] [Google Scholar]
- 11.Zaproudina N, Varmavuo V, Airaksinen O, Narhi M. Reproducibility of infrared thermography measurements in healthy individuals. Physiol Meas 2008;29:515–524 [DOI] [PubMed] [Google Scholar]
- 12.Widmaier EP, Raff H, Strang KT. Regulation of organic metabolism and energy balance. In: Widmaier EP, Raff H, Strang KT, (eds). Vander's human physiology: the mechanisms of body function. 12th edn. New York: McGraw-Hill; 2011. pp. 554–585 [Google Scholar]
- 13.Stapleton J, Gagnon D, Kenny GP. Short-term exercise training does not improve whole-body heat loss when rate of metabolic heat production is considered. Eur J Appl Physiol 2010;109:437–446 [DOI] [PubMed] [Google Scholar]
- 14.Reinberg AE, Touitou Y, Soudant E, Bernard D, Bazin R, Mechkouri M. Oral contraceptives alter circadian rhythm parameters of cortisol, melatonin, blood pressure, heart rate, skin blood flow, transepidermal water loss, and skin amino acids of healthy young women. Chronobiol Int 1996;13:199–211 [DOI] [PubMed] [Google Scholar]
- 15.Bartelink ML, De WA, Wollersheim H, Theeuwes A, Thien T. Skin vascular reactivity in healthy subjects: influence of hormonal status. J Appl Physiol 1993;74:727–732 [DOI] [PubMed] [Google Scholar]
- 16.Charkoudian N, Johnson JM. Modification of active cutaneous vasodilation by oral contraceptive hormones. J Appl Physiol 1997;83:2012–2018 [DOI] [PubMed] [Google Scholar]
- 17.Pogrel MA, Yen CK, Taylor RC. Infrared thermography in oral and maxillofacial surgery. Oral Surg Oral Med Oral Pathol 1989;67:126–131 [DOI] [PubMed] [Google Scholar]