Abstract
During the Deepwater Horizon (DWH) oil spill, a wide range of gas and aerosol species were measured from an aircraft around, downwind, and away from the DWH site. Additional hydrocarbon measurements were made from ships in the vicinity. Aerosol particles of respirable sizes were on occasions a significant air quality issue for populated areas along the Gulf Coast. Yields of organic aerosol particles and emission factors for other atmospheric pollutants were derived for the sources from the spill, recovery, and cleanup efforts. Evaporation and subsequent secondary chemistry produced organic particulate matter with a mass yield of 8 ± 4% of the oil mixture reaching the water surface. Approximately 4% by mass of oil burned on the surface was emitted as soot particles. These yields can be used to estimate the effects on air quality for similar events as well as for this spill at other times without these data. Whereas emission of soot from burning surface oil was large during the episodic burns, the mass flux of secondary organic aerosol to the atmosphere was substantially larger overall. We use a regional air quality model to show that some observed enhancements in organic aerosol concentration along the Gulf Coast were likely due to the DWH spill. In the presence of evaporating hydrocarbons from the oil, NOx emissions from the recovery and cleanup operations produced ozone.
On April 20, 2010, an explosion and subsequent leak beneath the Deepwater Horizon (DWH) drilling platform led to the largest marine oil spill in United States history. The air quality issues arising from the oil spill are different for workers at the site than for the population along the coast. Primary emissions are of more concern near the site and secondary pollutants are more important downwind. The key atmospheric pollutants considered in this paper are hydrocarbons (HCs), particulate matter (PM) or aerosol particles, ozone, carbon monoxide, and nitrogen oxides. Four sources of primary air pollutants attributable to the DWH oil spill are detected in our observations: (a) HCs evaporating from the oil; (b) smoke from deliberate burning of the oil slick; (c) combustion products from the flaring of recovered natural gas; and (d) ship emissions from the recovery and cleanup operations. Here, we examine these primary emissions and the subsequent production of ozone and secondary organic aerosol (SOA). Furthermore, we use aircraft data to derive the amount of atmospheric particulate matter formed per mass of oil that reached the surface. These results can be used to estimate implications for air quality during the DWH spill at other times and locations and can also provide information about effects on air quality by past or future spills.
Measurements
On June 8 and 10, 2010, the National Oceanic and Atmospheric Administration (NOAA) WP-3D aircraft carried an extensive suite of instruments that measured trace gases and aerosol species (Table S1) near the DWH site. HCs were also measured from ships in the vicinity of DWH, including the NOAA R/V Thomas Jefferson that sailed close to the DWH site on June 22–27, 2010. Samples from the ship were taken from about 6–10 m above the water surface.
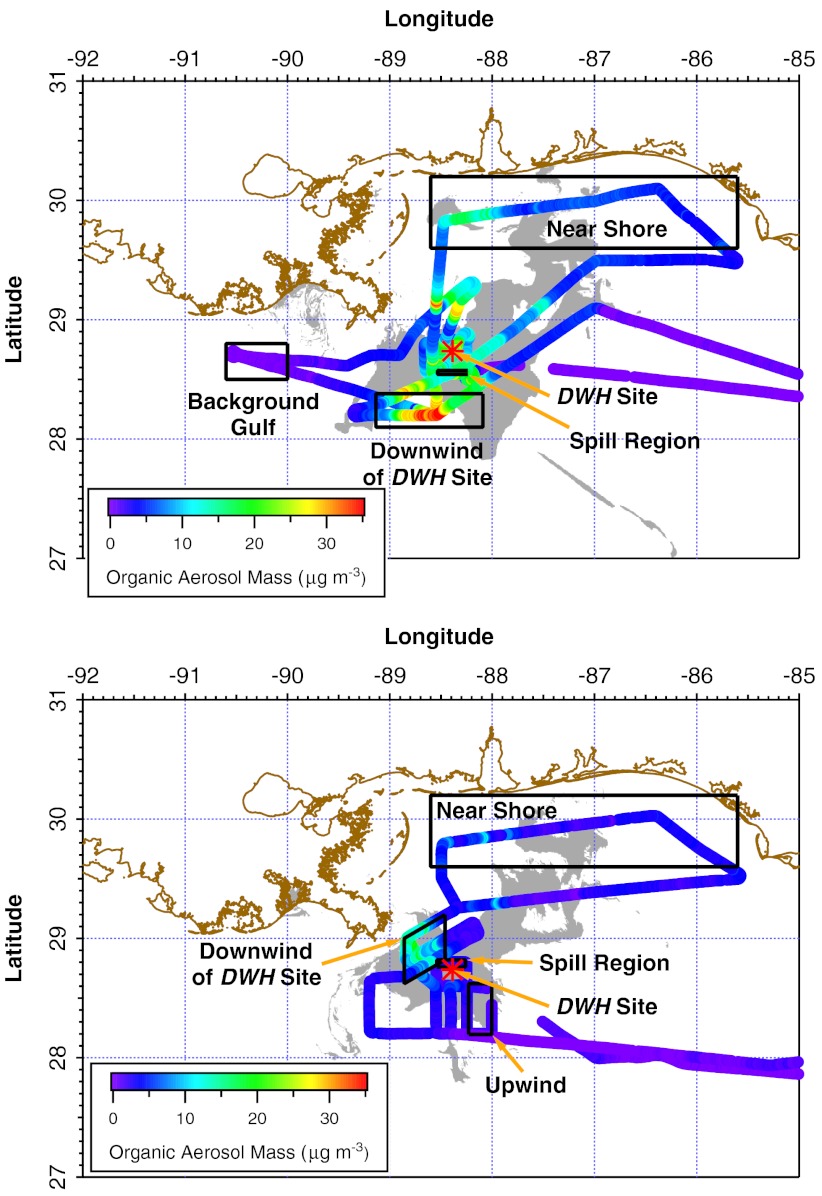
By June 8, a containment cap had been loosely installed on the wellhead and surface recovery vessels were able to capture a fraction of the leaking oil and natural gas. Oil on the sea surface was burned periodically (1, 2) on June 8. On both flights, the aircraft flew a rectangular pattern about 8 km from the DWH site and then flew transects perpendicular to the wind direction at progressively farther distances downwind (Fig. 1). The flights also surveyed the air about 40 km off the Gulf Coast and upwind of DWH. On both days there was a well-mixed marine boundary layer about 600 m deep (3). Most aircraft data were obtained at 200 m altitude with some at lower or higher altitudes to verify the characteristics of the boundary layer and air just above it.
Fig. 1.
Track of National Oceanic and Atmospheric Administration WP-3D aircraft flight (markers color-coded by organic aerosol mass concentration) conducted on June 8, 2010 (Upper) and June 10, 2010 (Lower) superimposed on the remotely sensed location of the oil (gray) at the time of the flight. The red star indicates the DWH site. The boxes outlined in black indicate the portions of the flight data that were averaged for Table S2. The wind was light and generally from the northeast on June 8 and steady from the southeast on June 10. Image produced by NOAA/NESDIS Satellite Analysis Branch, based on satellite imagery provided by ESA, CSA, ASI, e-GEOS, infoterra, CSTARS, NASA, and NOAA.
Measured concentrations of atmospheric pollutants varied depending on the location of the aircraft or ship relative to the DWH site and the resulting surface oil, the residence time of oil on the surface, chemical reactions of pollutant species in the atmosphere, and meteorological conditions. The mixing ratios of several gaseous and aerosol species at various locations are summarized in Tables S2 and S3. Assuming a constant source of precursors and similar production rates, the factor of 2–3 difference in concentrations between the June 8 and 10 flights is roughly consistent with the variation in the dilution rate due to different wind speeds for the two days.
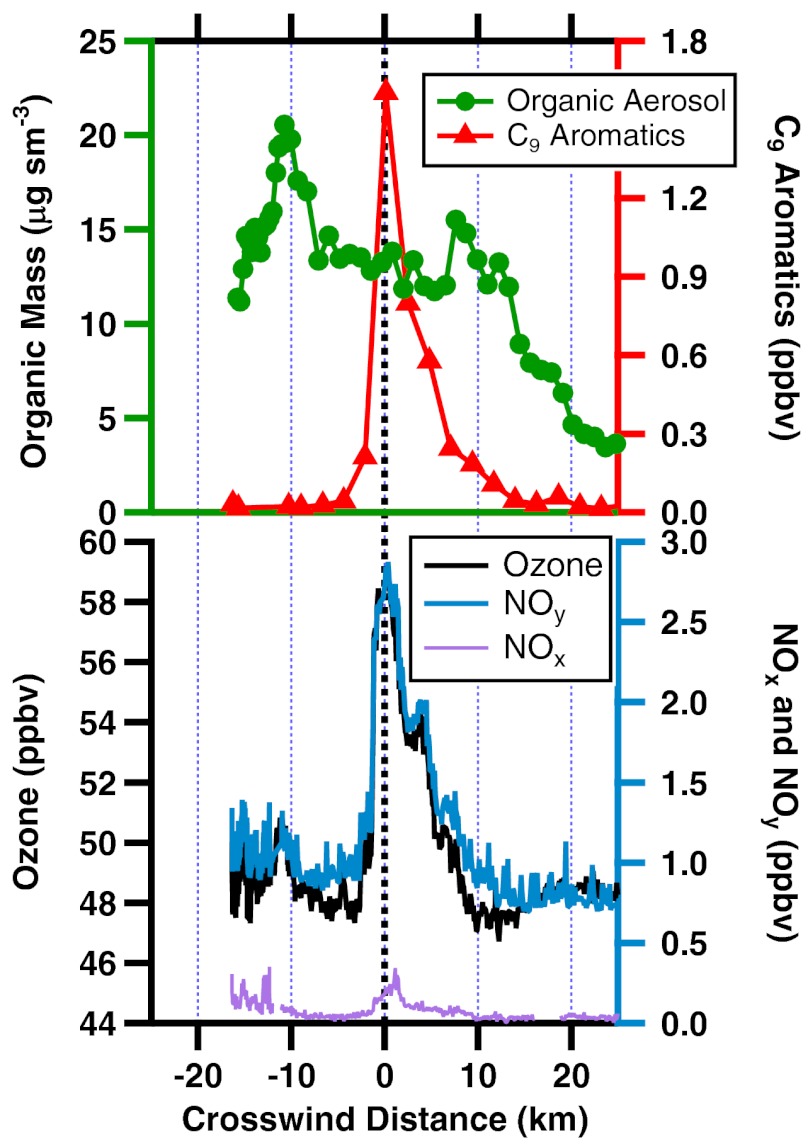
The aircraft transects that were farthest (approximately 47 km) downwind of DWH indicated a plume about 4 km wide (full width half maximum, FWHM) of volatile species such as light alkanes and aromatics that evaporated from the oil (Fig. 2 and Fig. S1). Nitrogen oxides (NOx = NO + NO2), emitted by flaring of recovered natural gas and ship operations close to the spill site, reacted to form nitric acid, peroxyacetyl nitrate (PAN), and other oxidation products that are included with NOx in the total of reactive nitrogen, NOy. The small signal of NOx relative to NOy in this transect indicates that most of the NOx was converted to other forms within the roughly 3 h since emission. These narrow plumes were embedded within a plume more than 30 km wide (FWHM) of organic aerosol particles.
Fig. 2.
Measured mixing ratios during the farthest downwind transect across the DWH pollution plume. Downwind distances from DWH were 47 ± 5 km except the most negative crosswind portion was 26 to 42 km downwind because of the path of the aircraft relative to the plume.
Results and Discussion
HCs Evaporating from Oil That Surfaced.
By mass, the largest air emissions from the spill consisted of HCs evaporating from oil. These HCs can affect air quality in three ways. First, some of the measured compounds, including benzene, toluene, and naphthalene, are classified as hazardous air pollutants (http://www.epa.gov/ttn/atw/orig189.html, http://www.epa.gov/ttn/atw/pollutants/atwsmod.html). Second, evaporating HCs, especially intermediate volatility organic compounds (IVOCs) with vapor pressures comparable to C14-C16 alkanes, reacted in the atmosphere to produce lower volatility products that then form SOA (4). Third, the HCs reacted with NOx and sunlight to form secondary pollutants such as ozone and PAN.
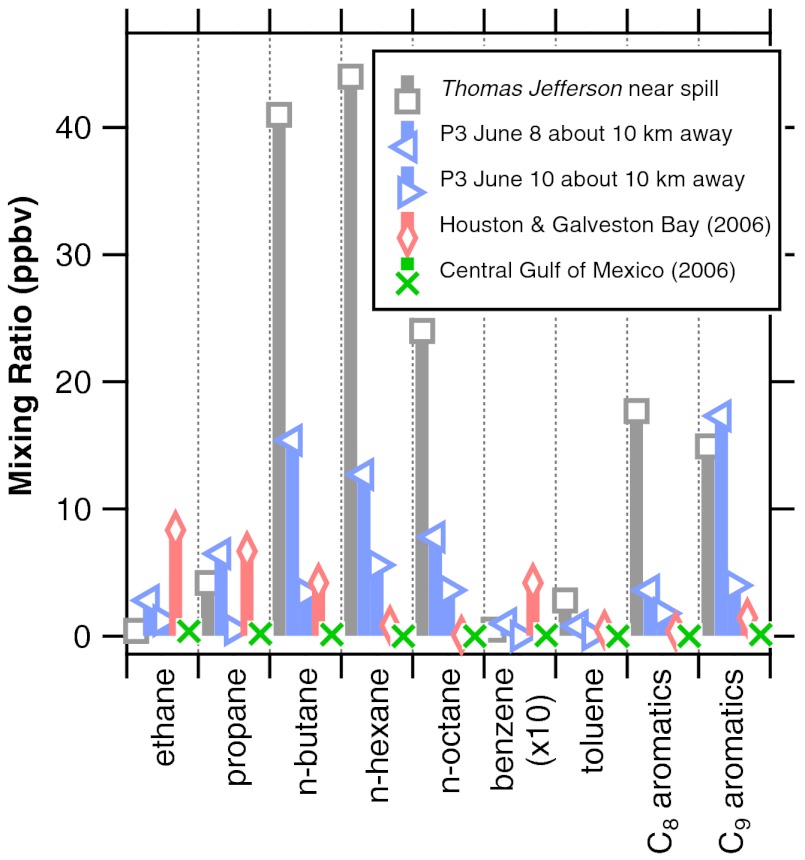
The chemical composition of the measured HCs downwind of the DWH site was dominated by alkanes with smaller contributions from aromatic species (about 9% by mass) (3). Gas phase polycyclic aromatic hydrocarbons (PAHs) other than naphthalene were not measured. Average mixing ratios for selected alkanes and aromatic HCs are shown in Fig. 3 for several locations: ship measurements close to the DWH site, aircraft transects about 10 km downwind, and polluted air in the Houston Ship Channel and relatively unpolluted air in the central Gulf of Mexico from a 2006 study (5).
Fig. 3.
Average selected hydrocarbon mixing ratios obtained from the NOAA ship Thomas Jefferson on June 22–27, 2010 within a 10 km radius of the DWH site and from the NOAA P3 aircraft on June 8 and 10, 2010 at a distance 10 km downwind. Houston/Galveston Bay and unpolluted, central Gulf of Mexico data were obtained from another NOAA ship in 2006 (5).
The largest HC mixing ratios were obtained within 1 km of the DWH site from the ship (Fig. 3 and Table S3). The average total measured HC concentration in the air near the surface was 3.0 ppm of carbon after recovery began.*These mixing ratios from the ship were especially large because the ship approached closer to the DWH site than the aircraft and because the samples were obtained close enough to the sea surface that the HCs were not fully diluted throughout the depth of the boundary layer. Near the DWH site, the mixing ratios of C4-C10 n-alkanes and the C8-C9 aromatics were much higher than those typically found in heavily polluted areas such as the Houston Ship Channel (5). During the period of the spill, the flux of evaporating HCs from the spill (3) exceeded the average volatile organic carbon (VOC) emission inventory from the Houston-Galveston-Brazoria Consolidated Metropolitan Statistical Area (http://www.epa.gov/air/data/geosel.html), although the mix of HCs was very different. The lighter alkanes and aromatics (notably benzene) were enhanced in the air to a lesser degree than would be expected from the leaking oil and gas composition because a large fraction of those species dissolved in the water column during transport of the oil to the surface (3). Although some concentrations of aromatics measured from the ship within 1 km of the DWH site were large, they were below the Occupational Safety and Health Administration (OSHA) standards for occupational exposure assuming they were constant with time. However, concentrations in other locations and wind conditions would be different and could have been higher in the vicinity of freshly surfaced oil. The health impacts due to HCs for the DWH spill workers have been studied by others (see http://www.epa.gov/bpspill/vocs.html).
The June 10 aircraft data show that the plume of C9 aromatics and other volatile HCs was roughly 2 km wide (FWHM) at a distance of 9 km downwind from DWH. Such a narrow plume indicates that these compounds evaporated from a relatively small area in the vicinity of the DWH site (3). The sum of the measured aromatics (toluene, C8-C11 aromatics, and naphthalene) was more than 20 parts per billion by volume (ppbv) in the air downwind of the spill region and was dominated by the C8 and C9 aromatics. Benzene was never measured at concentrations higher than 0.1 ppbv in the evaporating plume (up to 0.75 ppbv of benzene was found in the smoke from in situ burning). Concentrations of naphthalene were less than 0.5 ppbv. Peak mixing ratios of HCs decreased as the air moved farther downwind, primarily due to dilution in the mixed boundary layer. The plumes sampled by the farthest downwind transects were up to 3 h old, which is long enough for some of the more reactive species to have been partially removed by photochemical reactions.
Particulate Matter (PM) or Aerosol Particles.
Two types of particles were formed either at the spill site or downwind: SOA from the evaporating HCs and soot from in situ burning of surface oil or from recovery operations.
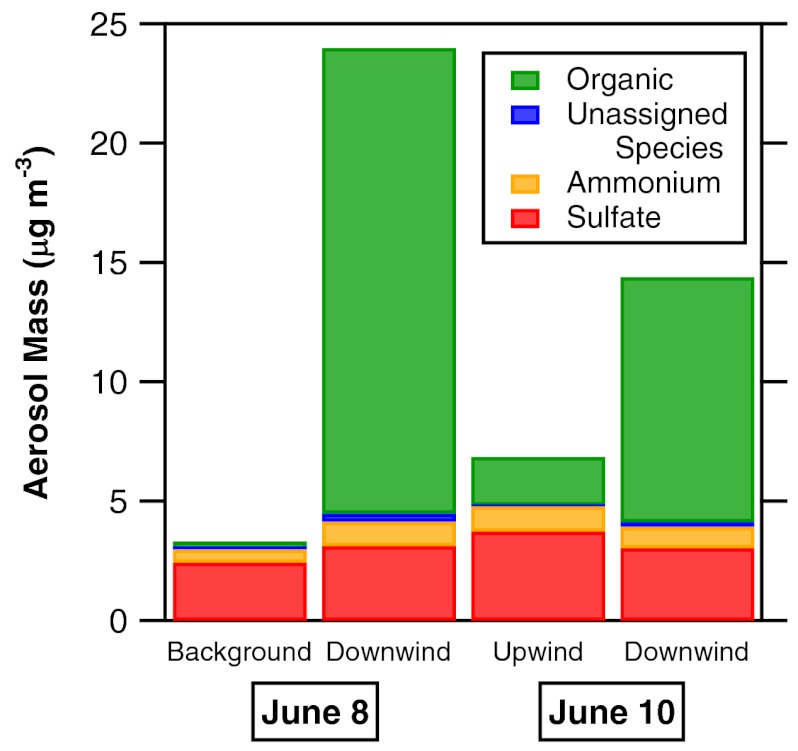
The maximum measured increase in submicron particulate (almost exclusively organic) mass downwind of the spill was 20 μg m-3 on June 8 and 7 μg m-3 on June 10 (Fig. 4 and Table S2). For comparison, the June 8 increase is larger than the maximum submicron SOA mass concentration of 15 μg m-3 observed by us in 2006 in the Houston area (6, 7), albeit these urban aerosols certainly had a different composition. The National Ambient Air Quality Standard (NAAQS) for particulate matter less than 2.5 μm in diameter is 15 μg m-3 for the annual average and 35 μg m-3 for the 24-h average (http://www.epa.gov/air/criteria.html).
Fig. 4.
Background or upwind and downwind (> 40 km) aerosol mass concentrations for the two flight days. There was clear production of organic aerosol mass from the spill. Changes in the measured sulfate and ammonium were within the range of background variability.
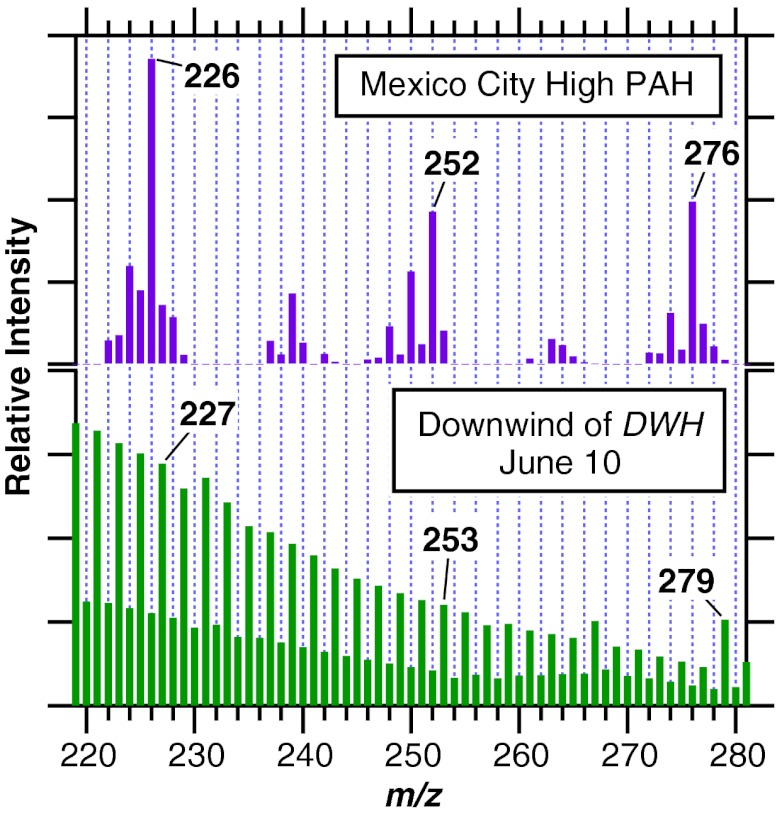
Particles smaller than 1 μm in diameter accounted for most of the increased SOA mass downwind of the spill site. In addition, the measured mass distribution of particles indicated that small, fresh organic particles formed and existing particles grew by acquiring organic material (8). This demonstrates that the increase in organic mass was the result of condensation of less volatile products rather than wind-driven oily spray, which would produce mainly larger particles. Despite significant concentrations in the oil (potentially as much as 1.4% by mass) (9–11), mass spectra of the aerosol particles downwind of DWH indicate that PAHs (12) contributed less than 0.1% to the particulate mass (Fig. 5).
Fig. 5.
High mass portions of aerosol mass spectra from Mexico City known to have large PAH contributions (12) (upper panel) and downwind of the DWH site on June 10 (lower panel). The DWH aerosols have distinct peaks at odd m/z and the peaks from individual PAHs (which would appear at m/z 226, 252, and 276, among others) are much smaller in intensity, indicating that PAHs did not contribute significantly to the aerosol mass.
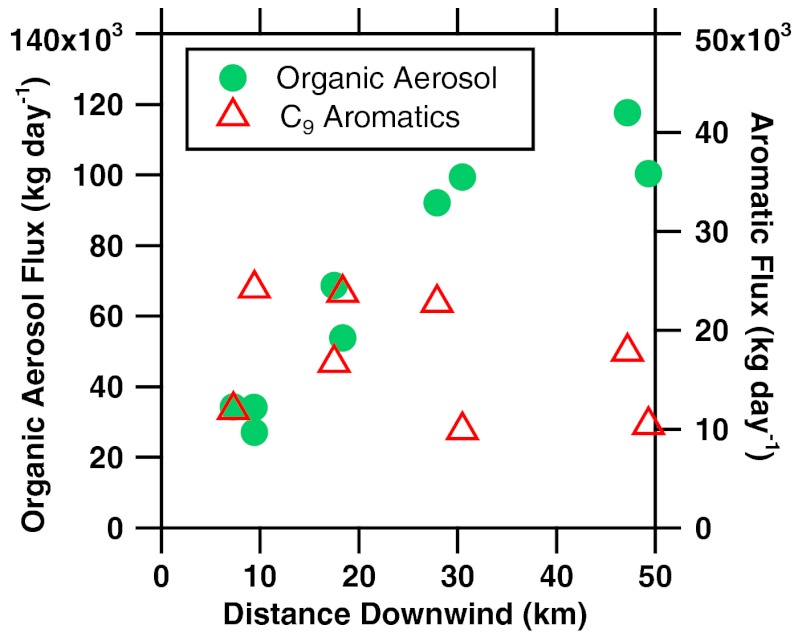
The aerosol plume was wider than the plume of directly emitted species (Fig. 2 and Fig. S1). The aerosol mass flux, calculated using standard methods (3) (also see SI Text), increased with distance downwind (Fig. 6). In contrast, the flux of volatile species evaporating from the spill was fairly constant downwind. Combining oil composition information with the measured HC and aerosol fluxes allows an estimate to be made of the overall yield of SOA formed. On June 10, 8 ± 4% of the surfacing oil was converted to SOA within the first 3 h of downwind transport (see SI Text for calculation details).
Fig. 6.
Horizontal fluxes of organic aerosol mass and selected aromatic hydrocarbons (C9 aromatics) as a function of distance downwind from the DWH spill site on June 10, 2010. The organic aerosol mass flux increases with distance, whereas the flux of C9 aromatics is nearly constant, with scatter mostly due to integrating over a limited number of data points in each transect through the narrow plume.
A plume of smoke from in situ burning was sampled on June 8 from the aircraft. Aerosol composition measurements show that black carbon (BC) was the dominant aerosol constituent in this smoke (13). Using aerosol extinction data, approximately 4% of the carbon emitted into the air from the burn was soot. This corresponds to about 3.5% of the carbon in the surface oil that was ignited if 90% burned (Table S4, see SI Text for calculation details). A direct measurement of BC resulted in a 3.6 ± 1.4% yield relative to the amount of carbon burned (13). For the plume from flaring recovered gases, the emission factor of BC was about 0.04% of the fuel burned (Table S4).
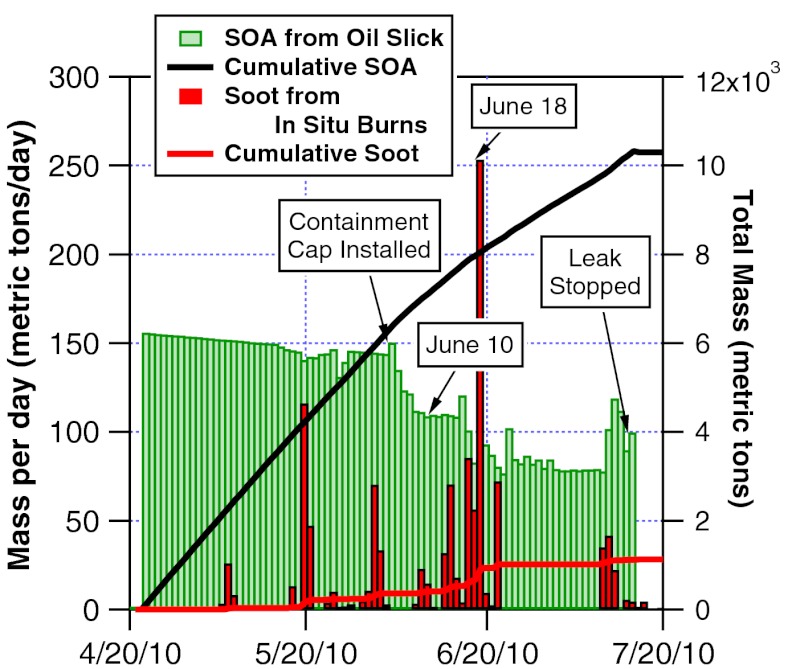
Assuming the smoke plume we measured was representative of other surface oil burns and the SOA formation rate on June 10 was representative of other days during the spill, the soot emission factor and SOA yield were used to estimate the daily rates of aerosol mass either being emitted or produced in the air for the entire DWH spill event (Fig. 7). Overall, the cumulative amount of SOA formed from surface oil over the course of the spill was roughly 10 times larger than the amount of soot emitted from the burns. Such mass comparisons should be interpreted with care because the particles had different sizes and composition and the soot particles from the in situ burns and flaring were lofted higher than the observed SOA plume (13).
Fig. 7.
Estimated SOA mass produced per day due to evaporation of the surface oil and daily emission rates of soot particles from in situ burns. The cumulative amounts of each aerosol source provide an estimate of the total aerosol mass into the atmosphere when the wellhead was leaking. A calculated decrease due to partial containment is seen around June 7. Note that there will be less SOA formed if fresh oil is skimmed or burned (see SI for details).
Ozone, Carbon Monoxide, and Nitrogen Oxides.
Other criteria pollutants can be formed by combustion processes at the spill site. In addition, the airborne HCs and NOx released near the spill contributed to photochemical formation of secondary pollutants—ozone and PAN (a lung and eye irritant often measured in urban photochemical smog). Thus, mitigation and cleanup efforts that produced NOx likely increased ozone levels around the site.
Emission factors of various pollutants were determined from correlations observed by the fast time response instruments during passes through the plumes (SI Text and Fig. S2). For the surface oil burning plume sampled on June 8, the emission ratio for carbon monoxide (CO) was 54 g CO per kg of surface oil ignited (Table S4), or 2.7% on a carbon mass basis relative to the amount of carbon in the oil ignited. Combined with the 3.5% emission ratio for soot, these emissions are characteristic of incomplete fuel combustion and are within the range of previous measurements on test and other in situ burns of crude oil on water (2, 11, 13, 14). The NOx emission factor for this source was about 2.3 g (as NO2) per kg of fuel ignited (Fig. S2 and Table S4), which is also consistent with other in situ burns (14).
Separate plumes from the flaring of captured gases and ships performing recovery and cleanup operations were measured in the aircraft transects immediately downwind of the DWH site on June 10. Farther downwind, the individual flaring and ship plumes mixed into one plume, as in Fig. 2. Median emission factors in these separate or overlapping plumes were about 11 g CO per kg fuel burned and 27 g NOx (as NO2) per kg of fuel burned. These values are within the expected range for flaring and ship emissions (15) (see also http://www.epa.gov/ttnchie1/ap42/). Enhancements of CO and BC particles in these plumes were characteristic of nearly complete combustion (3). Because the flare plume was lofted higher than the ship plumes, the emission factor for NOx from this flare was determined separately from the ship plumes and was about 2 g (as NO2) per kg of fuel burned, which is typical for flares (see http://www.epa.gov/ttnchie1/ap42/). The downwind enhancement of CO was less than 16 ppbv, which is small compared to concentrations observed in urban areas, and the enhancement of NOy was less than 8 ppbv, which is comparable to urban areas (16).
Because the flaring, recovery, and cleanup operations producing NOx were focused around the DWH site where the oil was surfacing, the largest ozone mixing ratios were found directly downwind of the site (Fig. 2 and Fig. S1). On June 10, the maximum ozone enhancement was about 10 ppbv (as in Fig. 2) and the maximum PAN enhancement was about 350 part per trillion by volume (pptv) (Table S2). On June 8, the maximum enhancements were about 30 ppbv for ozone and 750 pptv for PAN (Table S2). The maximum ozone mixing ratio, 83 ppbv on June 8, was comparable to maximum 8-h mixing ratios observed in US urban areas (16).
Downwind of the spill site, the total measured HC to NOx ratio was greater than 100 atoms C per atom N, which is at least a factor of 5 larger than typical ratios in an urban environment (see http://www.epa.gov/ttn/chief/emch/index.html). Despite the proportion of relatively unreactive alkanes in the evaporating HCs (3), ozone production was NOx limited (i.e., additional NOx is needed to promote faster ozone formation). A linear correlation of ozone with NOx oxidation products (calculated from NOy-NOx) showed that about six molecules of ozone were produced per molecule of NOx oxidized, which indicates an ozone production efficiency similar to that found in urban areas in the southern United States (17). Additional ozone may have been produced when the evaporating HCs were transported near the coast where there were more NOx sources.
Effect on Air Quality for the Gulf Coast.
One of the concerns of the oil spill was its impact on air quality for the Gulf Coast, which was at times downwind of DWH. Because the SOA particles that formed over the DWH oil spill were present in relatively large concentrations, were dispersed in a wide plume, and continued to increase in mass downwind, these particles potentially had a measurable effect on ambient levels of aerosol particles in coastal communities directly downwind of the spill. Volatile HC and ozone mixing ratios were also enhanced downwind of the oil spill, but they were confined to narrower plumes.
To simulate the fate of SOA from the DWH oil spill, the Weather Research and Forecasting/Chemistry (WRF-CHEM) regional air quality model (18) was modified with a volatility basis set approach (19). Details of the model are described in the SI Text. The salient features of the model for the purposes of assessing the effect on air quality are that it creates a plume of SOA with a flux similar to the aircraft observations (Fig. S3) and then calculates transport and deposition.
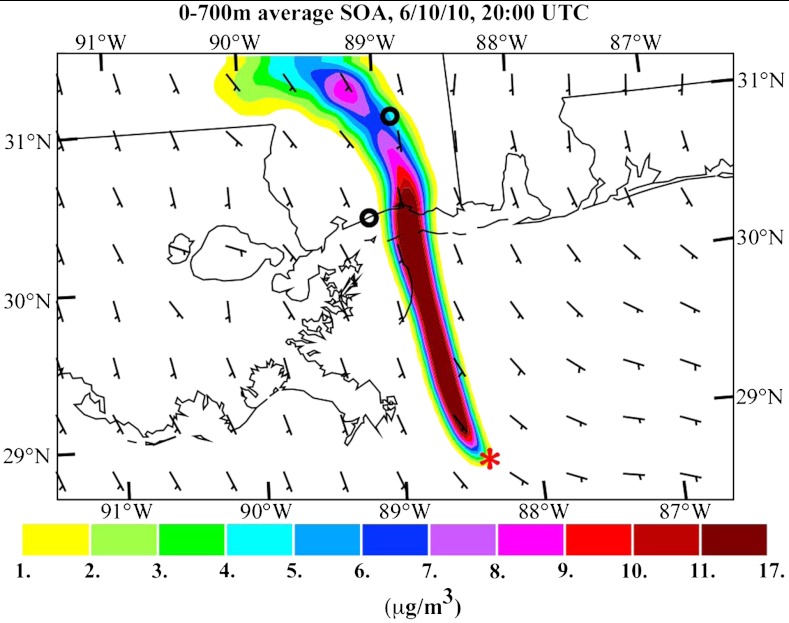
The model is used with 4-km resolution to demonstrate the transport of SOA from the DWH spill toward the coast for June 10 when the wind direction was from the south (Fig. 8). A plume is formed downwind of DWH passing over the Mississippi coast. The model does not predict SOA formation in the areas that are not directly downwind of the spill site, in agreement with the aircraft measurements.
Fig. 8.
Prediction at the surface of the average SOA contribution from the DWH oil spill for 20:00 Coordinated Universal Time (UTC) (3 pm local time), June 10, 2010. The red asterisk shows the DWH spill site location. The small black circles are the locations of the Gulfport (coastal MS) and Oak Grove (inland MS) SEARCH monitoring sites.
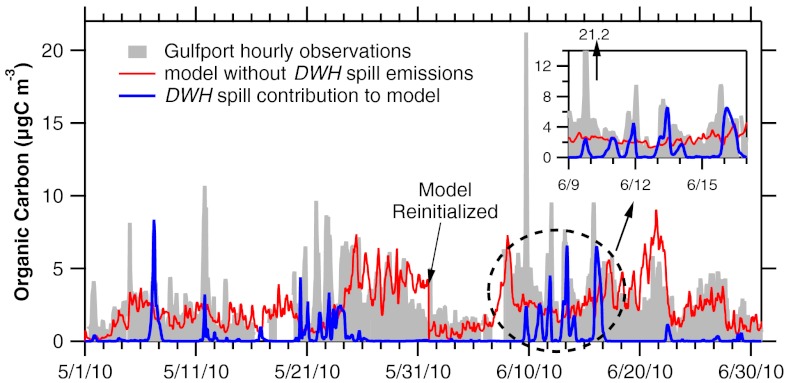
To determine the influence of large-scale meteorology on SOA from DWH over the United States, a 20-km resolution model was run for the months of May and June 2010. The results from this model were compared with hourly organic carbon (OC) measurements available along the Gulf coast from the Southeastern Aerosol Research and Characterization (SEARCH) network (20). The model-predicted OC at the Gulfport, MS site (Fig. 8, just north of the coastline) shows fairly good agreement with the observations (Fig. 9). Peaks in the observations generally correspond to times when the model predicts large DWH spill contributions, giving some confidence in the timing and levels of predicted OC. OC comparisons at the Oak Grove, MS site (80 km north of Gulfport, MS) exhibit similar agreement (Fig. S4), with peak values in both measured and modeled OC from the DWH spill reduced by a factor of 2 compared to the Gulfport, MS site as expected from dilution and deposition when marine air moves inland.
Fig. 9.
Time series of observed particulate organic carbon at Gulfport, MS. Also shown are modeled concentrations without the DWH spill and from the spill. The effect of emissions from the spill on the measured organic carbon is apparent during periods with onshore winds from over the spill, as depicted in the inset and a few events in May.
The maximum continental area impacted by SOA from the DWH spill was also determined from the 20-km model. Fig. S5 shows the simulated surface distribution of SOA during the early morning of June 12 in the southeast US region. This was the time with maximum SOA impact from DWH north of 30° latitude for the June simulation. Very little impact was seen north of 34° latitude. Vertical mixing within the planetary boundary layer diluted the plume during the daytime so there was no significant multiday accumulation over land.
Overall, the model predicted short episodes at coastal sites with more than 10 μg C m-3 of OC in particles from the DWH spill. These aerosol enhancements were typically less than 24 h in duration and are generally consistent with the hourly coastal observations from the SEARCH network. The plume of SOA moved to various places along the coast depending upon the direction of onshore winds.
Implications for Other Oil Spills.
Several factors affected the ultimate impact of the spilled oil on air quality in the surrounding region. In the case of the DWH spill, most of the lighter HCs (smaller than C4 alkanes and C6-C7 aromatics) released from the leak at about 1,500 m below the sea surface were dissolved in the water column before reaching the surface (3). As a result, the mixing ratios of the hazardous air pollutants (benzene, toluene, and to a lesser extent other aromatics in the air above the spill) were not as enhanced as would have been expected for a shallow-water or surface spill (21). The spill was also far enough offshore that there was some dispersion of the pollutants before they reached populated areas.
A reasonable first approximation for the formation of SOA from another spill would be to scale the observations from DWH by the size of the spill. There are at least five factors to consider in this simple approximation. First, the SOA formed mostly from IVOCs in the oil (4), and these will have different concentrations depending on oil composition. Second, the Gulf of Mexico in summer is a warm and sunny environment, conditions that favor evaporation, oxidation, and subsequent production of SOA. Also, the vertical dispersion of the pollutants would be very different over land or colder water. Third, the model indicates that the large flux of HCs from the DWH spill reduced the amount of hydroxyl radical (OH) in the center of the plume. Photochemical reactions would probably proceed more rapidly in a more dilute plume. Fourth, the ozone and SOA formation chemistry could be quite different in a more NOx-rich environment such as close to urban areas. Finally, semivolatile organic compounds partition more readily into the aerosol phase when aerosol mass concentrations are higher (22). This effect could make aerosol formation nonlinear with the size of the spill.
Summary
The leaking oil and natural gas at the DWH spill site and the associated recovery and cleanup operations led to emissions of pollutants to the atmosphere. HCs evaporating from the oil slick were the largest source of primary air emissions. Once in the air, these HCs produced SOA and gaseous pollutants such as ozone and PAN. Large concentrations of PAHs were not found in the SOA. Significant ozone production was confined to the area downwind of both evaporating HCs from the spill and NOx emissions from the cleanup and recovery operations. The emission factors for NOx, CO, and soot or black carbon from in situ burning of surface oil, flaring, and ship emissions were similar to those previously reported.
Whether the oil evaporates or is burned in situ on the water surface, a small but significant percentage is converted into aerosol particles smaller than 1 μm in diameter. These particles can penetrate into the lungs with potential health effects (23). There are, however, key differences in these two sources of particulate matter from the oil spill. During the course of the spill, the total mass of SOA formed in the atmosphere was approximately 10 times larger than the soot mass emitted from the burns. The soot particles from in situ burns were confined to narrow plumes so the absolute concentrations of particles from the burns were much higher. Furthermore, the heat associated with the in situ burning lofted some of the soot particles above the marine boundary layer where they could be transported farther than the SOA. In situ burns were also generally scheduled during offshore winds whereas SOA will form whether or not the wind is blowing towards populated areas.
Our results indicate that air quality is affected not only by direct emissions from the spill and related operations but also by the reaction products in the atmosphere such as ozone and SOA. In warm, sunny conditions, most of the HCs observed from the DWH spill have photochemical lifetimes of less than a few days before they react in the atmosphere. Thus, the potential for long-range transport of the HCs is limited. In contrast, aerosol particles typically survive for days in the lower atmosphere and it is likely that SOA from the DWH site impacted aerosol levels in populated areas near the Gulf Coast. Results from a regional transport model support this conclusion. Fortunately, the impact on air quality from the DWH spill was limited in scope. A spill of similar size closer to populated areas, closer to the surface, or in a region with larger NOx sources could have a larger impact.
Materials and Methods
The data used for this work are publicly available (http://www.esrl.noaa.gov/csd/tropchem/2010gulf/). The methods and instruments used to measure the trace gases and aerosol air pollutants described in this paper are listed in Table S1. Additional calculations are given in the SI Text. Downwind distances on June 10 relative to location of the DWH spill site (28.74° N, 88.37° W) were defined using aircraft observations of wind speed and direction. Crosswind distances were defined perpendicular to the prevailing wind as negative to the southwest and positive to the northeast of the plume centerline (Fig. 1).
Supplementary Material
ACKNOWLEDGMENTS.
We thank Eric Edgerton for providing data from the SEARCH ground sites and the crew of the National Oceanic and Atmospheric Administration (NOAA) R/V Thomas Jefferson for obtaining air samples around the spill. The NOAA P-3 oil spill survey flights and subsequent data analysis were funded by the US Coast Guard and NOAA. Analysis of those samples was supported by the National Science Foundation through a grant to D.R.B. (AGS-1049952). The research cruises were funded by NOAA through a contract with Consolidated Safety Services, Inc.
Footnotes
The authors declare no conflict of interest.
This article is a PNAS Direct Submission.
This article contains supporting information online at www.pnas.org/lookup/suppl/doi:10.1073/pnas.1110052108/-/DCSupplemental.
*Barletta B, American Geophysical Union 2010 Fall Meeting, December 13–17, 2010, San Francisco, CA, abstr. A31B-0054.
References
- 1.Schaum J, et al. Screening level assessment of risks due to dioxin emissions from burning oil from the BP Deepwater Horizon Gulf of Mexico spill. Environ Sci Technol. 2010;44:9383–9389. doi: 10.1021/es103559w. [DOI] [PubMed] [Google Scholar]
- 2.Aurell J, Gullett BK. Aerosat sampling of PCDD/PCDF emissions from the Gulf oil spill in situ burns. Environ Sci Technol. 2010;44:9431–9437. doi: 10.1021/es103554y. [DOI] [PubMed] [Google Scholar]
- 3.Ryerson TB, et al. Atmospheric emissions from the Deepwater Horizon spill constrain air-water partitioning, hydrocarbon fate, and leak rate. Geophys Res Lett. 2012;38:L07803. [Google Scholar]
- 4.de Gouw JA, et al. Organic aerosol formation downwind from the Deepwater Horizon oil spill. Science. 2012;331:1295–1299. doi: 10.1126/science.1200320. [DOI] [PubMed] [Google Scholar]
- 5.Gilman JB, et al. Measurements of volatile organic compounds during the 2006 TexAQS/GoMACCS campaign: Industrial influences, regional characteristics, and diurnal dependencies of the OH reactivity. J Geophys Res. 2009;114:D00F06. [Google Scholar]
- 6.Bahreini R, et al. Organic aerosol formation in urban and industrial plumes near Houston and Dallas, Texas. J Geophys Res. 2009;114:D00F16. [Google Scholar]
- 7.Bates TS, et al. Boundary layer aerosol chemistry during TexAQS/GoMACCS 2006: Insights into aerosol sources and transformation processes. J Geophys Res. 2008;113:D00F01. [Google Scholar]
- 8.Brock CA, Murphy DM, Bahreini R, Middlebrook AM. Formation and growth of organic aerosols downwind of the Deepwater Horizon oil spill. Geophys Res Lett. 2012;38:L17805. [Google Scholar]
- 9.Wang Z, et al. US Environmental Protection Agency; 2003. Characteristics of spilled oils, fuels, and petroleum products: 1. Composition and properties of selected oils. EPA/600/R-03/072. [Google Scholar]
- 10.Benner BA, et al. Polycyclic aromatic hydrocarbon emission from the combustion of crude oil on water. Environ Sci Technol. 1990;24:1418–1427. [Google Scholar]
- 11.Evans DD, Mulholland GW, Baum HR, Walton WD, McGrattan KB. In situ burning of oil spills. J Res Natl Inst Stand Technol. 2001;106:231–278. doi: 10.6028/jres.106.009. [DOI] [PMC free article] [PubMed] [Google Scholar]
- 12.Dzepina K, et al. Detection of particle-phase polycyclic aromatic hydrocarbons in Mexico City using an aerosol mass spectrometer. Int J Mass Spectrom. 2007;263:152–170. [Google Scholar]
- 13.Perring AE, et al. Characteristics of black carbon aerosol from a surface oil burn during the Deepwater Horizon oil spill. Geophys Res Lett. 2012;38:L17809. [Google Scholar]
- 14.Ross JL, Ferek RJ, Hobbs PV. Particle and gas emissions from an in situ burn of crude oil on the ocean. J Air Waste Manag Assoc. 1996;46:251–259. doi: 10.1080/10473289.1996.10467459. [DOI] [PubMed] [Google Scholar]
- 15.Williams EJ, Lerner BM, Murphy PC, Herndon SC, Zahniser MS. Emissions of NOx, SO2, CO, and HCHO from commercial marine shipping during Texas Air Quality Study (TexAQS) 2006. J Geophys Res. 2009;114:D21306. [Google Scholar]
- 16.Office of Air Quality Planning and Standards. National Air Quality: Status and Trends Through 2007. Research Triangle Park, NC: US Environmental Protection Agency; 2008. EPA-454/R-08-006. [Google Scholar]
- 17.Neuman JA, et al. Relationship between photochemical ozone production and NOx oxidation in Houston, Texas. J Geophys Res. 2009;114:D00F08. [Google Scholar]
- 18.Grell GA, et al. Fully coupled “online” chemistry within the WRF model. Atmos Environ. 2005;39:6957–6975. [Google Scholar]
- 19.Donahue NM, Robinson AL, Stanier CO, Pandis SN. Coupled partitioning, dilution, and chemical aging of semivolatile organics. Environ Sci Technol. 2006;40:2635–2643. doi: 10.1021/es052297c. [DOI] [PubMed] [Google Scholar]
- 20.Hansen DA, et al. Air quality measurements for the Aerosol Research and Inhalation Epidemiology Study. J Air Waste Manag Assoc. 2006;56:1445–1458. doi: 10.1080/10473289.2006.10464549. [DOI] [PubMed] [Google Scholar]
- 21.Lehr WJ. Modeling the benzene inhalation hazard from spilled oil. Spill Sci Technol B. 1996;3:199–202. [Google Scholar]
- 22.Robinson AL, et al. Rethinking organic aerosols: Semivolatile emissions and photochemical aging. Science. 2007;315:1259–1262. doi: 10.1126/science.1133061. [DOI] [PubMed] [Google Scholar]
- 23.Pope CA, III, Dockery DW. Health effects of fine particulate air pollution: Lines that connect. J Air Waste Manag Assoc. 2006;56:709–742. doi: 10.1080/10473289.2006.10464485. [DOI] [PubMed] [Google Scholar]
Associated Data
This section collects any data citations, data availability statements, or supplementary materials included in this article.


