Abstract
The irruption of gas and oil into the Gulf of Mexico during the Deepwater Horizon event fed a deep sea bacterial bloom that consumed hydrocarbons in the affected waters, formed a regional oxygen anomaly, and altered the microbiology of the region. In this work, we develop a coupled physical–metabolic model to assess the impact of mixing processes on these deep ocean bacterial communities and their capacity for hydrocarbon and oxygen use. We find that observed biodegradation patterns are well-described by exponential growth of bacteria from seed populations present at low abundance and that current oscillation and mixing processes played a critical role in distributing hydrocarbons and associated bacterial blooms within the northeast Gulf of Mexico. Mixing processes also accelerated hydrocarbon degradation through an autoinoculation effect, where water masses, in which the hydrocarbon irruption had caused blooms, later returned to the spill site with hydrocarbon-degrading bacteria persisting at elevated abundance. Interestingly, although the initial irruption of hydrocarbons fed successive blooms of different bacterial types, subsequent irruptions promoted consistency in the structure of the bacterial community. These results highlight an impact of mixing and circulation processes on biodegradation activity of bacteria during the Deepwater Horizon event and suggest an important role for mixing processes in the microbial ecology of deep ocean environments.
Keywords: oil spill, well blowout, intrusion layers
Oil and gas from the Macondo well flowed freely into the deep Gulf of Mexico for a period of 83 d after the explosion and sinking of the Deepwater Horizon (DWH) mobile offshore drilling unit. The environmental release of crude oil occurred at ∼1.5 km water depth with an estimated magnitude of 4.1 × 10⁶ barrels (1). Large volumes of gas also emanated from the ruptured well, with reported ratios of gas to oil ranging from 1,600 to 2,800 standard cubic feet of gas (15.6 °C, 1 bar) per barrel of oil (2–4). Mass fluxes estimated from these values are 5.4 × 10¹¹ g for liquid oil and 1.8–3.1 × 10¹¹ g for natural gases, defined here as alkanes with one to five carbons.
Oil and gas entered the ocean initially through multiple openings in the ruptured riser pipe and later, from the top of the blowout preventer after the riser pipe was cut away on June 1, 2010 (1). The hydrocarbon droplets ejected ranged in size from several millimeters down to small droplets with slow ascent rates; 771,000 gal dispersant were applied at depth to promote formation of such small, slow-rising droplets. On release, the bulk of oil and gas began a rapid ascent from the sea floor, entraining sea water as it rose. The entrainment of sea water cooled the oil and gas rapidly (3) and initiated both dissolution of the soluble components and formation of gas hydrate. Kinetically controlled chemical fractionation seems to have persisted for several hundred meters of ascent until the entrained waters separated from the ascending oil (3, 5, 6). These waters formed intrusion layers between 800 and 1,300 m water depth that included dissolved hydrocarbons, small oil droplets, and dispersant applied subsea; metastable gas hydrate, carbon dioxide, precipitated waxes, and polar petroleum compounds are also likely to have been present (2, 3, 7–11). A variety of processes (e.g., slow ascent of small oil droplets, descent of wax or other high molecular weight petroleum components, and dissociation of metastable gas hydrate) likely altered plume composition near the source, leaving intrusions dominated by the most soluble compounds, such as gases (2–4, 9, 10, 12) and monoaromatic compounds (3, 7, 8, 13), in addition to most of the dispersant added subsea (11, 14) and a poorly defined quantity of entrained oil droplets (15). These intrusion layer hydrocarbons were substrates for bacterial respiration, feeding a bacterial bloom that persisted for several months (2, 10, 13).
The goal of this work is to determine how currents and mixing processes impacted the course of hydrocarbon biodegradation and microbial ecology in the deep Gulf of Mexico during and after the Macondo well blowout. We use a regional physical oceanographic model that targets the motion of discrete water parcels in the deep intrusion layer. The model was forced with time course input for 26 abundant hydrocarbon compounds or classes and seeded with 52 metabolically defined bacterial types representing natural populations of both primary hydrocarbon degraders and a secondary population consuming excreted intermediary compounds. Results were analyzed with a mixing diagnostic based on the notion of mesoellipticity and mesohyperbolicity on finite flow evolution timescales (16). The spatial and temporal patterns of biodegradation, microbial community structure, and oxygen decline that we obtain clearly show modulation by physical processes readily diagnosed by mesoellipticity and mesohyperbolicity and reveal important effects, such as autoinoculation, caused by recirculation of contaminated waters and their microbial populations about the ruptured well. These results may reconcile disparate observations of the physical dynamics and microbial community structure of the deep plume.
Model Development
We developed a 2D (plus time) model to combine horizontal circulation and mixing in the deep Gulf of Mexico waters with hydrocarbon input that feeds bacterial metabolism and cellular growth. We focused entirely on the deep plume horizon spanning 1,000–1,300 m water depth, applying diagnostics for mixing (16) that have not been used in previous models of deep water circulation (17). We defined a daily input flux of hydrocarbons distributed evenly across depths in this horizon, with a Gaussian distribution about the wellhead; bacterial populations of defined initial abundance, growth rate, and substrate preference were allowed to grow from these inputs. The model tracked horizontal circulation and mixing, bacterial abundance and metabolic rate, and changes in oxygen and hydrocarbon concentrations resulting from metabolism. A general description of the model inputs follows, with detailed descriptions provided in SI Text.
To estimate the input of hydrocarbons from the ruptured Macondo well into the deep plume horizon of 1,000–1,300 m water depth, several available sources were used. We began with daily flux estimates of oil and natural gas from the well based on ref. 1 and subtracted the daily recovery volumes reported from active collection. We then identified 22 compounds that were observed or inferred (from solubility) to have partitioned into the deep plumes, and we estimated each compound's daily emission from its reservoir abundance (3, 4). For volatile compounds, the possible range of gas content led to both low (3) and high (2) assumptions; results presented derive from the latter. We then applied partition coefficients as described in SI Text to estimate the fraction of each compound retained in the deep plume and thereby, calculated a compound-specific daily input flux to the deep plume for the full duration of the spill. We used a similar approach to estimate the daily input flux for the less-soluble, longer-chain hydrocarbons, which were divided into four classes based on chain length and assumed to have been distributed into the deep plume as small droplets. Together, the daily input fluxes of these 26 compounds and classes are the only carbon inputs to the model.
We assume that each compound or class is consumed by a single bacterial lineage, which we define as an operational metabolic type (OMT), yielding 26 OMTs of primary consumers (Table S1). We assume the metabolism of primary consumers partitions carbon equally among CO2, biomass, and intermediate metabolites (including surfactants) that escape the cell and feed a secondary microbial community. The escape of intermediate metabolites is typical of hydrocarbon degraders (18–20), presumably because such intermediates are hydrophobic and readily cross the cell's membrane. Secondary consumers are uniquely linked to the intermediate produced by the associated primary consumer, yielding 26 OMTs of secondary consumers (Table S1). These secondary consumers are assumed to partition their substrate evenly into CO2 and cellular biomass. Biomass generated by both primary and secondary consumers is assumed to be remineralized according to a first-order decay process (k = 2 × 10⁻³ h−1) when substrate concentration no longer supports growth. Each OMT is assumed to be present throughout Gulf of Mexico deep waters at an abundance of 104 viable cells L−1 (0.1% of the total microbial community of 107 cells L−1) (13), except for methanotrophs, which were assumed to be present at 103 viable cells L−1. The background community was assumed to be present at 0.1 μmol-C L−1 (107 cells L−1 at 120 fg C per cell). All OMTs mapped to one of the following bacterial families/genera (substrate preference in brackets): Methylococcaceae [methane (2, 21)], Oceanospirillales [alkanes (13)], Cycloclasticus [aromatics (18)], Methylophaga/Methylophilaceae [methane-derived intermediates (2)], and Colwellia [propane, ethane, and higher alkane-derived intermediates (21, 22)]. Where possible, OMTs were mapped to bacterial species, and published data on these species were used to estimate doubling times and cell masses. Each OMT was assumed to grow with a characteristic doubling time after it encountered the appropriate substrate, limited only by substrate depletion. The estimated C masses and doubling times for each of the 52 OMTs are provided in SI Text along with the associated reasoning.
Results and Discussion
The model predicts that the 2 × 10¹¹ g hydrocarbons injected into the deep Gulf of Mexico drove total bacterial productivity of 1011 g C (∼1023 cells). Such productivity is sufficient to double the bacterial population in the deep plume horizon (1,000–1,300 m depth) over an area of 30,000 km2 and generate a regional oxygen anomaly of 1012 g. Published observations suggest that this process began within weeks of the initial irruption (9, 10, 13) and progressed over a period of ∼120 d, by which point the natural gases had been consumed and the fluorescence anomaly in the deep plume had been strongly attenuated (2). These observations, made during the DWH event, serve to ground truth our models’ predictions of the temporal and spatial distributions for microbial growth and metabolism.
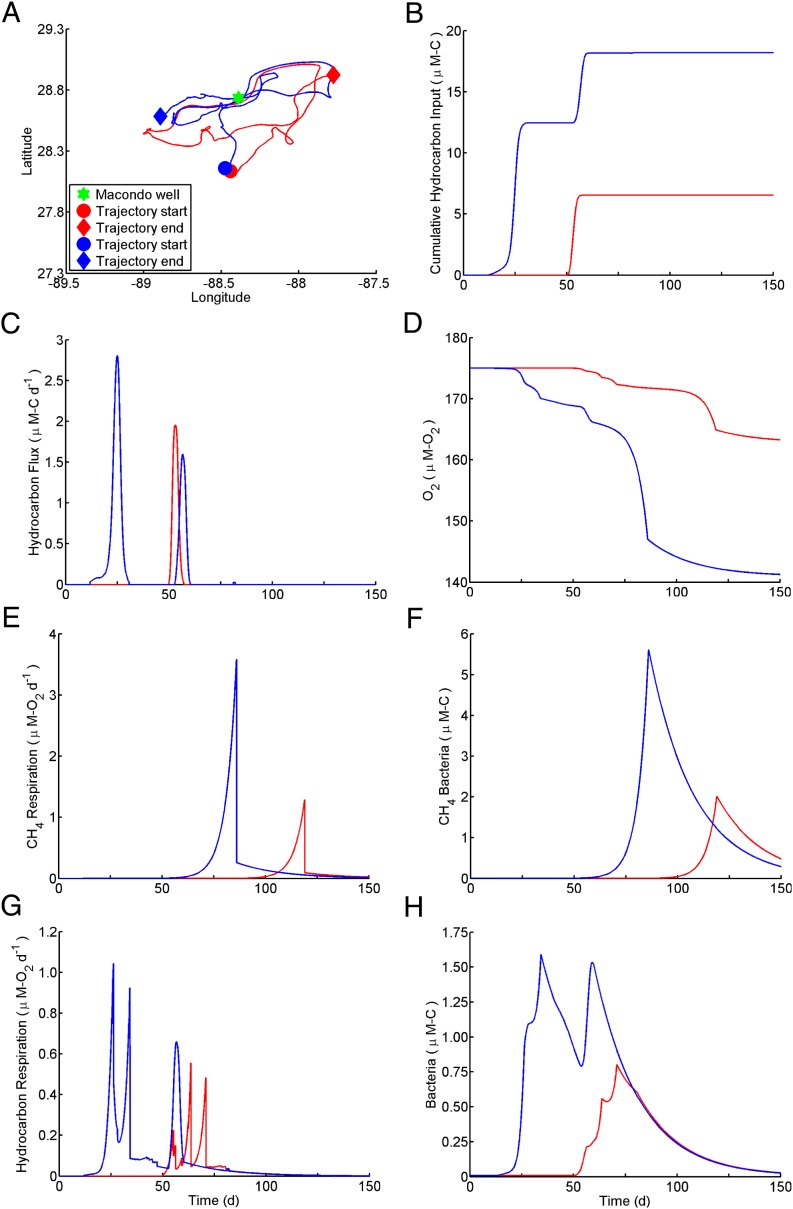
Under our model, when a water parcel first encounters a hydrocarbon source, a seed population of active hydrocarbon-degrading cells, present at low abundance in all waters, begins to grow. As growth progresses, OMTs outpace the influx of their preferred substrates, giving sequential pulses of respiration as different OMTs flourish and then fade (Fig. 1). The timing of respiratory pulses is controlled primarily by the growth rates of the responsible OMTs, initial abundance of active cells, and duration of source exposure. The model shows initial pulses of growth and respiration linked to butane and pentane followed by sequential pulses from consumption of propane and other short-chain alkanes, ethane, aromatic hydrocarbons, and finally, methane.
Fig. 1.
An analysis of the autoinoculation effect through comparison of two water parcels with single- (red) and double- (blue) exposure histories. (A) Trajectories of two water parcels for 150 d starting April 23, 2010. (B) Time course of cumulative hydrocarbon input to the parcels at the proportions shown in Table S1. (C) Time course of hydrocarbon flux into the two parcels at the proportions shown in Table S1. (D) Time course of dissolved oxygen concentration in the parcels attributed to hydrocarbon respiration. (E) Time course of respiration rate linked to methane consumption in the two parcels. (F) Time course of bacterial growth for organisms consuming methane (Met and Met′). (G) Time course of respiration rate linked to consumption of 25 nonmethane hydrocarbons in the two parcels. (H) Time course of bacterial growth for organisms consuming 25 nonmethane hydrocarbons (excludes Met and Met′). Units for bacterial abundance are shorthand for micromoles carbon per liter.
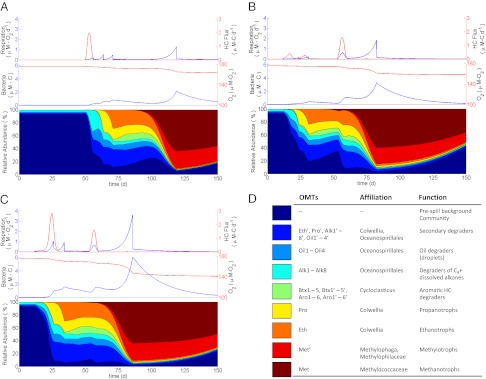
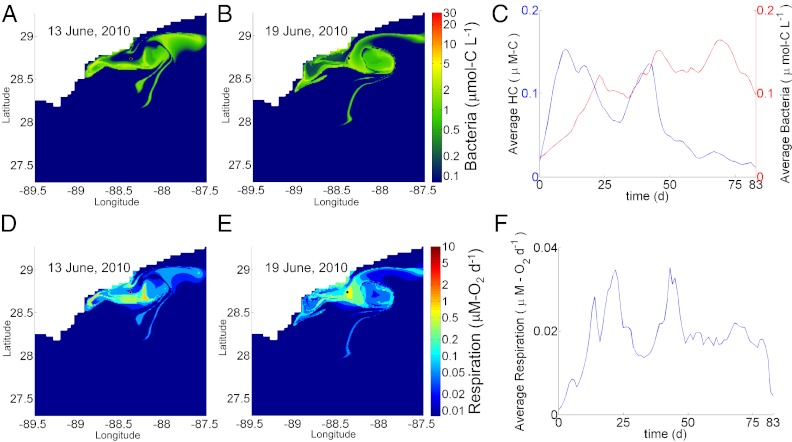
By injecting the hydrocarbons into moving parcels of water, the model generates a complex spatial pattern of bacterial growth and metabolism (Movie S1) and reveals associated feedback mechanisms. Tracking individual water parcels as they advect reveals that many parcels come into contact with the hydrocarbon source on multiple occasions (Fig. 1). A parcel's first encounter with hydrocarbons feeds staggered pulses of respiration and successive blooms of individual OMTs (Fig. 2A), and residual hydrocarbon-degrading OMT abundances remain elevated above background. We apply the term autoinoculation to describe the priming effect that occurs when hydrocarbons are introduced into such a previously exposed parcel. When hydrocarbons irrupt into the previously exposed parcel, the elevated abundance of hydrocarbon-degrading OMTs allows simultaneous consumption of different compounds at rates substantially faster than occurred after initial exposure. This effect is apparent in Fig. 1 by comparing bacterial abundance (Fig. 1H) with respiration pulses (Fig. 1G) for single (red) vs. double (blue) exposure cases, noting that, after the second exposure occurs at 53 d, previously irregular growth and respiratory pulses are collapsed into single peaks. In the case of methane, growth (Fig. 1E) and respiration (Fig. 1F) associated with the second exposure are subsumed into a single pulse paced by the timing of the initial exposure. Collapse of the respiratory succession leads to subtle changes in bacterial community structure (Fig. 2), thereby avoiding the dramatic changes in OMT abundance and community structure that followed the initial exposure. Autoinoculation seems to have played an important role in suppressing hydrocarbon buildup in the deep plume; because discharge from the well continued for so long, roughly one-half of the total irruptive hydrocarbon discharge entered preexposed waters. In one instance (Fig. 3), the model predicts that waters returning from the northwest in mid-June persisted over the wellhead until mid-July when discharge ceased, resulting in what we term an autoinoculation event. Crucially, the accelerated respiration resulting from this event both drove down levels of nonmethane hydrocarbons and stabilized the overall respiration rate, which had previously been more variable (Fig. 3).
Fig. 2.
Comparison of microbial community dynamics in water parcels with different exposure histories, all starting April 23, 2010. (A) Time course change in hydrocarbon flux (red) and respiration rate (blue) shown in Top, dissolved oxygen concentration (red) and bacterial abundance (blue) shown in Middle, and relative composition of the microbial community shown in Bottom for a parcel experiencing a single exposure. (B) Time course changes as described for A for a parcel experiencing a triple exposure. (C) Time course changes as described in A for a parcel experiencing a double exposure. (D) Tabulated legend identifying the OMTs, their putative phylogenetic affiliation, and their ecosystem function.
Fig. 3.
Impact of recirculation on hydrocarbon abundance, bacterial population, and metabolism. (A and B) Spatial distribution of bacterial abundance before (A) and during (B) the early stages of an autoinoculation event. (C) Time course change in average abundance for bacteria consuming nonmethane hydrocarbons and the average summed concentration of these chemicals integrated over the computational domain. (D and E) Spatial distribution of hydrocarbon respiration rate before (D) and during (E) the early stages of the same autoinoculation event. (F) Time course change in the average respiration rate for bacteria consuming nonmethane hydrocarbons, integrated over the computational domain. Because the size of the computation domain is 2° latitude × 2° longitude, a small number of parcels exit the domain near the end of the simulation.
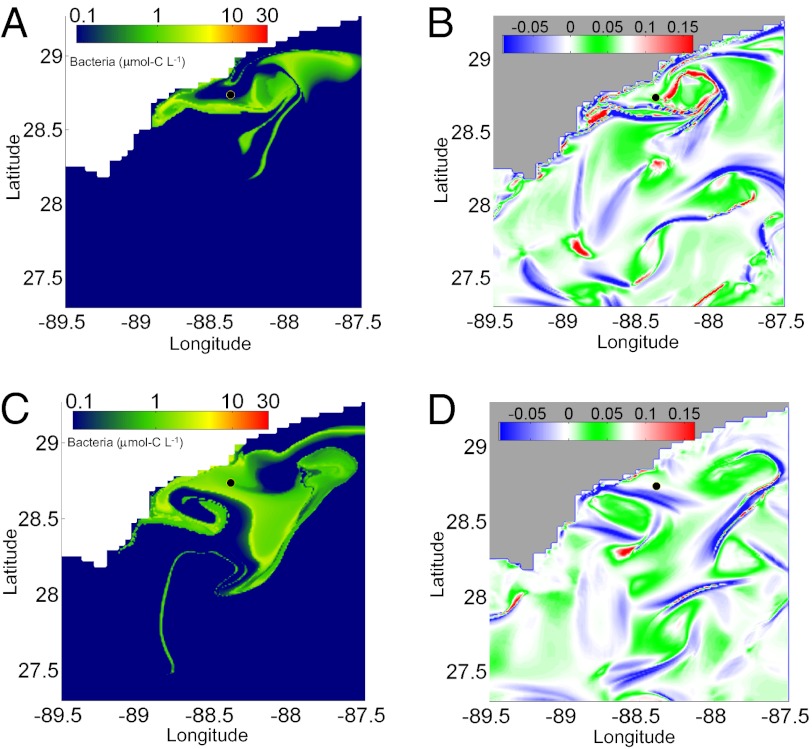
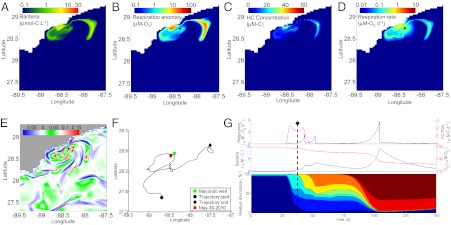
Currents and mixing processes modulated the distribution and activity of bacteria in the deep Gulf of Mexico, frequently reintroducing water parcels to the source area. Analysis of our model simulations shows that mixing features of the flow field influenced the chemical and microbial distributions at plume depth. Comparison of figures representing bacterial abundance and hypergraph maps (Fig. 4 A and C vs. Fig. 4 B and D) indicates that blue mesohyperbolic features in the hypergraph map accumulate high bacterial density; such features act as convergence zones for the advected reacting field. The green mesoelliptic zones in the flow field cause a swirling, recurrent motion of the water and the associated bacterial population (Fig. 4 A and B). This association indicates that the spatial distribution of the nonlinearly reacting flow field is strongly affected by the velocity field mixing features. Their importance for the autoinoculation mechanism is particularly evident in Fig. 4B, where the hypergraph map indicates large mixing events around the well that are visualized by the mixture of red and blue. Mesoelliptic zones influenced bacterial communities, such as in late May of 2010, when such a zone promoted a buildup of hydrocarbons in the vicinity of the wellhead (Fig. 5). This recirculation feature may have provided a false impression of a plume emanating to the southwest, which was reported for that time (13). Mesohyperbolic features may have also been inadvertently identified during the spill, such as in June of 2010 (Fig. S1), when a sinuous plume was tracked to the west of the wellhead (7).
Fig. 4.
Comparison of physical and biological features. (A) Spatial distribution of bacterial abundance on June 13, 2010. (B) Hypergraph map on June 13, 2010. (C) Spatial distribution of bacterial abundance on June 30, 2010. (D) Hypergraph map on June 30, 2010. For the hypergraphs, blue indicates mesohyperbolic regions, red indicates mesohyperbolicity with shear, and green indicates elliptic regions in which eddies are formed. The scaled units for the hypergraphs are defined in ref. 16.
Fig. 5.
Spatial and temporal context for development of bacterial communities reported by Hazen et al. (13) for May 30, 2010. (A) Spatial distribution of bacterial abundance for primary hydrocarbon consumers on May 30, 2010. (B) Spatial distribution of the dissolved oxygen anomaly formed from hydrocarbon respiration on May 30, 2010. (C) Spatial distribution of total hydrocarbons (sum of 26 compounds or classes) on May 30, 2010. (D) Spatial distribution of respiration rate for hydrocarbon oxidation on May 30, 2010. (E) Seven-day hypergraph for May 30, 2010, showing mixing regimens and highlighting a mesoelliptic zone where an eddy has set up to the southwest of the wellhead. Scaled units are defined in ref. 16. (F) One hundred fifty-day trajectory of a water parcel located near the position of sampling (13) on May 30, 2010. (G) Time course changes for the water parcel for which the trajectory is shown in F (as per Fig. 2); May 30, 2010 is shown as a dashed line. The location of the Macondo well is denoted by a black circle in A–E. Samples collected by Hazen et al. (13) on this day were within the symbol denoting the wellhead. Note the log scales for A, B, and D.
We find good agreement between the model and available data with respect to both plume motion and location and microbial community distribution and activity. The plume was reported to emanate to the southwest (2, 7–9) at some times and the northeast at other times (10), eventually migrating to the southwest (2) in August of 2010; the modeled current oscillates between the northeast and southwest, with eventual migration to the southwest in August of 2010. Samples collected close to the ruptured well in June of 2010 showed different degrees of hydrocarbon degradation (7, 9, 10, 13); the model predicts that previously exposed water returned to the wellhead at this time (Fig. 3), leading to mixed levels of biodegradation in the vicinity of the wellhead. Samples of these waters revealed blooms of Colwellia and a biodegradation preference for propane over ethane over methane (9, 10); the model predicts concurrent blooms of OMTs mapped to Colwellia, which have been linked to consumption of ethane and propane (21). The model provides for abundant methanotroph and methylotroph production, which was observed in September and October of 2010 (2), and it independently arrives at the debated scenario (23–25) in which methanotrophs and methylotrophs constitute a significant portion of the bacterial community, even with no detectable oxygen anomaly (e.g., respiration of 0.05 μM CH4 yields a maximum oxygen anomaly of 0.1 μM, below the detection limit; the resulting bacterial biomass, a maximum of 0.025 μmol C L−1, would constitute up to 20% of the background community with no apparent oxygen anomaly, consistent with our previous observation) (2). Hazen et al. (13) observed that, on May 30, 90–95% of the microbial community in the peak plume horizon southwest of the wellhead was Oceanospirillales; the model predicts ∼80% of the bacterial population as OMTs mapped to Oceanospirillales at this place and time (Fig. 5). Likewise, column-integrated bacterial productivity in the deep plume at this place and time was modeled to be 0.16 mol-C m−2 (ranging from 0.05 to 0.50 mol-C m−2 within 5 km); this finding is in good agreement with the calculated value of 0.20 mol-C m−2 based on a 3.9 × 10⁷-cells L−1 density of Oceanospirillales (13), cell carbon content (Table S1) of 5.0 × 10⁻¹³ g-C cell−1, and local plume thickness of 120 m (13). The locations of observed oxygen anomalies were also consistent with model results as in Movie S2. In this simulation, we compare the presence or absence of oxygen anomalies from 190 hydrocasts conducted during the time of active discharge (2, 7–10, 13, 26) with the contemporaneous model output. We find a 72% match rate; kilometer-scaled heterogeneity may account for up to 93% of the remaining observations for which the model incorrectly predicted as anomalies.
Nonetheless, some discrepancies are apparent between model and observation, particularly as the time course modeled grows longer. Most notably, the model underpredicts the velocity of plume migration in August and September of 2010, with a concurrent latitudinal offset; although the model properly moves the plume to the southwest, observations show the plume arriving ∼2 wk earlier and ∼20 km farther south than the model's prediction. The model also fails to capture the small-scale spatial heterogeneity apparent from response efforts. This discrepancy is attributable to the model's ∼4-km grid size, the Gaussian input of hydrocarbons, and the even distribution of hydrocarbons within the depth horizon. Unfortunately, because sampling typically targeted the anomalies, local heterogeneity also complicates direct comparison of model output and chemical data. Although model tuning improves our ability to match observations, we find great use in explaining biogeochemical and microbiological observations from fundamental principles of chemistry, microbiology, and ocean physics without the need for tuning or optimization.
In light of the model's overall success, we considered how it might inform the interpretation of results from previous studies. First, the inclusion of physical dynamics corroborates a previous hypothesis (23, 25) for why the extensive and persistent oxygen depletion predicted in the deep plume horizon by Joye et al. (9) was not observed. Second, the physical dynamics also suggest a more complex flow field than the laminar flow used by Hazen et al. (13) to estimate hydrocarbon half-lives associated with the bloom, thus calling the accuracy of the reported half-lives into question. Finally, the modeled flow regimen predicts that a sinuous plume similar to the plume identified in the work by Camilli et al. (7) may not have come directly from the wellhead but rather, had first traveled northeast before recirculation to the southwest (Fig. S1). Although its predictions cannot be conclusive, this model, thus, provides a useful holistic context for the interpretation of biological, chemical, and physical observations.
Our results suggest that currents and mixing processes accelerated hydrocarbon biodegradation and structured microbial ecology during the DWH event through priming of the native microbiota residing in water parcels that recirculated around the ruptured well. Although memory effects are common in enclosed environments and physical processes are known to shape microbial biogeography (27), we suggest that such a dynamic autoinoculation effect may be of broad importance to deep ocean environments. The impacts on ocean biogeochemistry and microbiology may encompass point sources, such as hydrothermal vents and hydrocarbon seeps, but may also include suboxic water masses, organic-rich sediment deposits, flushing of silled basins, and regions receiving high-export flux. For ocean waters susceptible to contamination from events such as the DWH, a major challenge remains to predict how physical dynamics, chemistry, and microbiology interact to set the timescale and extent of the microbial response.
Supplementary Material
Acknowledgments
We thank M. Du, R. Camilli, C. Reddy, and J. Kessler for providing anomaly locations and S. Bagby for comments. This research was supported by National Science Foundation Grants OCE-0961725 and EAR-0950600 (to D.L.V.), Department of Energy Award DE-NT0005667 (to D.L.V.), Office of Naval Research Award ONR MURI N00014-11-1-0087 (to I.M.), and the Naval Research Laboratory Core Project Full Column Mixing for Numerical Ocean Models (P.J.H.).
Footnotes
The authors declare no conflict of interest.
This article is a PNAS Direct Submission.
This article contains supporting information online at www.pnas.org/lookup/suppl/doi:10.1073/pnas.1108820109/-/DCSupplemental.
References
- 1.McNutt M, et al. Assessment of Flow Rate Estimates for the Deepwater Horizon/Macondo Well Oil Spill. Flow Rate Technical Group Report to the National Incident Command, Interagency Solutions Group, March 10, 2011. 2011. [Google Scholar]
- 2.Kessler JD, et al. A persistent oxygen anomaly reveals the fate of spilled methane in the deep Gulf of Mexico. Science. 2011;331:312–315. doi: 10.1126/science.1199697. [DOI] [PubMed] [Google Scholar]
- 3.Reddy CM, et al. Composition and fate of gas and oil released to the water column during the Deepwater Horizon oil spill. Proc Natl Acad Sci USA. 2012;109:20229–20234. doi: 10.1073/pnas.1101242108. [DOI] [PMC free article] [PubMed] [Google Scholar]
- 4.Ryerson TB, et al. Atmospheric emissions from the Deepwater Horizon spill constrain air-water partitioning, hydrocarbon fate, and leak rate. Geophys Res Lett. 2011;38:L07803. [Google Scholar]
- 5.Socolofsky SA, Adams EE. Role of slip velocity in the behavior of stratified multiphase plumes. J Hydraul Eng. 2005;131:273–282. [Google Scholar]
- 6.Socolofsky SA, Adams EE, Sherwood CR. Formation dynamics of subsurface hydrocarbon intrusions following the Deepwater Horizon blowout. Geophys Res Lett. 2011;38:L09602. [Google Scholar]
- 7.Camilli R, et al. Tracking hydrocarbon plume transport and biodegradation at Deepwater Horizon. Science. 2010;330:201–204. doi: 10.1126/science.1195223. [DOI] [PubMed] [Google Scholar]
- 8.Diercks AR, et al. Characterization of subsurface polycyclic aromatic hydrocarbons at the Deepwater Horizon site. Geophys Res Lett. 2010;37:L20602. [Google Scholar]
- 9.Joye SB, MacDonald IR, Leifer I, Asper V. Magnitude and oxidation potential of hydrocarbon gases released from the BP oil well blowout. Nat Geosci. 2011;4:160–164. [Google Scholar]
- 10.Valentine DL, et al. Propane respiration jump-starts microbial response to a deep oil spill. Science. 2010;330:208–211. doi: 10.1126/science.1196830. [DOI] [PubMed] [Google Scholar]
- 11.Kujawinski EB, et al. Fate of dispersants associated with the Deepwater Horizon oil spill. Environ Sci Technol. 2011;45:1298–1306. doi: 10.1021/es103838p. [DOI] [PubMed] [Google Scholar]
- 12.Yvon-Lewis SA, Hu L, Kessler JD. Methane flux to the atmosphere from the Deepwater Horizon oil disaster. Geophys Res Lett. 2011;38:L01602. [Google Scholar]
- 13.Hazen TC, et al. Deep-sea oil plume enriches indigenous oil-degrading bacteria. Science. 2010;330:204–208. doi: 10.1126/science.1195979. [DOI] [PubMed] [Google Scholar]
- 14.Operational Science Advisory Team . Summary Report for Sub-Sea and Sub-Surface Oil and Dispersant Detection: Sampling and Monitoring, a Report to Unified Area Command, December 17, 2010. 2010. [Google Scholar]
- 15.Ryerson TB, et al. Chemical data quantify Deepwater Horizon hydrocarbon flow rate and environmental distribution. Proc Natl Acad Sci USA. 2012;109:20246–20253. doi: 10.1073/pnas.1110564109. [DOI] [PMC free article] [PubMed] [Google Scholar]
- 16.Mezić I, Loire S, Fonoberov VA, Hogan P. A new mixing diagnostic and Gulf oil spill movement. Science. 2010;330:486–489. doi: 10.1126/science.1194607. [DOI] [PubMed] [Google Scholar]
- 17.Adcroft A, et al. Simulation of underwater plumes of dissolved oil in the Gulf of Mexico. Geophys Res Lett. 2010;37:L18605. [Google Scholar]
- 18.Button DK, Robertson BR, Lepp PW, Schmidt TM. A small, dilute-cytoplasm, high-affinity, novel bacterium isolated by extinction culture and having kinetic constants compatible with growth at ambient concentrations of dissolved nutrients in seawater. Appl Environ Microbiol. 1998;64:4467–4476. doi: 10.1128/aem.64.11.4467-4476.1998. [DOI] [PMC free article] [PubMed] [Google Scholar]
- 19.Redmond MC, Valentine DL, Sessions AL. Identification of novel methane-, ethane-, and propane-oxidizing bacteria at marine hydrocarbon seeps by stable isotope probing. Appl Environ Microbiol. 2010;76:6412–6422. doi: 10.1128/AEM.00271-10. [DOI] [PMC free article] [PubMed] [Google Scholar]
- 20.Desai JD, Banat IM. Microbial production of surfactants and their commercial potential. Microbiol Mol Biol Rev. 1997;61:47–64. doi: 10.1128/mmbr.61.1.47-64.1997. [DOI] [PMC free article] [PubMed] [Google Scholar]
- 21.Redmond MC, Valentine DL. Natural gas and temperature structured a microbial community response to the Deepwater Horizon oil spill. Proc Natl Acad Sci USA. 2012;109:20292–20297. doi: 10.1073/pnas.1108756108. [DOI] [PMC free article] [PubMed] [Google Scholar]
- 22.Methé BA, et al. The psychrophilic lifestyle as revealed by the genome sequence of Colwellia psychrerythraea 34H through genomic and proteomic analyses. Proc Natl Acad Sci USA. 2005;102:10913–10918. doi: 10.1073/pnas.0504766102. [DOI] [PMC free article] [PubMed] [Google Scholar]
- 23.Kessler JD, Valentine DL, Redmond MC, Du M. Response to comment on “A persistent oxygen anomaly reveals the fate of spilled methane in the deep Gulf of Mexico.”. Science. 2011;332:1033. doi: 10.1126/science.1199697. [DOI] [PubMed] [Google Scholar]
- 24.Joye SB, et al. Comment on “A persistent oxygen anomaly reveals the fate of spilled methane in the deep Gulf of Mexico.”. Science. 2011;332:1033. doi: 10.1126/science.1203307. [DOI] [PubMed] [Google Scholar]
- 25.Nihous G. Ocean science: Gulf of Mexico aftermath. Nat Geosci. 2011;4:141–142. [Google Scholar]
- 26.National Oceanographic Data Center, National Oceanic and Atmospheric Administration Available at http://www.nodc.noaa.gov/General/DeepwaterHorizon/oceanprofile.html. Accessed August 14, 2011.
- 27.Galand PE, Potvin M, Casamayor EO, Lovejoy C. Hydrography shapes bacterial biogeography of the deep Arctic Ocean. ISME J. 2010;4:564–576. doi: 10.1038/ismej.2009.134. [DOI] [PubMed] [Google Scholar]
Associated Data
This section collects any data citations, data availability statements, or supplementary materials included in this article.


