Abstract
Purpose: Abnormalities in single photon emission computed tomography (SPECT) perfusion within the lung and heart are often detected following radiation for tumors in/around the thorax (e.g., lung cancer or left-sided breast cancer). The presence of SPECT perfusion defects is determined by comparing pre- and post-RT SPECT images. However, RT may increase the density of the soft tissue surrounding the lung/heart (e.g., chest wall/breast) that could possibly lead to an “apparent” SPECT perfusion defect due to increased attenuation of emitted photons. Further, increases in tissue effective depth will also increase SPECT photon attenuation and may lead to “apparent” SPECT perfusion defects. The authors herein quantitatively assess the degree of density changes and effective depth in soft tissues following radiation in a series of patients on a prospective clinical study.
Methods: Patients receiving thoracic RT were enrolled on a prospective clinical study including pre- and post-RT thoracic computed tomography (CT) scans. Using image registration, changes in tissue density and effective depth within the soft tissues were quantified (as absolute change in average CT Hounsfield units, HU, or tissue thickness, cm). Changes in HU and tissue effective depth were considered as a continuous variable. The potential impact of these tissue changes on SPECT images was estimated using simulation data from a female SPECT thorax phantom with varying tissue densities.
Results: Pre- and serial post-RT CT images were quantitatively studied in 23 patients (4 breast cancer, 19 lung cancer). Data were generated from soft tissue regions receiving doses of 20–50 Gy. The average increase in density of the chest was 5 HU (range 46 to −69). The average change in breast density was a decrease of −1 HU (range 13 to −13). There was no apparent dose response in neither the dichotomous nor the continuous analysis. Seventy seven soft tissue contours were created for 19 lung cancer patients. The average change in tissue effective depth was +0.2 cm (range −1.9 to 2.2 cm). The changes in HU represent a <2% average change in tissue density. Based on simulation, the small degree of density and tissue effective depth change is unlikely to yield meaningful changes in either SPECT lung or heart perfusion.
Conclusions: RT doses of 20–50 Gy can cause up to a 46 HU increase in soft tissue density 6 months post-RT. Post-RT soft tissue effective depth may increase by 2.0 cm. These modest increases in soft tissue density and effective depth are unlikely to be responsible for the perfusion changes seen on post-RT SPECT lung or heart scans. Further, there was no clear dose response of thesoft tissue density changes. Ultimately, the authors findings suggest that prior perfusion reports do reflect changes in the physiology of the lungs and heart.
Keywords: thoracic, soft tissue, SPECT, radiation therapy, tissue density
INTRODUCTION
Our group has studied the effect of radiation (RT) on regional lung and heart perfusion as assessed by single photon emission computed tomography (SPECT).1, 2, 3, 4, 5, 6 With this technique, changes in regional perfusion are quantified from a series of SPECT images of the lungs and heart obtained pre- and post-RT. Each individual SPECT scan is generated based on the number of photons emitted from the lung (or heart) that are detected at various orientations around the chest. There are a series of approximations made regarding the shape/effective depth, and density, of the soft tissues surrounding the lung and heart, that make exact quantification of these scans uncertain. In brief, it is essentially assumed that the external body contour is approximately cylindrical-like. Since our prior studies always compared pre-RT and post-RT images, inaccuracies inherent in the assumed external patient contour would be consistent across the perfusion scans and were assumed not likely to influence our results. Nevertheless, it is possible that the RT alters the external body contour and/or the density of the soft tissues—either of which can affect the photon attenuation and the resultant SPECT scan. For example, RT-induced fibrosis7, 8, 9, 10 may increase the tissue effective depth or density, increasing attenuation, resulting in fewer photons reaching the SPECT gamma camera detectors, which might cause a false positive perfusion defect.
Our current methods do not address this potential confounding factor. In order to assess for the magnitude of RT-induced changes in soft tissue density or effective depth on SPECT images, we herein quantify radiation-induced changes in chest wall soft tissue density and effective depth in patients receiving RT for breast or lung cancer.
METHODS AND MATERIALS
The pre- and 6-month post-RT computed tomography (CT) images of 23 patients were quantitatively analyzed. Free breathing helical CTs were performed on all patients, as 4D technology was not available at the time that the images for this study were obtained. Nineteen patients had lung cancer and received SPECT lung perfusion scans pre- and post-RT. The traditional fields for the lung cancer patients included concurrent AP/PA beams with sequentially treated two off-cord obliques to a target dose of 60–70 Gy delivered in 2 Gy fractions. Four patients had breast cancer and received cardiac SPECT perfusion scans pre- and post-RT. The RT method for the breast cancer patients included 2 “parallel opposed” oblique tangential beams delivering a target dose of roughly 46 Gy, followed by an electron boost to the tumor bed of ≈14–16 Gy, at ≈2 Gy/fraction.
On the pre-RT and corresponding post-RT CT images in the patients irradiated for breast cancer, a region of the breast (well within the RT field) was defined. This volume excluded the rib and chest wall musculature since modest errors in patient setup might alter the dose received by these tissues. Similarly, in the pre-RT and corresponding post-RT CT images in the patients irradiated for lung cancer, soft tissue regions (e.g., fat, muscle) that were well within the high dose region were defined. These regions excluded the lung tissue. These volume definitions were done by manually segmenting the images using our in-house treatment planning system PlanUNC (PLUNC). All segmentations for all analyzed images were created by a single investigator (M.S.). Software was incorporated into PLUNC to produce a frequency distribution (histogram) of CT Hounsfield Units (HUs) within each segmented structure. The histograms of CT HUs were used to define the density characteristics of the soft tissue regions. The mean dose for each volume was also determined.
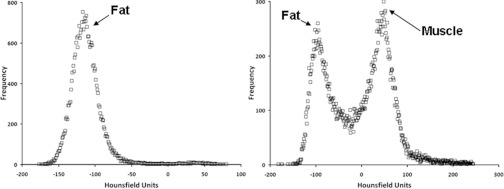
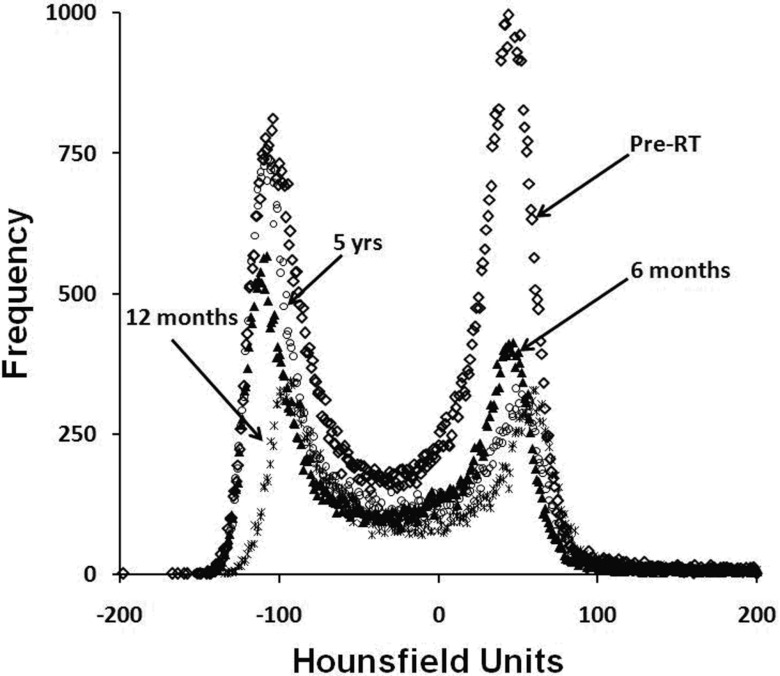
Typical CT density histograms are shown in Fig. 1. The peaks correspond to the predominate tissues in the breast, bone, and general soft tissues (e.g., fat/muscle) as noted. Changes in the location of the particular density spikes at 6 months post-RT were taken to reflect RT-induced changes in density. Specifically, a shift in a peak to the left denotes a reduction in density, and conversely a shift to the right denotes an increase in tissue density.
Figure 1.
CT histograms for two different soft tissue structures.
A previous computational phantom study examined what change in soft tissue density is required to produce a false positive cardiac perfusion defect following radiation for left sided breast cancer.11 The attenuation of the photons emitted from the SPECT signal was increased by modeling an increase in soft tissue density. The study revealed that a 20% increase in attenuation is necessary to produce a false positive perfusion defect of the magnitude seen in our prior study patients. This 20% increase in attenuation corresponds to an increase in soft tissue density of ≥150 HU (of essentially the entire breast and associated soft tissue of the anterior chest). Therefore, we will assess the incidence of shifts in the CT histogram peaks of at least 150 HU on the post-RT images (i.e., to reflect a possible false positive perfusion defect).
All SPECT scans were performed using 99mTc as the contrast agent. The average photon energy emitted by 99mTc is 141 keV, and this corresponds to a linear attenuation coefficient of 1.50 × 10⁻¹ cm−1 in water. Based upon Eq. 1 it is evident that a 20% increase in the linear attenuation coefficient (μ) is equivalent to a 20% increase in the tissue effective depth. A 20% increase in the linear attenuation coefficient of water results in a μtissue of 1.80 × 10⁻¹ cm−1. Based on the relationship between linear attenuation coefficients and CT hounsfield units [Eq. 2] a 20% increase in tissue effective depth of water density results in a 200 HU increase:
| (1) |
| (2) |
In this study, we specifically did not attempt to compare the heights of the CT histogram peaks. The heights of the peaks will change due to different scanning characteristics. Higher resolution scans will have more pixels per volume of interest (VOI) compared to lower resolution scans. Such a difference in pixel count will cause the histogram peaks to be at different heights. Also, since the VOIs were manually segmented, subtle variations between the pre- and post-RT CT volumes will result in different peak heights.
The effective depth of the chest tissues were also compared on the pre- vs. post-RT CT images. In this study we examined the pre- and post-RT soft tissue effective depth to determine if a 20% increase in tissue effective depth, corresponding to a 20% increase in attenuation, could possibly occur, resulting in a possible false-positive perfusion defect. Software was incorporated into PLUNC to calculate the thickness of the soft tissue segmentations from above. The thickness of each segmentation slice was reported in cm, and the average segmentation thicknesses were calculated for both the pre- and 6-month post-RT data. The change in effective depth at 6 months post-RT was calculated as the difference between the average pre-RT and the average post-RT soft tissue segmentation for each patient.
All 23 patients studied had a pre-RT planning CT and 6-month post-RT follow-up CT scan. Four patients received further follow-up CT scans ranging from 1 to 5 yr post-RT. Soft tissue densities and effective depths were examined for all available image sets, and the HU value corresponding to each peak was determined analytically.
In order to assess the effect of free breathing lung motion on changes in tissue effective depth and density, five helical 4D lung CT scans were analyzed. Lateral and anterior soft tissue regions were defined on the full inspiration and full expiration CT scans. CT histograms were created for the contours and analyzed to determine the magnitude of the shifts between the histogram peaks. Changes in contour thickness were also examined for the 4D images.
Statistical analysis was performed to determine if the resulting attenuation seen post-RT due to the combined effects of changes in soft tissue effective depth and density correspond to the theoretical attenuation values based upon our previous phantom study. A second statistical analysis was performed to see if the SPECT signal attenuation seen post-RT was different from the attenuation seen pre-RT. The statistical software R was used to perform Wilcoxon unpaired sign rank tests comparing the difference in means. All p-values calculated are two sided.
RESULTS
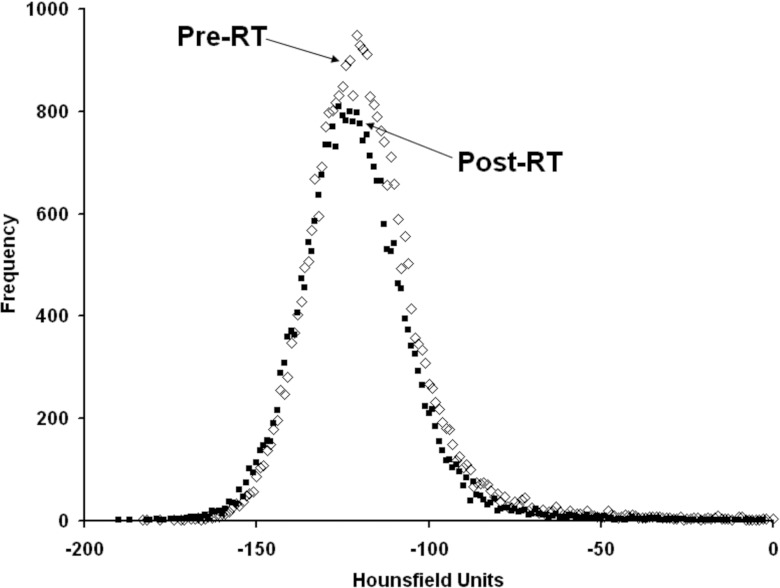
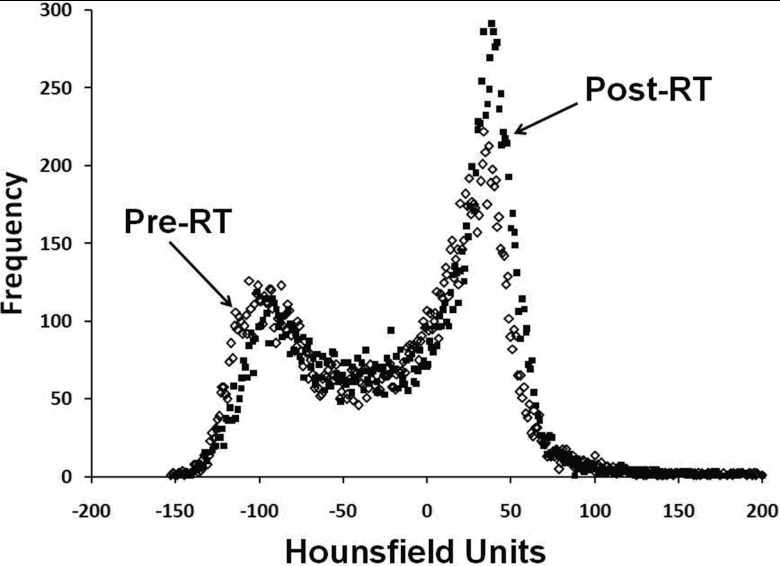
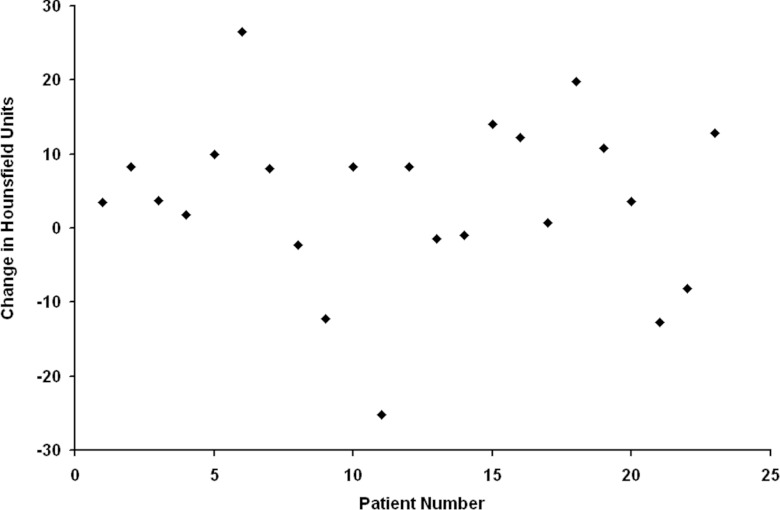
Figures 23 illustrate the typical findings for breast and lung cancer patients, respectively. The degree of shift in the CT density peaks for all 23 patients is shown in Fig. 4. The average change in breast and soft tissue density at 6 months post-RT was (mean ± 1 standard deviation) −1 HU (range: 13 to −13 HU) and 5 ± 15 HU, respectively. Overall, there are modest (<50 HU) increases in the location of the CT density peaks on the post- vs pre-RT images. Patients with extended follow-up also show similar results with only modest shifts in the position of CT peaks, as shown in Fig. 5.
Figure 2.
A CT HU histogram plot of breast soft tissue structure pre- and 6 months post-RT.
Figure 3.
A CT HU histogram for soft tissues surrounding the thorax pre- and post-RT.
Figure 4.
Plot of the average change in CT-density for each patient (post-RT minus pre-RT).
Figure 5.
CT HU histogram data for a patient with extended follow-up.
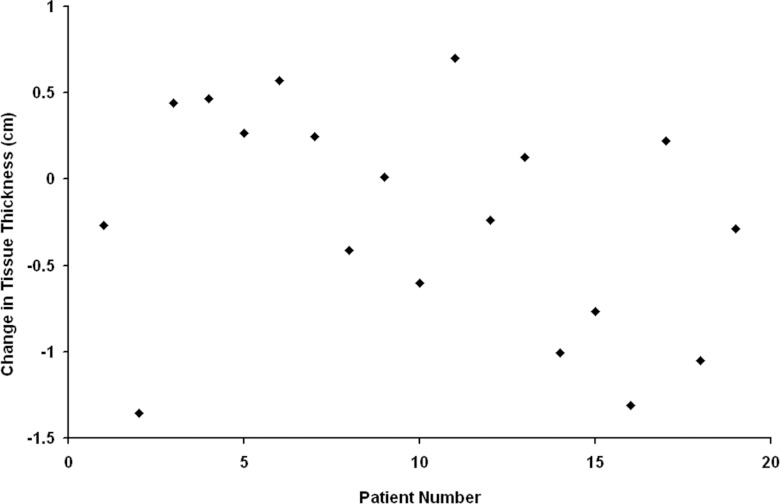
Pre- and serial post-RT CT images were quantitatively studied in 19 lung cancer patients. Data were generated from 77 soft tissue contours that were within the RT beams. The degree of change in tissue effective depth for the 19 lung cancer patients is shown in Fig. 6. A 38% (29/77) of the chest contours had an increase in soft tissue effective depth. The overall average change in soft tissue effective depth was +0.2 cm. For the different regions of interest, the average changes were: anterior 0.2 ± 1.0 cm, posterior 0.2 ± 0.7 cm, left 0.1 ± 0.8 cm, and right 0.4 ± 0.8 cm. Of the 29 soft tissue contours with increases in effective depth, only 6 were deemed large enough to possibly produce a perfusion defect (i.e., >20%).
Figure 6.
Plot of the average change in tissue thickness for the 19 patents with lung cancer (post-RT minus pre-RT).
SPECT signal attenuation is a function of both soft tissue effective depth and density. The attenuation of the SPECT signal was calculated for all 77 soft tissue contours. The average pre-RT effective depths and peak HU values for each contour were combined to determine the resulting attenuation. The attenuation values (mean ± standard deviation) seen for the left, right, anterior, and posterior pre-RT contours were the following: 0.87 ± 0.04, 0.87 ± 0.03, 0.87 ± 0.06, and 0.88 ± 0.03. The attenuation values (mean ± standard deviation) calculated for the left, right, anterior, and posterior post-RT contours were the following: 0.87 ± 0.04, 0.88 ± 0.03, 0.87 ± 0.06, and 0.89 ± 0.03. Our theoretical phantom study revealed that a 20% increase in attenuation is needed to produce a false positive perfusion defect. This 20% increase was applied to the pre-RT attenuation calculations resulting in the following theoretical “false positive perfusion defect” post-RT attenuation values (mean ± standard deviation) for the left, right, anterior, and posterior contours: 0.70 ± 0.03, 0.70 ± 0.03, 0.69 ± 0.04, and 0.71 ± 0.02.
The effect of lung motion on soft tissue density and effective depth changes was addressed by examining five helical 4D scans. There is minimal effect between lung motion and changes in soft tissue density. We found that the CT histogram peaks for soft tissue contours varied by at most 3 HU between the full inspiration and expiration scans. Lung motion has a minimal effect on soft tissue contour thickness. The change in contour thickness for the anterior and lateral 4D contours were 1.8 ± 1.5 mm and 2.2 ± 1.6 mm, respectively. Based on these 4D scans, lung motion does not significantly alter soft tissue effective depth or density for a given region of interest.
A Wilcoxon unpaired sign rank test comparing the difference in means was performed to determine if the pre-RT and post-RT attenuation values are statistically similar. The resulting p-values for all contours were >0.50, therefore, there is no statistical difference between the pre-RT and post-RT attenuation values. A second Wilcoxon unpaired sign rank test was performed to determine if the post-RT attenuation values are statistically similar to the attenuation values required to produce a false positive perfusion defect. The resulting p-values for all contours were <0.001, therefore the post-RT attenuation values are not sufficient to result in an “apparent” perfusion defect.
DISCUSSION
This analysis suggests that the magnitude of RT-induced changes in CT density within the soft tissue, and in their effective depth, is modest, and thus unlikely to be the source of RT-induced changes in SPECT perfusion heart and lung scans. In a prior theoretical study, we computed the apparent reduction in regional perfusion that might be perceived with various increases in photon attenuation from surrounding soft tissues. Increases in photon attenuation from surrounding soft tissues can be a function of RT-induced increased soft tissue density or increased soft tissue effective depth. Our prior study noted that increases in attenuation of the magnitude of 20% (corresponding to an increase in HU of 150 or a 20% increase in tissue effective depth) might lead to a “false positive” change in SPECT perfusion scans. The current analysis based on real patient images suggests that the magnitude of those changes after RT is indeed extremely small.
This analysis does not address potential changes in the shapes/size of the soft tissue post-RT, which may influence the perfusion scans. This study has several other limitations. First, the number of patients studied is modest. However, given the very similar results seen across patients, it is unlikely that the results would have been different with a larger number of evaluable patients. Second, changes in the shape and volume of soft tissue are not considered. Radiation certainly may cause some shrinkage/fibrosis of surrounding soft tissue which might lessen the attenuation of emitted photons, thereby influencing the reconstruction of profusion scans. Third, the method used for manual segmentation of similar regions of the post- and pre-RT images is not ideal. Ideally, one would have performed a full three-dimensional registration and considered the entire CT scan in the volume and the analysis. However, given the inherent inaccuracies of image registration, particularly for images temporally separated by greater than 6 months, we believe the methods we used are sufficient for the purpose of this study. Therefore, we elected to consider changes in the CT density frequency distribution which, we speculate, to be a fairly sensitive metric for RT-induced changes in soft tissue density. The designated distributions provide distinct peaks corresponding to the prominent soft tissues. Shifts in the locations of these peaks would not be affected by modest changes in the segmented studied volume on the pre- versus post-RT images.
A shortcoming of this study is that a large cohort of patient data acquired with 4D scans was not available. The scans that were analyzed as part of the current analysis were obtained over a multiyear previously funded research grant. Nevertheless, in response to this concern, we did review five of our recent patients seen here at UNC with four-dimensional CT images obtained at full inspiration and full expiration and throughout the respiration cycle. We noted no change in the associated densities nor effective depths in different portions of the respiratory cycle.
This study did not specifically address changes in density within the lung tissue. We elected not to consider the lung tissue itself since we believe that changes in lung tissue density will have a relatively modest effect on overall attenuation. For the heart scans, the volume of lung tissue between the heart and the detector is relatively quite small, and thus one would not expect there to be any significant impact from changes in the lung density. Further, since the density of the lung tissue (even if its density is increased due to scarring) is far less than that of the surrounding soft tissues, the absolute amount of attenuation from lung tissue will be small relative to the soft tissue. For the lung scans, there certainly is more intervening lung between the irradiated volume and the detectors, such that changes in the lung density could conceivably alter the attenuation. Based on our previous studies, we know that lung density increases post-RT.2 Lung density increases by ∼100 HU at doses less than 40 Gy, and increases by about 150–300 HU at doses ranging from 40–70 Gy. A majority of the lung volume receives less than 40 Gy, and therefore will have minimal change in lung density. The changes in lung density seen above 40 Gy might be sufficient to alter the attenuation within the lung. Nevertheless, as the density of lung tissue (even in its fibrotic state) is far smaller than the density of the surrounding soft tissues, the overall impact of changes in lung tissue density on SPECT signal detection is expected to be quite small. Further, the majority of irradiated lung tissue is exposed to a modest dose of radiation, and the volume exposed to high doses is typically small. Therefore, the impact of increased tissue density changes in the lung itself is likely small.
During this study we used CT contouring and analysis software unique to our institution (PLUNC). Our PLUNC has been used clinically for over 20 yr, and has been tested annually against standards from the RPC. We realize that there are commercial softwares readily available that can be used for contouring CT images and analyzing CT data. All structure contours were created manually. Manual contours should vary the least from different contouring software since the contours are user defined. Analysis of the CT data used information readily available in the DICOM CT scan. Since the CT density data is DICOM, the histogram results should be consistent across various commercial and institution specific analysis software.
In summary, this analysis addressed that previously described changes in regional perfusion changes in the heart and lung are indeed largely related to actual perfusion changes within these organs, rather than due to alternations in attenuation of surrounding soft tissue.
CONCLUSIONS
We found that RT doses of 20–50 Gy can cause a 46 HU change in soft tissue density at 6 months post-RT. These changes are far less than the 150 HU change needed to produce a false positive SPECT reduction. Post-RT effective depth of tissues surrounding the lungs can increase by up to 2.2 cm. Further, these changes are not likely responsible for changes in perfusion on post-RT SPECT heart and lung scans. These results served to validate our prior reports do reflect physiological changes in heart and lung.
ACKNOWLEDGMENTS
This work is supported in part by grants from the Department of Defense (17-98-1-8071 and BC010663), the Lance Armstrong Foundation, and the National Institutes of Health (NIH) (R01-CA69579).
References
- Zhang J., Ma J., Zhou S., Hubbs J. L., Wong T. Z., Folz R. J., Evans E. S., Jaszczak R. J., Clough R., and Marks L. B., “Radiation-induced reductions in regional lung perfusion: 0.1-12 year data from a prospective clinical study,” Int. J. Radiat. Oncol., Biol., Phys. 76(2), 425–432 (2010). 10.1016/j.ijrobp.2009.02.005 [DOI] [PubMed] [Google Scholar]
- Ma J., Zhang J., Zhou S., Hubbs J. L., Foltz R. J., Hollis D. R., Light K. L., Wong T. Z., Kelsey C. R., and Marks L. B., “Regional lung density changes after radiation therapy for tumors in and around thorax,” Int. J. Radiat. Oncol., Biol., Phys. 76(1), 116–122 (2010). 10.1016/j.ijrobp.2009.01.025 [DOI] [PubMed] [Google Scholar]
- Fan M., Marks L. B., Lind P., Hollis D., Woel R. T., Bentel G. G., Anscher M. S., Shafman T. D., Coleman R. E., Jaszczak R. J., and Munley M. T., “Relating radiation-induced lung injury to changes in pulmonary function tests,” Int. J. Radiat. Oncol., Biol., Phys. 51(2), 311–317 (2001). 10.1016/S0360-3016(01)01619-4 [DOI] [PubMed] [Google Scholar]
- Marks L. B., Munley M. T., Spencer D. P., Sherouse G. W., Bentel G. C., Hoppenworth J., Chew M., Jaszczak R. J., Coleman R. E., and Prosnitz L. R., “Quantification of radiation-induced regional lung injury with perfusion imaging,” Int. J. Radiat. Oncol., Biol., Phys. 38(2), 399–409 (1997). 10.1016/S0360-3016(97)00013-8 [DOI] [PubMed] [Google Scholar]
- Woel R. T., Munley M. T., Hollis D., Fan M., Bentel G., Anscher M. S., Shafman T., Coleman R. E., Jaszczak R. J., and Marks L. B., “The time course of radiation therapy-induced reductions in regional perfusion: A prospective study with >5 years of follow-up,” Int. J. Radiat. Oncol., Biol., Phys. 52(1), 58–67 (2002). 10.1016/S0360-3016(01)01809-0 [DOI] [PubMed] [Google Scholar]
- Marks L. B., Spencer D. P., Bentel G. C., Ray S. K., Sherouse G. W., Sontag M. R., Coleman R. E., Jaszczak R. J., Turkington T. G., Tapson V., and Prosnitz L. R., “The utility of SPECT lung perfusion scans in minimizing and assessing the physiologic consequences of thoracic irradiation,” Int. J. Radiat. Oncol., Biol., Phys. 26(4), 659–668 (1993). 10.1016/0360-3016(93)90285-4 [DOI] [PubMed] [Google Scholar]
- Li C., Wilson P. B., Levine E., Barber J., Stewart A. L., and Kumar S., “TGF-β1 levels in pre-treatment plasma identify breast cancer patients at risk of developing post-radiotherapy fibrosis,” Int. J. Cancer 84(2), 155–159 (1999). [DOI] [PubMed] [Google Scholar]
- Meric F., Buchholz T. A., Mirza N. Q., Vlastos G., Ames F. C., Ross M. I., Pollock R. E., Singletary S. E., Feig B. W., Kuerer H. M., Newman L. A., Perkins G. H., Strom E. A., McNeese M. D., Hortobagyi G. N., and Hunt K. K., “Long-term complications associated with breast-conservation surgery and radiotherapy,” Ann. Surg. Oncol. 9(6), 543–549 (2002). 10.1007/BF02573889 [DOI] [PubMed] [Google Scholar]
- Krishnamurthy R., Whitman G. J., Stelling C. B., and Kushwaha A. C., “Mammographic findings after breast conservation therapy,” Radiographics 19, S53–S62 (1999). [DOI] [PubMed] [Google Scholar]
- Johansson S., Svensson H., and Denekamp J., “Timescale of evolution of late radiation injury after postoperative radiotherapy of breast cancer patients,” Int. J. Radiat. Oncol., Biol., Phys. 48(3), 745–750 (2000). 10.1016/S0360-3016(00)00674-X [DOI] [PubMed] [Google Scholar]
- Roper J., Manzoor A., Bowsher J., Yin F., Zhou S., Wong T., Borges-Neto S., Hubbs J., Demirci S., and Marks L., “Are post-RT cardiac perfusion defects due to cardiac toxicity, or are they artifacts from attenuation changes in surrounding soft tissues?,” Int. J. Radiat. Oncol. 72(1), S518–S519 (2008). 10.1016/j.ijrobp.2008.06.035 [DOI] [Google Scholar]


