Abstract
Purpose: To evaluate the feasibility of using strain-encoded (SENC) breast magnetic resonance images (MRI) for breast cancer detection by examining the compression and relaxation response properties in phantoms and ex vivo breast samples.
Methods: A tissue phantom was constructed to mimic different sizes of breast masses and tissue stiffness. In addition, five human ex vivo whole breast specimens with and without masses were studied. MR data was acquired on a 3T scanner consisting of T1-weighted, fat suppressed spin echo T2-weighted, and SENC breast images. Mechanical tissue characteristics (strain) of the phantoms and breast tissue samples were measured using SENC imaging in both compression and relaxation modes. The breast tissue specimens were sectioned and stained in the same plane as the MRI for histological evaluation.
Results: For the phantom, SENC images showed soft masses with quantitative strain values between 35% and 50%, while harder masses had strain values between 0% and 20%. Combined compression (CMP) and relaxation (REX) breast SENC images separately categorized all masses into three different groups. For breast SENC, the signal intensities between ex vivo breast mass and breast glandular tissue were significantly different (−7.6 ± 2.6 verses −20.6 ± 5.4 for SENC-CMP, and 4.2 ± 1.5 verses 22.6 ± 5 for SENC-REX, p < 0.05).
Conclusions: We have demonstrated that SENC breast MRI can be used to obtain mechanical tissue properties and give quantitative estimates of strain in tumors. This feasibility study provides the basis for future clinical studies.
Keywords: breast MRI, SENC, elastography, strain, cancer, diffusion
INTRODUCTION
Breast cancer is one of the most common causes of cancer related mortality in women and early detection of breast lesions is the key for decreasing mortality-rates.1 Radiological imaging is the cornerstone for early detection of lesions using mammography and ultrasound (US). Mammography is sensitive for the detection of large masses, microcalcifications in precancerous and early stage breast lesions, for example, ductal carcinoma in situ (DCIS). Indeterminate lesions may be biopsied or further investigated with US; however, some breast lesions are mammography and US occult (e.g., in dense breasts) and the use of magnetic resonance imaging (MRI) is recommended.
There is increased use of MRI as an adjunct imaging method for breast tumor diagnosis.2 MRI with dynamic contrast enhanced (DCE) imaging has excellent sensitivity for lesion detection (greater than 90%), but only moderate specificity (80%–85%).3, 4, 5 Magnetic resonance imaging evaluation of the breast is used for interrogation of the contralateral breast in women with recently diagnosed breast cancer for potential breast lesions.4 Given the high cost of MRI, efforts to improve the specificity of the technique are warranted. One such method that may offer increased specificity is strain-encoded (SENC) breast MRI. SENC MRI has the potential to interrogate the mechanical properties of breast tissue, such as strain, as a component of the breast MRI examination.
Malignant breast tumors have different mechanical properties than both normal and benign breast tissue.6, 7, 8, 9, 10, 11 Using ultrasound, Krouskop et al.7 showed that the Young's modulus was highly variable and depended on the amount of compression. For example, the Young's modulus (a measure of stiffness) of invasive carcinoma was 5–25 times greater than that of normal breast. In addition, Samani et al.11 examined the Young's modulus in 169 fresh ex vivo samples and found that normal breast tissue (fatty and glandular) exhibited a low Young's modulus. A twofold increase in Young's modulus was noted for benign breast lesions with greater increases (three to 14-fold) in malignant tumors. These results were confirmed in other studies using MR elastography (MRE).8, 9, 12
The mechanical properties of breast tissue can be assessed using both MRE and SENC.8, 12, 13, 14, 15, 16, 17, 18 Various groups have demonstrated that MRE is able to detect tumor masses. However, a simpler and more efficient method may be SENC MRI.19 Breast SENC MRI detects stiff masses by directly measuring strain difference between the tumor and the background. Unlike, traditional MRE, SENC relies on a simple and fast center of mass calculation to measure the strain, which is approximately inversely proportional to stiffness.16
The feasibility of breast SENC to detect stiff masses in a homogeneous phantom was shown using a single compression that limited the scan time to one second and the scanning resolution to 4 × 4 × 10 mm3.16, 18 The method was improved with new hardware capable of accurately repeating compressions that enabled the increase in scanning time, thus, achieving a higher resolution (1 × 1 × 5 mm3) and significantly improving the signal-to-noise ratio (SNR) and the contrast-to-noise ratio (CNR).19
The purpose of this work is to examine the performance of breast SENC MRI in both phantoms and ex vivo human breast tissue. We also introduce a variant of SENC imaging called SENC relaxation (SENC-REX) to complement traditional SENC compression (SENC-CMP).
METHODS AND MATERIALS
SENC MRI
The SENC sequence is a method for directly measuring strain, where strain is defined as the percentage change in length of tissue.19 In SENC, a 1-1 spatial modulation of magnetization (SPAMM) tagging pulses is applied to create a sinusoidal pattern in the slice selection direction. After compression, the tissue deforms causing the tagging frequency ω0 to shift relative to the tissue's compression. This shift can be estimated by acquiring two images, a low tune image (IL) and high tune image (IH) at two different z-encoding frequencies ωL and ωH.
Hardware
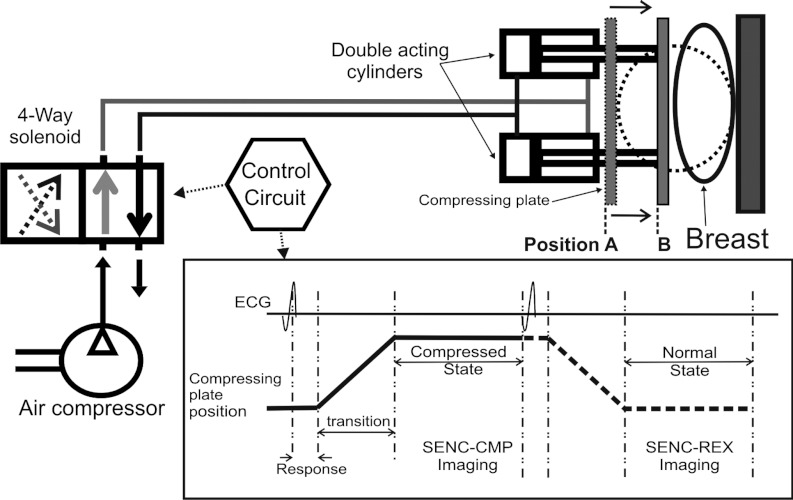
The hardware consists of two air-cylinders fitted to standard MR breast coils [see Fig. 1a] and is fully described in Ref. 19. Simple controls produce accurate and repeatable compressions. The compression hardware can accommodate for different breast sizes (53 mm up to 120 mm in diameter) as well as different compression levels in order to accommodate for a patients comfort as shown in Fig. 1. The compression hardware can operate in three different modes (off, compress and hold, and compression) with addition of the fourth mode described below. In order to examine the tissue's relaxations properties as well as compression properties, we modified the hardware to operate in a fourth mode that we call relaxation. The differences between compression and relaxation modes along with scanning parameters are described in Secs. 2C, 2D.
Figure 1.
Schematic block diagram for the hardware consisting of two double acting cylinders that fit under the breast coil. The control circuit controls the air flow through the 4-way solenoid to produce the pistons’ cyclic motion and generate an ECG signal synchronizing with the scanner. Position A shows the compressing plate before motion and position B shows the final position when the breast is compressed.
CMP and REX modes for strain imaging
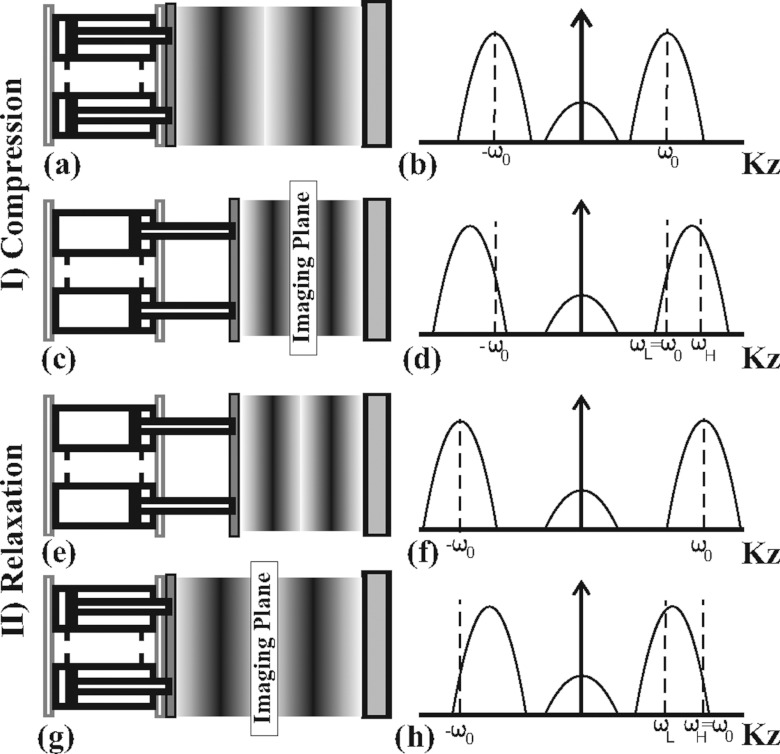
To acquire SENC breast images, the hardware can be operated in either compression or relaxation modes. In the compression mode, we apply tagging pulses prior to compression [see Figs. 2a, 2b], followed by compression and image acquisition (while the tissue is fully compressed), yielding SENC-CMP images [see Figs. 2c, 2d]. In the relaxation mode, we apply the tagging pulses while the tissue is fully compressed [see Figs. 2e, 2f], then followed by relaxation and image acquisition [while tissue is relaxing (returning) back in its normal position] yielding in SENC-REX images [see Figs. 2g, 2h]. The formulas for determining SENC scanning parameters are given for the expected range of strain values between ɛmax stretch and ɛmax compression.16, 20 For example, the SENC-CMP images, ɛmax stretch is set to zero, and the SENC equations are simplified to
| (1) |
where B is the reciprocal of the slice thickness and ω0, ωL, and ωH are the tagging, low, and high frequency, respectively.
Figure 2.
Demonstration of the tissue status with the tag lines changing for compression [(a)–(d)] and relaxation modes [(e)–(h)] with the corresponding harmonic peak shift (right). (a) The tissue in normal position with initial tagging frequency. (b) Peak sinc pulse profile centered at tagging frequency. (c) Demonstration of the pistons compressing the tissue causing tagging frequency to increase. (d) As a result, harmonic peaks shift to higher frequency. (e) Example of the tissue in compressed state with initial tag lines. (f) Peak sinc pulse profile centered at tagging frequency. (g) Example of the tissue relaxing to normal position causing the tagging frequency to decrease. (h) Harmonic peaks shift to lower frequency.
Similarly, for the acquisition of SENC-REX images, ɛmax compression is set to zero, where the SENC equations can be simplified to
| (2) |
We use ɛCMP and ɛREX to denote compression and relaxation strain, respectively. Note that ɛCMP is calculated with respect to the initial phantom length, while ɛREX is calculated with respect to the compressed state by
| (3) |
where L0 and LCMP are the initial length and the compressed length of the tissue, respectively. Therefore, ɛCMP values are always negative, while ɛREX values are always positive. In general, tumors maybe stiffer than the background and their strain values will be close to zero in both SENC-CMP and SENC-REX images. To visually compare SENC-CMP and SENC-REX images, we unified all color pallets such that masses that have low strain values were assigned dark gray (or red color as in Fig. 9) while normal background was assigned lighter color (or blue as shown in Fig. 9). Note that for the same degree of compression, SENC-REX images have larger dynamic range than SENC-CMP images. For example, assuming a phantom with initial length of 100 mm and it is compressed to 70 mm. During SENC-CMP, the strain will be εCMP = (70 − 100)/100 = −30%. However, during SENC-REX, the same phantom relaxes from 70 to 100 mm, resulting in a strain of εREX = (100 − 70)/70 = +43%.
Figure 9.
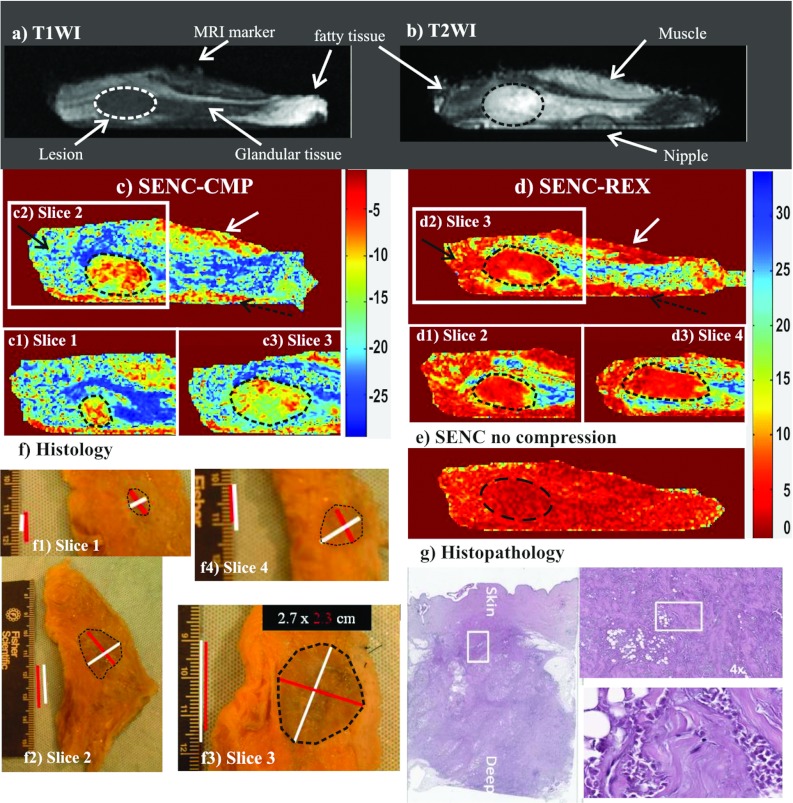
Demonstration of breast SENC MRI method on an ex vivo breast sample with a mass determined to invasive ductal carcinoma (unknown before imaging). Representative SENC breast images of (a) T1-weighted image, (b) T2-weighted image with fat suppression, (c) breast SENC-CMP image of the breast tissue, (d) SENC-REX image of the breast tissue, and (e) breast SENC MRI image with no compression shows homogeneous strain throughout the breast. Indicating no residual strain within the breast tissue without any compression applied. Dotted ROI shows the breast lesion in all image locations. (c1)–(c3) and (d1)–(d3) Breast SENC-CMP and SENC-REX images show different slices containing the tumor. White arrows point to muscle, while black and dotted black arrows point to image artifacts. (f) and (g) Histological results clearly demonstrate the breast lesion is invasive ductal carcinoma. The histological images show the gross pathology and the microphotograph of the H&E stained section.
SENC pulse sequence and flip angle optimization
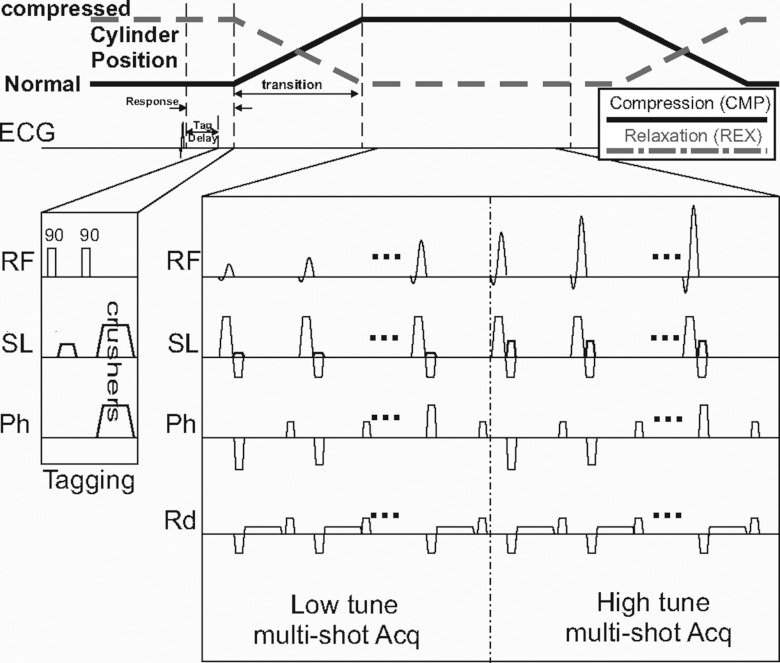
A typical SENC breast MRI pulse sequence is shown in Fig. 3 for compression and relaxation modes. After the R-wave, we introduce a tagging delay to compensate for the response time of the air-cylinder. Multishot acquisition was used to acquire the low and high tune images and repeated when acquiring segmented K-space. To compensate for tag fading due to T1 relaxation, ramped flip angles are used. Based on previous simulations,19, 21 we determined that the maximum signal intensity would be obtained using a last flip angle of 70°–80°
Figure 3.
SENC breast MRI pulse sequence for compression (CMP) and relaxation (REX) acquisitions. A short tagging delay is introduced ∼100 ms after the R-wave. Followed by a typical tagging sequence that consists of two 90° hard pulses with a tagging gradient in the slice direction. Note that tagging occurs while the cylinders are at the position A/position B (normal/compressed state) for breast SENC-CMP/SENC-REX modes (as shown by black solid/dotted lines). Acquisition starts after the cylinders are at their final position. Multishot acquisition for the low and high tune images and ramped flip angles are used to compensate for the T1 decay.
PHANTOMS AND EX VIVO TISSUE
Phantoms
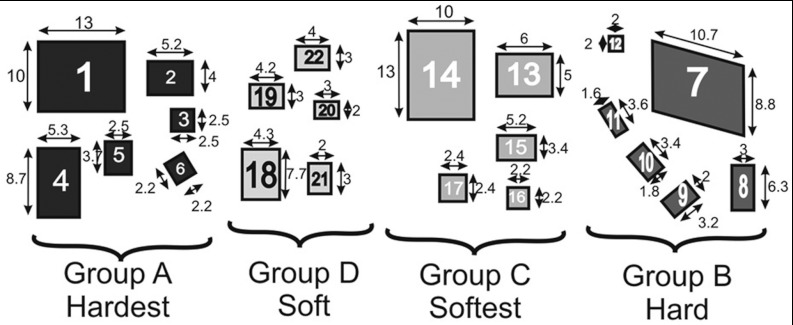
Phantoms were modeled after the MQSA mammographic phantoms and constructed to test the ability of our device and SENC sequences to distinguish different types of stiffness and determine spatial resolution of the method. The phantom components were made of different water to gelatin ratios to generate different stiffness. Specifically, the phantom background had medium stiffness with T1 relaxation of 600–700 ms. Four different ratios of water to gelatin were used to create four different materials that would replicate masses. The masses were divided into two categories: groups A and B were stiffer than the background, while groups C and D were softer than the background. The masses were constructed with various sizes ranging from 2 to 10 mm and all were 8 mm thick. Figure 4 shows the masses labeled 1–22 of different groups along with the dimensions of each mass.
Figure 4.
Layout for the custom-made phantom containing four groups of masses having different stiffnesses. Groups A and B are harder than the background, while groups C and D are softer than the background. Masses are labeled 1–22 for reference in Sec. 5.
Ex vivo breast tissue
Ex vivo breast samples from patients who underwent mastectomy or breast reduction mammoplasty were used for the SENC breast MRI. Five breast samples were imaged using the SENC and conventional breast MRI sequences described below. The ex vivo breast samples were kept fresh in a −20 °C freezer and allowed to thaw approximately 2 h before scanning. Colocalization between the MRI image planes and breast samples was accomplished by placing two sutures at the lateral and medial edges of the breast sample and one in the anterior section of the specimen. The nipple and retroareolar regions were used as landmarks. After MRI scanning, the samples were fixed with formalin and underwent subsequent histopathological analysis. The breast samples were sectioned in the same plane as the MRI and processed and embedded in paraffin. Six μm thick paraffin sections from each block were cut and stained with hematoxylin and eosin (H & E) and E-cadherin for tissue evaluation.
EXPERIMENTS
Scanning protocol
The MRI scans were acquired in a 3T MRI Philips scanner (Achieva, Philips Medical Systems, Best, the Netherlands) using a four-channel phased array breast coil. MRI sequences included: T1-weighted (T1W) imaging [TR = 495/TE = 10 ms, field-of-view (FOV) = 192 × 192 mm2, slice thickness (ST) = 5 mm, sense factor = 2], T2-weighted (T2W) fat suppressed spin echo (SE) scans (TR = 2500/TE = 60 ms, FOV = 192 × 192 mm2, ST = 5 mm, sense factor = 2). MRI parameters for both SENC-CMP and SENC-REX breast scans were: FOV = 192 × 192 mm2, in-plane resolution of 1 × 1 mm2, ST = 5 mm, last flip angle = 80°, tagging delay = 100 ms, trigger delay = 500 ms, segmented Cartesian K-space acquisition using turbo fast echo (TFE) factor of 10 mm, which allows for the completion of the scan in 19 compression cycles. During SENC-CMP, we targeted a strain range of zero stretching to −36% compression for the breast tissue leading to ω0 = ωL = 0.354 mm−1 and ωH = 0.5531 mm−1. As for SENC-REX, we used ω0 = ωH = 0.6 mm−1 and ωL = 0.4 mm−1, which enabled us to measure breast tissue relaxation from 0% to 50%.
For control images, two extra SENC scans were performed: one without compression with the breast tissue in the normal position, and the other control image with constant compression using the hardware's “compress and hold” mode. These control scans allow for evaluation of the tissue contrast within the SENC images and confirm that the tissue contrast is only due to the compression of the tissue and identify any artifacts.
Quantification of the SENC imaging characteristics
To measure the image quality of the SENC breast imaging, we calculated the SNR and elastography CNRe. The SNR was measured by the following equation:
| (4) |
where S is the mean signal intensity in the phantom background and σ is the standard deviation of the noise calculated from a 30 × 30 pixel rectangular area outside the phantom.
Phantom segmentation
Manual segmentation was performed on all images using a priori knowledge of the lesion location from the phantom. Since masses were cuboids, the ROI's were drawn to be as close as possible to rectangles (or parallelograms) and in a manner to reduce partial volume effects for the SENC-CMP and SENC-REX. The strain (mean ± standard deviation) and CNRe were measured for each mass.22 The background was measured in a similar manner. We measured the area of group A defined by the breast SENC-CMP, SENC-REX, and the T1-weighted image to discern the spatial resolution of the breast SENC.
Ex vivo segmentation
The ex vivo breasts were placed into the breast SENC device and breast coil were the nipple was facing the bottom surface. A suture was place on the lateral margin and a MRI marker on the posterior surface of the specimen. The segmentation was performed blindly on the MRI and breast SENC images. Anatomical structures were identified using current diagnostic breast imaging, where the T1-weighted imaging was used for parenchymal breast tissue and fat sat T2 was used for glandular tissue. If a lesion was present and visible, it was measured on the anatomical breast MRI images. For SENC-CMP and SENC-REX images, stiff regions were identified as areas with low strain relative to the surrounding background. Low strain areas that appear on one SENC image and not the other were considered as artifacts and judged with other standard MRI.
RESULTS
Phantom results
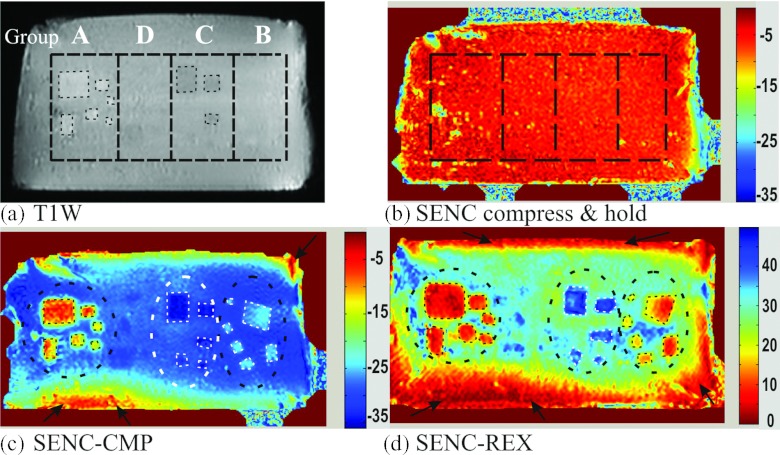
Figure 5a demonstrates a representative T1W image for the phantom, where the background and the masses had nearly the same T1 relaxation, masses with least (group A) and most (group C) water concentration could be delineated, while masses of groups B and D were not visible. Figure 5b shows a SENC image while the phantom is in a compress and hold position; in that position, no masses are detected. Figures 5c, 5d clearly demonstrate the power of SENC-CMP and SENC-REX images to identify masses of different sizes by stiffness differences. Note the color bar of SENC-CMP image ranges from of 0% to −35% indicating compression, while for SENC-REX image, the color bar ranges from 0% to +45% indicating stretching. Manually segmented ROIs of groups A, B, and C are shown. While, masses of group D could not be visualized (due to lack of contrast). Black ellipses were used for background calculations and black arrows point to artifacts from imperfect compression due to friction between the phantom and the supporting plate.
Figure 5.
The phantom imaged with conventional and breast SENC MRI sequences. (a) T1 weighted image: Black dotted lines separates groups A–D. Note groups B and D are not well appreciated. (b) SENC breast image acquired with the hardware set to the “compress and hold” mode, keeping the phantom compressed in a static position. (c) and (d) SENC-CMP and SENC-REX breast strain images.
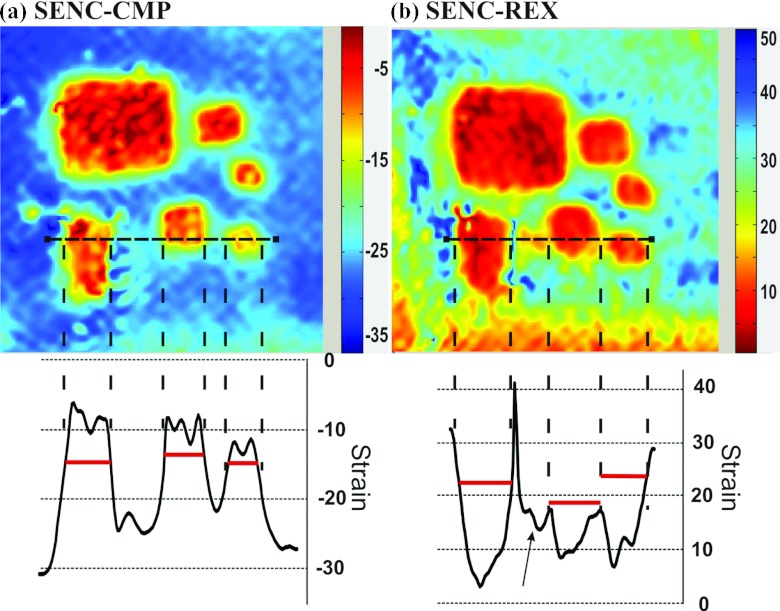
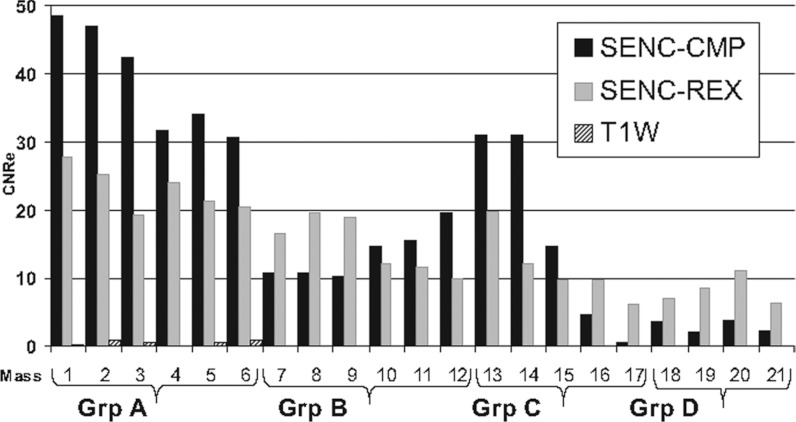
The mean SNR for T1W, SENC-CMP, and SENC-REX was 300, 70, and 53, respectively. The strain measurements (mean ± standard deviation) for groups A, B, C, D, and the background from the SENC-CMP and SENC-REX images are shown in Table 1. Figure 6 shows a magnified view of the masses in group A for both SENC-CMP and SENC-REX images. The area measurements of group A masses 1–6 (labeled in Fig. 4) estimated from the segmentation of the T1W, SENC-CMP, and SENC-REX images are shown in Table 2. The bar graph of the CNRe for the masses in groups A, B, C, and D obtained from the T1W, SENC-CMP, and SENC-REX images is shown in Fig. 7. Note that the CNRe for T1W image is almost zero for all masses, which was expected.
Table 1.
Strain (mean ± standard deviation) for masses in groups A, B, C, and D, and background measured from the SENC-CMP and SENC-REX images.
| Group A | Group B | Group C | Group D | Background | |
|---|---|---|---|---|---|
| Hardest | Hard | Softest | Soft | Intermediate | |
| SENC-CMP | −10.1 ± 3.4 | −25.5 ± 1.3 | −33.7 ± 1.7 | −28.3 ± 0.8 | −28.5 ± 2.2 |
| SENC-REX | 8.6 ± 3.7 | 13.7 ± 4.1 | 40.5 ± 3.7 | 36.3 ± 2.5 | 30.5 ± 3.9 |
Note: SENC-CMP = SENC compression, and SENC-REX = SENC relaxation.
Figure 6.
Magnified images of masses in group A from the phantom demonstrating the excellent spatial resolution of the breast SENC method. (a) SENC-CMP image and (b) SENC-REX image. Strain profile is displayed for the horizontal dotted black line going through three masses for both SENC-CMP and SENC-REX image. Horizontal lines helps determines the masses’ position. Black arrows point to image artifacts that appear on SENC-REX strain profile.
Table 2.
Area measurements for the different masses 1–6 in group A.
| Area in mm2 of masses of group A | ||||||
|---|---|---|---|---|---|---|
| Mass number |
1 |
2 |
3 |
4 |
5 |
6 |
| T1WI | 166 | 24 | 9 | 54 | 24 | 7 |
| SENC-CMP | 195 | 31 | 14 | 57 | 28 | 12 |
| SENC-REX | 238 | 53 | 24 | 65 | 52 | 23 |
Note: T1WI = T1-weighted image, SENC-CMP = SENC compression, and SENC-REX = SENC relaxation.
Figure 7.
Bar graph of the contrast to noise (CNRe) measurements of the phantom masses from the SENC-CMP, SENC-REX, and T1-weighted images(T1WI). Masses 1-6, 7-12, 13-17, and 18-21 are groups A, B, C, and D, respectively.
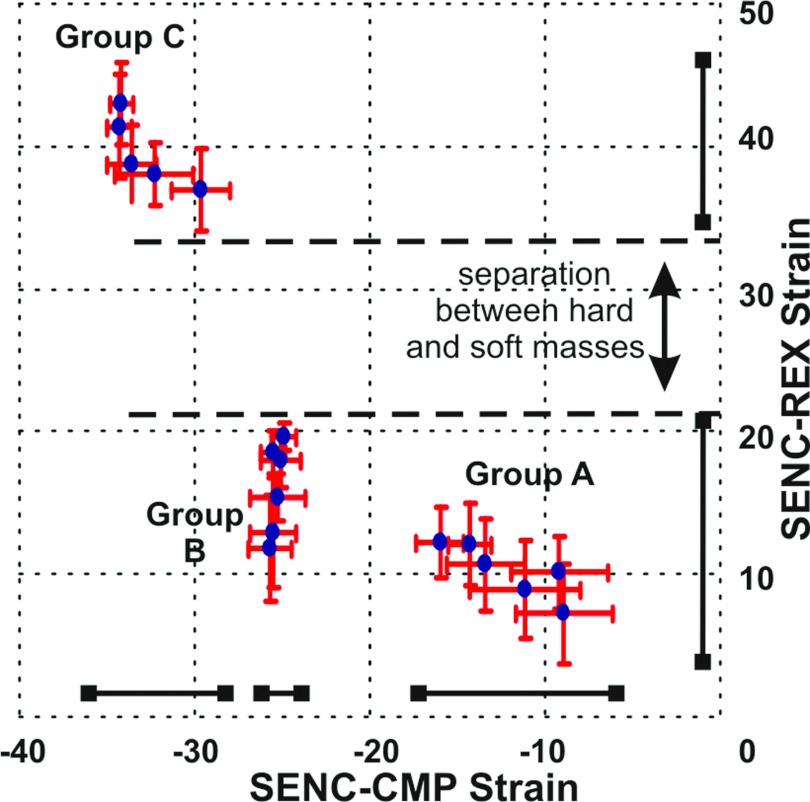
Figure 8 shows the strain (mean ± standard deviation) for each of the masses with the SENC-CMP and SENC-REX strain values plotted on the X- and Y-axes, respectively. There is clear delineation of the different strain value masses of groups A, B, and C into three separate groups. The Y-axis of Fig. 8 indicates that the soft masses had quantitative strain values between 35% and 50%, while harder masses had strain values between 0% and 20%. These data indicate that SENC-REX image yields a large separation between soft and hard masses; however, the SENC-REX images appear to lack the sensitivity to clearly separate the hard masses of groups A and B. On the other hand, the X-axis of Fig. 8 indicates that SENC-CMP images separated the masses into three distinct groups.
Figure 8.
Cluster plot of the strain (mean ± standard deviation) for each mass measured from the SENC breast MRI. The X-axis is the compression strain, while the Y-axis is the relaxation strain. The masses are clearly clustered into three groups according to their stiffness. SENC-CMP could separate masses into three groups, while SENC-REX separates hard masses from soft ones with large separation.
Ex Vivo breast tissue results
A representative ex vivo breast sample with invasive ductal carcinoma (1.5 × 2 cm2) imaged with the MRI sequences of (a) T1W, (b) T2W with fat suppression, (c) SENC-CMP image, (d) SENC-REX image, and (e) SENC with no compression is shown in Fig. 9. The T1W and T2W images were used for anatomical information and were able to distinguish the breast mass by architectural deformation of glandular and fatty tissue [see white arrows in Figs. 9a, 9b]. SENC with no compression [Fig. 9e] shows a uniform homogeneous strain. On both SENC-CMP [Fig. 9c] and SENC-rex [Fig. 9d] images, the mass was stiffer (red color marked with black ROI) than glandular tissue (blue color). The mass was manually segmented on four SENC-CMP slices (areas: 105, 332, 482, and 148 mm2) and five SENC-REX slices (areas: 65, 273, 360, 337, and 145 mm2). SENC-CMP slices 1–3 are shown in Fig. 9(c1)–(c3), while SENC-REX slices 2–4 are shown in Fig. 9(d1)–(d3). Estimated mass size estimated using SENC-CMP and SENC-REX images was 5.3 cm3 and 5.9 cm3, respectively. Moreover, white arrow point to muscle the mixed red and yellow color in Figs. 9c, 9d that appears stiffer than breast tissue. The bottom part of the tissue (pointed to by dotted black arrow) is in contact with the supporting plate. The friction effect appears more extensive than on SENC-REX as expected because the tissue is passively relaxing. The resulting histological section shown in (f) stained with H&E and E-cadherin confirms the presence of invasive ductal carcinoma. The mass was confirmed on four slices of the pathology as shown in Fig. 9f (areas: 77, 440, 457, and 114 mm2; slice thickness was 5 mm). Maximum and minimum diameters estimated on center slice were 2.7 and 2.3 cm as shown in Fig. 9f along with the mass ROI in black. Mass size was estimated to be 5.44 cm3. We were blinded to the existence of any masses in the breast samples until the MRI scan was completed. Table 3 summarizes the signal intensities (mean ± standard deviation), and strain (mean ± standard deviation) measurements from the ex vivo breast sample the center slice containing the tumor.
Table 3.
Signal intensity (mean ± standard deviation) and strain (mean ± standard deviation) results for the ex vivo breast sample with a malignant tumor.
| Malignant tumor | Glandular tissue | Muscle | Fatty tissue | |
|---|---|---|---|---|
| T1WI | 514 ± 30 | 502 ± 40 | 524 ± 75 | 867 ± 65 |
| T2WI | 607 ± 43 | 470 ± 49 | 428 ± 37 | 176 ± 43 |
| SENC Compress and hold | −7.4 ± 3.1 | −8.15 ± 3.5 | −7.9 ± 3.6 | −15.6 ± 5.8 |
| SENC-CMP | −7.6 ± 2.6 | −20.6 ± 5.4 | −8.46 ± 3.3 | −23.4 ± 3.9 |
| SENC No compression | 2.16 ± 0.8 | 2.3 ± 1.1 | 2.42 ± 1.4 | 5.1 ± 2.4 |
| SENC-REX | 4.2 ± 1.5 | 22.6 ± 5 | 3.47 ± 2.4 | 7.3 ± 4.4 |
Note: T1WI = T1-weighted image, T2WI = T2-weighted image, SENC-CMP = SENC compression, and SENC-REX = SENC relaxation.
Quantitative analysis demonstrated that the breast mass and glandular tissue had similar intensities (514 ± 30 and 502 ± 40, respectively) on the T1W, while the T2W showed a difference between the breast mass and glandular tissue (607 ± 43 verses 470 ± 49; Table 3). For SENC, the signal intensities between the breast mass and glandular tissue were significantly different (−7.6 ± 2.6 verses −20.6±5.4 for SENC-CMP, and 4.2 ± 1.5 verses 22.6 ± 5 for SENC-REX, p < 0.05).
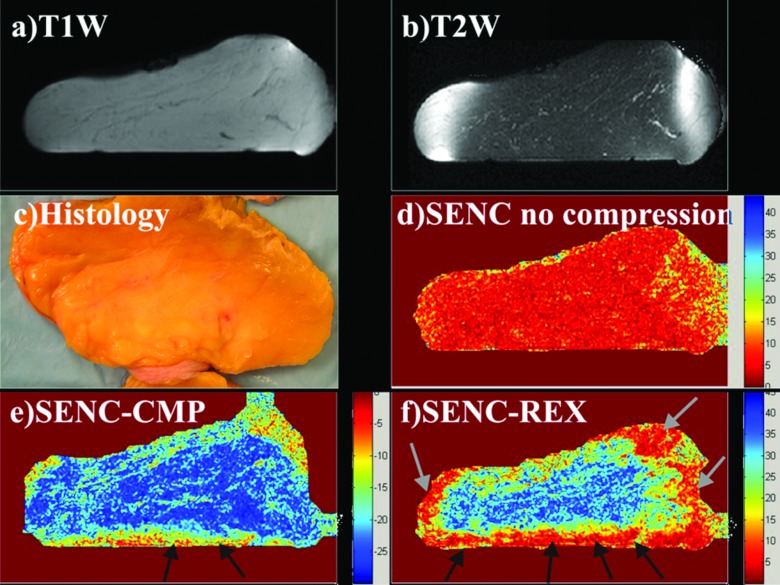
The other four breast tissue samples had no tumors. Figure 10 shows one of the four ex vivo breast specimens without a tumor. No mass was found in either the SENC-CMP or SENC-REX images [Figs. 10e, 10f]. After imaging, the tissue was processed and gross histopathological examination confirmed that there are no breast lesions [Fig. 10c].
Figure 10.
Demonstration of the breast SENC results in an ex vivo breast sample with no mass (not known before imaging). Representative SENC breast images of Ia) T1- weighted image, (b) T2-weighted image with fat suppression, and (c) gross histological examination of the breast revealed no masses. Further staining was not performed. (d) Breast SENC image with no compression resulted in homogeneous strain throughout the breast. Representative breast SENC images (e) SENC-CMP image, and (f) SENC-REX image. Black arrows point to tissue stuck to the plate under the breasts own weight, while gray arrows point image artifacts.
DISCUSSION
We have demonstrated that both SENC-CMP and SENC-REX strain images can distinguish “hard” masses from “softer” masses and background in phantoms. Confirmatory evidence to the phantom data was shown in the ex vivo experiments. Indeed, in the breast samples, obtained without prior knowledge of the existence of breast lesions, we were able to delineate tumors in the samples with masses from the surrounding tissue and those samples without masses. Moreover, in ex vivo breast tissue samples, the SENC strain breast images were able to separate the major tissue groups of fatty, muscle, and glandular tissue, in addition to breast lesions. While phantom data showed the potential for this technique and the ex vivo breast specimens with histological validation confirmed these results, taken together, it suggests the potential clinical usefulness of SENC breast imaging may be useful for detecting and characterizing breast masses as benign or malignant in humans.
Our phantom results are similar to that shown by Fahmy et al., where they detected stiffer masses from the background using strain measurements from SENC MRI. However, we used improved hardware that achieved higher spatial resolution and introduced the SENC-REX method.
Phantom results showed that both SENC-CMP and SENC-REX overestimated the masses cross-sectional area. However, since the tissue is more compressed in SENC-CMP than SENC-REX images the masses sometimes appear in fewer numbers of slices; thus, mass volume was larger on SENC-REX (5.9 cm3) than SENC-CMP (5.3 cm3), however, the volume was consistent with the histological estimate of volume. Previous work shows that SENC contrast depends on the following: difference in stiffness between mass and the background; amount of compression applied; mass size; and separation between masses. Our phantom results agree with this as smaller masses had lower contrast (CNRe) than larger masses – for each group with similar stiffness. Large mass labeled 1, 2 (within group A), 13, and 14 (within group c) have higher contrast than smaller masses labeled 5, 6 (within group A), 15, 16, and 17 (within group C). Also, SENC-CMP had higher CNRe than SENC-REX for almost all masses (12 out of 17 masses).
The ex vivo SENC breast image tissue contrast is similar to that shown by McKnight et al.,9 but with some differences, specifically, the SENC breast images exhibited increased spatial resolution and better delineation of the tumor with the ability to gauge morphology. In addition, SENC breast MRI images demonstrated better contrast between the tumor and the surrounding tissue. However, they reported absolute stiffness in KPa of the tumor using a compression device to introduce phase changes, which the phase changes were imaged using phase based MRE technique. Whereas, we measured strain differences between the different tissue types, but the results between the MRI methods are consistent. The compression and relaxation SENC breast method we developed is not strictly a MRE technique, but rather a quantitative alternative to manual palpation methods used during clinical breast examination by the clinician.
In phantom experiments, SENC-CMP images managed to separate masses into three different groups with no overlap in strain range. While SENC-REX images separated the masses into two groups: harder and softer than the background. However, SENC-REX had a larger strain range separation between the hard and soft masses than SENC-CMP as shown in Fig. 8. All masses of group A were detected with high confidence using either SENC-CMP (average CNRe = 39) or SENC-REX (average CNRe = 23). Large masses (≥6 mm2) of group C labeled 13 and 14 were detected with high confidence using SENC-CMP (average CNRe = 31) and SENC-REX (average CNRe = 16). While large masses (≥6 mm2) of group B labeled 7, 8, and 9 were detected with high confidence using SENC-REX (average CNRe = 18.4) and low confidence using SENC-CMP (average CNRe = 10.5). However, smaller masses (≤6 mm2) of groups B and C could not have been detected without prior knowledge of their existence. Our data suggest that we may be able to detect small tumors (larger than 6 mm2) that are stiffer than the surrounding tissue. However, further studies are needed to discern the exact spatial resolution of breast SENC MRI.
SENC breast MRI features could potentially be utilized to provide an additional radiological measure in conjunction with standard imaging metrics of breast disease, such as morphology or architectural structure, to further increase specificity. Future optimization could reduce the scan time by half by performing SENC-CMP and SENC-REX acquisition in the same cycle and be extended to bilateral acquisition of breast SENC using localized tagging pulses to tag each breast separately.
This study has several limitations. Breast SENC MRI is only capable of measuring strain and not stiffness—as in traditional MRE methods. Moreover, breast SENC only estimates the through plane strain by detecting the changes in tagging frequency. While, true strain is a tensor with six components. Assuming that our phantom is incompressible, after compression the phantom moves upwards while being compressed, resulting in the phantom's shape. The phantom shape changes from being a cuboid with straight edges to a cuboid with rounded edges. This 3D deformation is maximum at the edges while at the center of the phantom the deformation is mainly unidirectional in the direction of the compression with a linear translation away from the fixed plate. Therefore, breast SENC strain estimation would be more accurate compared to ground truth at the center of the phantom with larger errors of strain estimates at the rims leading to the rim artifacts at the boarders. These artifacts appear more severe on SENC-REX than SENC-CMP as shown in Figs. 510. This might be happening during SENC-CMP, where the tissue is compressed under the pistons force to deform into the final shape, however, during SENC-REX the tissue deforms under its own internal forces. This leads to a slower and different deformation that affects the tag lines used for strain estimation. Finally, the small sample size of the ex vivo data is a limitation; however, the results do clearly demonstrate the feasibility of SENC breast MRI to detect breast lesions with excellent spatial resolution. Finally, the lack of in vivo breast data is a limitation; however, the results do provide compelling evidence for subsequent patient studies and they are currently underway.
CONCLUSION
In conclusion, we have demonstrated that breast SENC MRI can measure strain, which is approximately inversely proportional to stiffness and was able to detect breast lesions that were stiffer than surrounding tissue. We showed that by combining the compression and relaxation properties of the tissue, SENC breast MRI was able to detect and differentiate phantom masses according to stiffness with high spatial resolution. Moreover, unlike traditional MRE methods that only show stiffer tumors, our phantom results show that SENC is sensitive enough to differentiate between tumors that are both stiffer and softer than the background. Last, the integration of the SENC breast method with conventional breast MRI is straightforward and may provide a method to increase specificity in diagnosis and monitor treatment response with other advanced MRI methods.23, 24
ACKNOWLEDGMENT
We thank the reviewers for their comments and Mary McAllister, MA for her assistance. This work was supported in part by the intramural NIH research program and NIH grants 1R44CA162870, P50CA103175, 5P30CA06973, Breast SPORE P50CA88843, U01CA070095, and U01CA140204.
References
- Jemal A., Siegel R., Xu J., and Ward E., “Cancer statistics, 2010,” Ca-Cancer J. Clin. 60, 277–300 (2010). 10.3322/caac.20073 [DOI] [PubMed] [Google Scholar]
- El Khouli R. H., Jacobs M. A., and Bluemke D. A., “Magnetic resonance imaging of the breast,” Semin Roentgenol. 43, 265–281 (2008). 10.1053/j.ro.2008.07.002 [DOI] [PubMed] [Google Scholar]
- Bluemke D. A., Gatsonis C. A., Chen M. H., DeAngelis G. A., DeBruhl N., Harms S., Heywang-Kobrunner S. H., Hylton N., Kuhl C. K., Lehman C., Pisano E. D., Causer P., Schnitt S. J., Smazal S. F., Stelling C. B., Weatherall P. T., and Schnall M. D., “Magnetic resonance imaging of the breast prior to biopsy,” J. Am. Med. Assoc. 292, 2735–2742 (2004). 10.1001/jama.292.22.2735 [DOI] [PubMed] [Google Scholar]
- Lehman C. D., Gatsonis C., Kuhl C. K., Hendrick R. E., Pisano E. D., Hanna L., Peacock S., Smazal S. F., Maki D. D., Julian T. B., DePeri E. R., Bluemke D. A., and Schnall M. D., “MRI evaluation of the contralateral breast in women with recently diagnosed breast cancer,” N. Engl. J. Med. 356, 1295–1303 (2007). 10.1056/NEJMoa065447 [DOI] [PubMed] [Google Scholar]
- Ei Khouli R. H., Macura K. J., Kamel I. R., Jacobs M. A., and Bluemke D. A., “3-T dynamic contrast-enhanced MRI of the breast: Pharmacokinetic parameters versus conventional kinetic curve analysis,” Am. J. Roentgenol. 197, 1498–1505 (2011). 10.2214/AJR.10.4665 [DOI] [PMC free article] [PubMed] [Google Scholar]
- Garra B. S., Cespedes E. I., Ophir J., Spratt S. R., Zuurbier R. A., Magnant C. M., and Pennanen M. F., “Elastography of breast lesions: Initial clinical results,” Radiology 202, 79–86 (1997). [DOI] [PubMed] [Google Scholar]
- Krouskop T. A., Wheeler T. M., Kallel F., Garra B. S., and Hall T., “Elastic moduli of breast and prostate tissues under compression,” Ultrason. Imaging 20, 260–274 (1998). [DOI] [PubMed] [Google Scholar]
- Plewes D. B., Bishop J., Samani A., and Sciarretta J., “Visualization and quantification of breast cancer biomechanical properties with magnetic resonance elastography,” Phys. Med. Biol. 45, 1591–1610 (2000). 10.1088/0031-9155/45/6/314 [DOI] [PubMed] [Google Scholar]
- McKnight A. L., Kugel J. L., Rossman P. J., Manduca A., Hartmann L. C., and Ehman R. L., “MR elastography of breast cancer: Preliminary results,” AJR, Am. J. Roentgenol. 178, 1411–1417 (2002). [DOI] [PubMed] [Google Scholar]
- Sinkus R., Tanter M., Catheline S., Lorenzen J., Kuhl C., Sondermann E., and Fink M., “Imaging anisotropic and viscous properties of breast tissue by magnetic resonance-elastography,” Magn. Reson. Med. 53, 372–387 (2005). 10.1002/mrm.20355 [DOI] [PubMed] [Google Scholar]
- Samani A., Zubovits J., and Plewes D., “Elastic moduli of normal and pathological human breast tissues: an inversion-technique-based investigation of 169 samples,” Phys. Med. Biol. 52, 1565–1576 (2007). 10.1088/0031-9155/52/6/002 [DOI] [PubMed] [Google Scholar]
- Muthupillai R., Lomas D. J., Rossman P. J., Greenleaf J. F., Manduca A., and Ehman R. L., “Magnetic resonance elastography by direct visualization of propagating acoustic strain waves,” Science 269, 1854–1857 (1995). 10.1126/science.7569924 [DOI] [PubMed] [Google Scholar]
- Chenevert T. L., Skovoroda A. R., O’Donnel M., and Emelianov S., “Elasticity reconstructive imaging via simulated echo MRI,” Magn. Reson. Med. 39, 482–490 (1998). 10.1002/mrm.1910390319 [DOI] [PubMed] [Google Scholar]
- Kemper J., Sinkus R., Lorenzen J., Nolte-Ernsting C., Stork A., and Adam G., “MR elastography of the prostate: Initial in-vivo application,” Rofo 176, 1094–1099 (2004). 10.1055/s-2004-813279 [DOI] [PubMed] [Google Scholar]
- Kruse S. A., Rose G. H., Glaser K. J., Manduca A., Felmlee J. P., C. R.Jack, Jr., and Ehman R. L., “Magnetic resonance elastography of the brain,” Neuroimage 39, 231–237 (2008). 10.1016/j.neuroimage.2007.08.030 [DOI] [PMC free article] [PubMed] [Google Scholar]
- Osman N. F., “Detecting stiff masses using strain-encoded (SENC) imaging,” Magn. Reson. Med. 49, 605–608 (2003). 10.1002/mrm.10376 [DOI] [PubMed] [Google Scholar]
- Castillo E., Osman N. F., Rosen B. D., El-Shehaby I., Pan L., Jerosch-Herold M., Lai S., Bluemke D. A., and Lima J. A., “Quantitative assessment of regional myocardial function with MR-tagging in a multi-center study: Interobserver and intraobserver agreement of fast strain analysis with harmonic phase (HARP) MRI,” J. Cardiovasc. Magn. Reson. 7, 783–791 (2005). 10.1080/10976640500295417 [DOI] [PubMed] [Google Scholar]
- Fahmy A. S., Krieger A., and Osman N. F., “An integrated system for real-time detection of stiff masses with a single compression,” IEEE Trans. Biomed. Eng. 53, 1286–1293 (2006). 10.1109/TBME.2006.873690 [DOI] [PubMed] [Google Scholar]
- Haourni A., Hossain J., Jacobs M. A., and Osman N., “Improved hardware for higher spatial resolution strain-ENCoded (SENC) breast MRI for strain measurements,” Acad. Radiol. 18, 705–715 (2011). 10.1016/j.acra.2011.01.006 [DOI] [PMC free article] [PubMed] [Google Scholar]
- Youssef A., Ibrahim el S. H., Korosoglou G., Abraham M. R., Weiss R. G., and Osman N. F., “Strain-encoding cardiovascular magnetic resonance for assessment of right-ventricular regional function,” J. Cardiovasc. Magn. Reson. 10, 10–33 (2008). 10.1186/1532-429X-10-33 [DOI] [PMC free article] [PubMed] [Google Scholar]
- Stuber M., Spiegel M. A., Fischer S. E., Scheidegger M. B., Danias P. G., Pedersen E. M., and Boesiger P., “Single breath-hold slice-following CSPAMM myocardial tagging,” Magma 9, 85–91 (1999). 10.1007/BF02634597 [DOI] [PubMed] [Google Scholar]
- Stetson P. F., Sommer F. G., and Macovski A., “Lesion contrast enhancement in medical ultrasound imaging,” IEEE Trans. Med. Imaging 16, 416–425 (1997). 10.1109/42.611351 [DOI] [PubMed] [Google Scholar]
- Jacobs M. A., Stearns V., Wolff A. C., Barker P. B., Tsangaris T., Argani P., Davidson N. E., Bhujwalla Z. M., Bluemke D. A., and Ouwerkerk R., “Multiparametric magnetic resonance imaging, spectroscopy and multinuclear (23Na) imaging monitoring of preoperative chemotherapy for locally advanced breast cancer,” Acad. Radiol. 17, 1477–1485 (2010). 10.1016/j.acra.2010.07.009 [DOI] [PMC free article] [PubMed] [Google Scholar]
- Akhbardeh A. and Jacobs M. A., “Comparative analysis of nonlinear dimensionality reduction techniques for breast MRI segmentation,” Med. Phys. 39, 2275–2289 (2012). 10.1118/1.3682173 [DOI] [PMC free article] [PubMed] [Google Scholar]


