

In pulmonary arterial hypertension, reduced right ventricular (RV) longitudinal contractility and anteroseptal left ventricular longitudinal contractility are predicted by using increased RV afterload, but whether early detection of regional RV longitudinal dysfunction can be used to affect treatment and predict outcome is yet to be determined.
Abstract
Purpose:
To determine whether chronic pulmonary arterial pressure (PAP) elevation affects regional biventricular function and whether regional myocardial function may be reduced in pulmonary arterial hypertension (PAH) patients with preserved global right ventricular (RV) function.
Materials and Methods:
After informed consent, 35 PAH patients were evaluated with right heart catheterization and cardiac magnetic resonance (MR) imaging and compared with 13 healthy control subjects. Biventricular segmental, section, and mean ventricular peak systolic longitudinal strain (ELL), as well as left ventricular (LV) circumferential and RV tangential strains were compared between PAH patients and control subjects and correlated with global function and catheterization of the right heart indexes. Spearman ρ correlation with Bonferroni correction was used. Multiple linear regression analysis was performed to determine predictors for regional myocardial function.
Results:
In the RV of PAH patients, longitudinal contractility was reduced at the basal, mid, and apical levels, and tangential contractility was reduced at the midventricular level. Mean RV ELL positively correlated with mean PAP (r = 0.62, P < .0014) and pulmonary vascular resistance index (PVRI) (r = 0.77, P < .0014). Mean PAP was a predictor of mean RV ELL (β = .19, P = .005) in a multiple linear regression analysis. In the LV, reduced LV longitudinal and circumferential contractility were noted at the base. LV anteroseptal ELL positively correlated with increased mean PAP (r = 0.5, P = .03) and septal eccentricity index (r = 0.5, P = .01). In a subgroup of PAH patients with normal global RV function, significantly reduced RV longitudinal contractility was noted at basal and mid anterior septal insertions, as well as the mid anterior RV wall (P < .05 for all).
Conclusion:
In PAH patients, reduced biventricular regional function is associated with increased RV afterload (mean PAP and PVRI). Cardiac MR imaging helps identify regional RV dysfunction in PAH patients with normal global RV function.
© RSNA, 2012
Supplemental material: http://radiology.rsna.org/lookup/suppl/doi:10.1148/radiol.12111599/-/DC1
Introduction
Pulmonary arterial hypertension (PAH) is a complex chronic disorder that encompasses a wide variety of causes. Chronic elevation of pulmonary pressure and increased resistance result in right ventricular (RV) dysfunction and ultimately death (1). The RV and left ventricle (LV) share the interventricular septum (IVS) and are contained within the same pericardial sac, which leads to interventricular dependence; thus, RV pressure and volume loads cause leftward septal bowing, resulting in altered LV filling dynamics and function (2). It has become increasingly evident that clinical improvement and prolonged survival in PAH are highly dependent on preserved RV function (3). Indeed, RV end-diastolic volume and stroke volume are strong predictors of mortality and treatment failure (4). Thus, RV function assessment and follow-up in PAH patients are critical. To date, little is known about the effect of RV pressure overload on regional biventricular systolic deformation in PAH patients.
Myocardial tagging has been established as the standard of reference for accurate measurement of regional LV deformation (5). However, its application in the RV has been limited by the relatively thin wall (normal RV thickness, <5 mm) (6). In addition, three-dimensional myocardial strain assessment has been tedious in terms of data acquisition and offline postprocessing (7).
To overcome this challenge, fast strain-encoded (SENC) imaging, a through-plane magnetic resonance (MR) tagging technique, was developed to allow direct measurement of regional function by using a free-breathing single-heartbeat real-time acquisition (8). Fast SENC imaging allows direct measurement of longitudinal strain (ELL) by using short-axis images (9). In previous studies, fast SENC imaging with its high in-plane spatial resolution has been shown as a feasible and reproducible tool for RV (10) and LV (11) regional function assessment in cardiac patients and healthy subjects.
We hypothesized that chronic pulmonary arterial pressure elevation affects regional biventricular function and that regional myocardial function may be reduced in PAH patients with preserved global RV function.
Materials and Methods
One author (N.F.O.) is the founder of and a share holder in Diagnosoft (Palo Alto, Calif), which develops the software for measuring regional function of the heart used in this article.
The study was approved by the institutional review board at Johns Hopkins Hospital (Baltimore, Md). We prospectively examined a total of 48 consecutive participants who were included after providing written informed consent.
Thirty-five PAH patients (32 women [91%], three men [9%]; median age, 62 years; age range, 50.7–70.0 years), with a median mean pulmonary artery pressure (PAP) of 40.0 mm Hg (range, 29.0–49.0 mm Hg), were examined by using cardiac MR imaging and catheterization of the right heart performed on the same day. PAH was defined as a mean PAP of greater than 25 mm Hg, with a pulmonary capillary wedge pressure of 15 mm Hg or less. The underlying cause of PAH (systemic sclerosis-related PAH, n = 25; idiopathic PAH, n = 10) was determined.
Thirteen healthy subjects (median age, 55 years [range, 50.0–57.9 years]; nine [69%] women, four [31%] men; P = .2 for age and P = .07 for sex compared with PAH patients) were included for MR imaging comparison only. Exclusion criteria included any evidence of potential causes of PAH, systemic hypertension (resting blood pressure greater than 140/90 mm Hg), diabetes mellitus, ischemic or nonischemic heart disease, and history of smoking. In addition, a Framingham 10-year risk of greater than 10% was considered an exclusion criterion. Four volunteers were excluded from the study (two with a Framingham 10-year risk of greater than 10%, one with a history of smoking, and one with a history of ischemic heart disease).
Data Acquisition
Catheterization of the right heart.—All PAH patients underwent catheterization of the right heart through the right internal jugular vein. Quantified hemodynamic variables included the following: pulmonary capillary wedge pressure, right atrial pressure, mean PAP, and systolic and diastolic PAPs, cardiac index, and pulmonary vascular resistance index (PVRI). All patients completed the procedure for catheterization of the right heart without complications.
Cine MR imaging.—Imaging was performed by using a 3-T MR imaging unit (Achieva 3T; Philips Medical Systems, Best, the Netherlands). By using the four-chamber horizontal long-axis view, a stack of short-axis retrospectively gated gradient-echo turbo-fast low-angle shot cine images were prescribed. Imaging parameters were as follows: repetition time msec/echo time msec, 46/3.2; flip angle, 15°; bandwidth, 260 Hz/pixel; number of segments, 11; section thickness, 8 mm; matrix size, 256 × 192; field of view, 35 × 35 cm; acquired temporal resolution, 40 msec; and number of reconstructed cardiac phases, 30.
Fast SENC imaging.—Fast SENC imaging acquisitions were prescribed along the vertical long axis of the LV to obtain the four-chamber view for quantification of RV tangential strain (ETang). To measure RV and LV ELL, three evenly spaced short-axis sections were prescribed at the basal, mid, and apical levels. Typical fast SENC imaging parameters were as follows: 9.2/0.8; temporal resolution, 29–39 msec; flip angle, 30°; section thickness, 10 mm; field of view, 25.6 × 25.6 cm; reconstruction matrix, 64 × 64; and in-plane spatial resolution, 4 × 4 mm (upsampled by the reconstruction algorithm of the imaging unit to 1 mm/pixel). Each section was acquired during a single heartbeat, without breath holding. Fast SENC acquisitions yield a strain map, in which signal intensity is proportional to through-plane strain (Fig 1a, 1b).
Figure 1a:
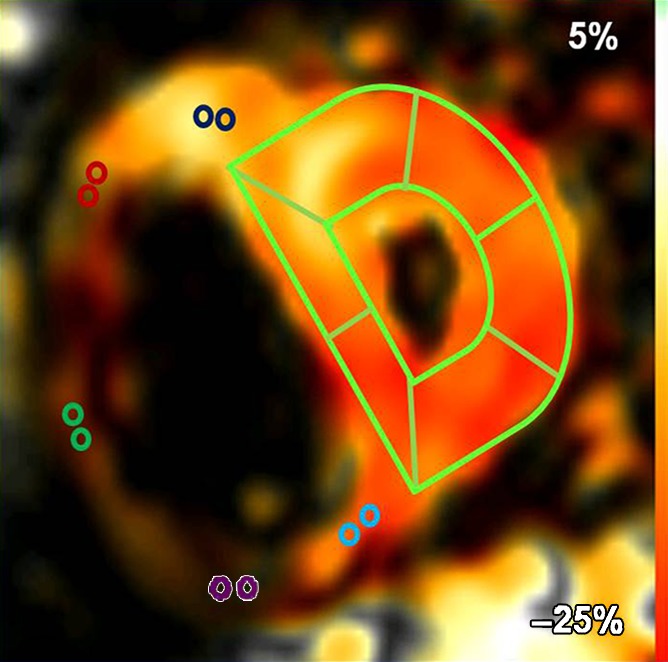
(a) Short-axis– and (b) four-chamber–view peak systolic fast SENC images in a 51-year-old woman with PAH (mean PAP, 45 mm Hg). (a) Short-axis view shows ELL and (b) four-chamber view shows RV tangential strain (ETang). Color bar shows scale for RV ELL (a) and RV ETang (b); maximum contraction is in red, and absent contraction, in white. Probe points (color rings) were used for RV ELL (a) and RV ETang (b) measurements. A semiautomatic grid overlay (green) was used to measure LV ELL (a) and LV ECC (c, short-axis tagging MR image). (d) Short-axis steady-state free precession cine MR image in peak systole shows measurement of the eccentricity index (EI), calculated as a/b, where a is the yellow line parallel to septum and b is the yellow line perpendicular to septum.
Figure 1b:

(a) Short-axis– and (b) four-chamber–view peak systolic fast SENC images in a 51-year-old woman with PAH (mean PAP, 45 mm Hg). (a) Short-axis view shows ELL and (b) four-chamber view shows RV tangential strain (ETang). Color bar shows scale for RV ELL (a) and RV ETang (b); maximum contraction is in red, and absent contraction, in white. Probe points (color rings) were used for RV ELL (a) and RV ETang (b) measurements. A semiautomatic grid overlay (green) was used to measure LV ELL (a) and LV ECC (c, short-axis tagging MR image). (d) Short-axis steady-state free precession cine MR image in peak systole shows measurement of the eccentricity index (EI), calculated as a/b, where a is the yellow line parallel to septum and b is the yellow line perpendicular to septum.
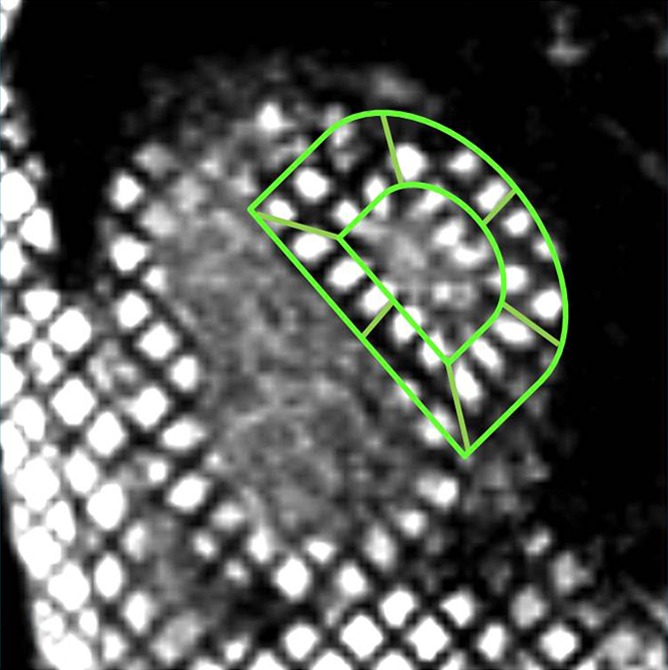
Conventional tagging.—Tagging images were prescribed by using the spatial modulation of magnetization at the same locations prescribed for short-axis fast SENC images by using the following parameters: 32.8/3.2; flip angle, 10°; section thickness, 8 mm; field of view, 35 × 35 cm; reconstruction matrix, 256 × 144; and tag spacing, 8 mm. Tagging images were used for measurement of LV ECC (Fig 1c).
Figure 1c:
(a) Short-axis– and (b) four-chamber–view peak systolic fast SENC images in a 51-year-old woman with PAH (mean PAP, 45 mm Hg). (a) Short-axis view shows ELL and (b) four-chamber view shows RV tangential strain (ETang). Color bar shows scale for RV ELL (a) and RV ETang (b); maximum contraction is in red, and absent contraction, in white. Probe points (color rings) were used for RV ELL (a) and RV ETang (b) measurements. A semiautomatic grid overlay (green) was used to measure LV ELL (a) and LV ECC (c, short-axis tagging MR image). (d) Short-axis steady-state free precession cine MR image in peak systole shows measurement of the eccentricity index (EI), calculated as a/b, where a is the yellow line parallel to septum and b is the yellow line perpendicular to septum.
Data Analysis
Data analysis was performed by a single observer (M.L.S., with 5 years of cardiac MR imaging experience).
Global ventricular function analysis.—Short-axis cine images were analyzed by using software (QMass 6.2.1; Medis, Leiden, the Netherlands). Epicardial and endocardial ventricular borders were semiautomatically contoured at end diastole and end systole for quantification of global function, ventricular mass, and ventricular mass index, with ventricular mass index calculated as RV mass divided by LV mass. Systolic EI, a measure of septal displacement, was measured at end systole by using basal short-axis images (Fig 1d) (12). It was calculated by dividing D1 by D2, where D1 is the minor-axis dimension parallel to the septum and D2 is the minor-axis dimension of the LV perpendicular to and bisecting the septum (13).
Figure 1d:
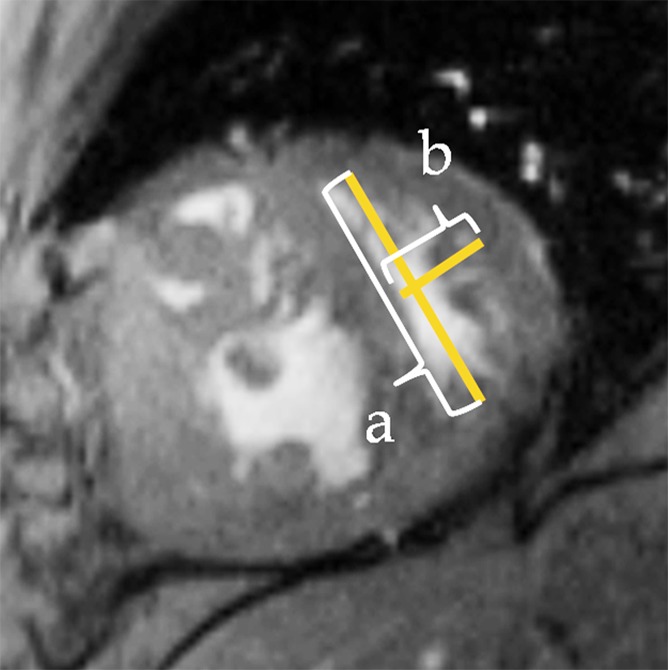
(a) Short-axis– and (b) four-chamber–view peak systolic fast SENC images in a 51-year-old woman with PAH (mean PAP, 45 mm Hg). (a) Short-axis view shows ELL and (b) four-chamber view shows RV tangential strain (ETang). Color bar shows scale for RV ELL (a) and RV ETang (b); maximum contraction is in red, and absent contraction, in white. Probe points (color rings) were used for RV ELL (a) and RV ETang (b) measurements. A semiautomatic grid overlay (green) was used to measure LV ELL (a) and LV ECC (c, short-axis tagging MR image). (d) Short-axis steady-state free precession cine MR image in peak systole shows measurement of the eccentricity index (EI), calculated as a/b, where a is the yellow line parallel to septum and b is the yellow line perpendicular to septum.
Fast SENC imaging and tagging strain quantification.—Software packages for fast SENC imaging (Diagnosoft) and tagging strain quantification (HARP; Diagnosoft) were used. Myocardial strain, S, represents percentage change in tissue length occurring at peak systole, L, with respect to its initial resting length at end diastole, L0. Negative values indicate muscle shortening, whereas a positive value indicates muscle stretching. The equation for strain was calculated thus: S = (L − L0)/L0.
RV strain analysis.—For peak systolic ELL measurement, fast SENC short-axis sections at the basal, mid, and apical ventricular levels were used. In each section, the RV wall was divided into five equal segments: anterior septal insertion, anterior, lateral, inferior, and inferior septal insertion (Fig 1a). RV ETang was analyzed by using the fast SENC four-chamber view. The lateral RV wall was divided into three equal segments: basal, mid, and apical segments (Fig 1b). In each segment, two regions of interest were selected, and an averaged strain-time curve was generated. By using these curves, peak systolic ELL and ECC values were determined.
LV strain analysis.—For LV strain analysis, a grid overlay was semiautomatically traced in the short-axis fast SENC and conventional tagging images (Fig 1a, 1c) for quantification of ELL and ECC, respectively. According to the American Heart Association segmentation model (14), the LV was divided into six basal, six mid, and four apical segments. Peak systolic ECC and ELL measurements were extracted for each LV segment. Section (basal, mid, and apical), as well as mean ventricular (average of all segments) peak systolic ELL and ECC, were calculated by means of segmental averaging.
Statistical Analysis
Continuous data are presented as medians and 25th and 75th percentiles of the interquartile ranges. The Mann-Whitney test was used for regional strain intergroup comparisons. Peak systolic ELL, LV ECC, and RV ETang were correlated with MR-quantified global ventricular function and indexes of catheterization of the right heart by using the Spearman ρ correlation. Bonferroni correction was used to account for multiple comparisons. Multiple linear regression analysis was performed to determine predictors of reduced mean biventricular longitudinal shortening. For subgroup analysis, we further divided the group of PAH patients into tertiles on the basis of RV ejection fraction (RVEF) and mean PAP. Regional function comparison was performed between control subjects and PAH patients in the highest tertile of RVEF for the RV and in the highest tertile of mean PAP for the LV. It should be noted that myocardial contraction is measured by using negative values: The higher (less negative) the value, the less myocardial contractility is present; and the lower (more negative) the value, the more myocardial contractility is present. Therefore, if myocardial strain parameters are positively correlated with parameters of catheterization of the right heart, it means that the contractility is actually decreased with increasing mean PAP, for example.
Results
Biventricular Global Function
Clinical characteristics and global biventricular cardiac function parameters of PAH patients and control subjects are presented in Table 1.
Table 1.
Demographics, Global Function, and Hemodynamic Indexes in PAH Patients and Control Subjects
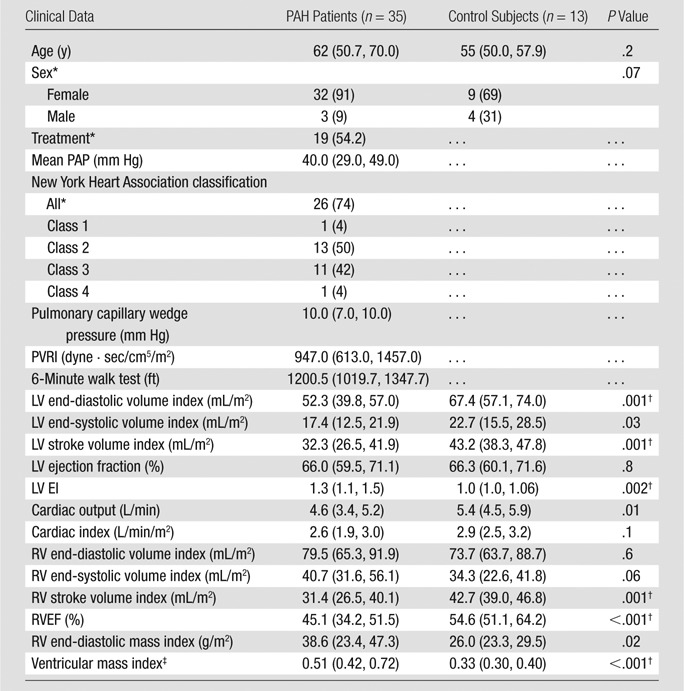
Note.—Data are medians, and lower and higher numbers in parentheses are the 25th and 75th percentiles, respectively, of the interquartile ranges, except where otherwise indicated. The Mann-Whitney test was used to compare demographics between PAH patients and control subjects. The P value for sex was determined with the Fisher exact test.
Data are numbers of individuals, and numbers in parentheses are percentages. Percentages were rounded.
P < .05 ÷ 15 = .0033 (Bonferroni correction).
This value was calculated by dividing RV mass by LV mass.
Peak Systolic ELL
In the RV, significantly reduced longitudinal contractility was noted at the basal, mid, and apical RV levels in PAH patients compared with healthy subjects (Table E1 [online], Fig 2a). In a segmental analysis, reduced longitudinal contractility was consistently noted in RV segments in the anterior and lateral RV wall in PAH patients. After Bonferroni correction, only the longitudinal contractility in the basal and mid anterior septal insertion segments and the mid anterior segment remained significant. Overall, mean RV longitudinal contractility was reduced in PAH patients compared with control subjects (−19.3% vs −21.3%, P = .001).
Figure 2a:

(a, b) Bull’s-eye plots of the peak ELL differences in LV and RV segments (a), as well as peak RV ETang and LV ECC differences (b) between the PAH patients and control subjects. PAH patients had significantly lower peak ELL at the anterior RV septal attachment site (segments a, f, and k), as well as the anterior and lateral RV wall (segments b, c, g, h, l, and m) at all ventricular levels. In the LV, mainly the anteroseptal and anterior wall had significantly reduced peak ELL (segments 2, 1, and 13). After Bonferroni correction, only the anterior RV septal attachment sites at the base and mid RV wall (segments a and f, dark gray), the mid RV anterior wall (segment g), and the basal LV anteroseptal wall (segment 2) remained significantly reduced in PAH patients. LV peak ECC was mainly reduced in the basal and mid IVS and in the inferior wall in PAH patients (segments 3, 4, 8, 10; segments 2 and 15 with borderline significance). After Bonferroni correction, only the LV mid inferior wall peak ECC and RV lateral mid wall ETang (segment h) remained significantly reduced (segment 10, dark gray). LV segments were as follows: 1 = basal anterior, 2 = basal anteroseptal, 3 = basal inferoseptal, 4 = basal inferior, 5 = basal inferolateral, 6 = basal anterolateral, 7 = mid anterior, 8 = mid anteroseptal, 9 = mid inferoseptal, 10 = mid inferior, 11 = mid inferolateral, 12 = mid anterolateral, 13 = apical anterior, 14 = apical septal, 15 = apical inferior, and 16 = apical lateral. RV segments were as follows: a = basal anterior RV attachment site, b = basal anterior, c = basal lateral, d = basal inferior, e = basal inferior RV attachment site, f = mid anterior RV attachment site, g = mid anterior, h = mid lateral, i = mid inferior, j = mid inferior RV attachment site, k = apical anterior RV attachment site, l = apical anterior, m = apical lateral, n = apical inferior, and o = apical inferior RV attachment site.
In the LV, reduced longitudinal contractility was mainly noted at the basal anteroseptal segments (Fig 2a, Table E2 [online]). In a subanalysis, a comparison of patients at the highest tertile of mean PAP (median mean PAP of 51 (range, 48.2–53) mm Hg) with control subjects, reduced longitudinal contractility was noted at the anteroseptal segment at the basal (median, −11.5% vs −18.1%; P = .003), mid (median, −12.3% vs −18.37%; P = .01), and apical (median, −14.9% vs −19.7%, P = .002) levels (Bonferroni correction, P < .05 ÷ 3 = .017).
Peak Systolic RV ETang and LV ECC
In the RV, participants with PAH demonstrated significantly reduced peak systolic tangential contractility at the mid segment of the lateral free wall (median, −18.4 vs −22.7; P = .001) (Fig 2b, Table E3 [online]).
Figure 2b:

(a, b) Bull’s-eye plots of the peak ELL differences in LV and RV segments (a), as well as peak RV ETang and LV ECC differences (b) between the PAH patients and control subjects. PAH patients had significantly lower peak ELL at the anterior RV septal attachment site (segments a, f, and k), as well as the anterior and lateral RV wall (segments b, c, g, h, l, and m) at all ventricular levels. In the LV, mainly the anteroseptal and anterior wall had significantly reduced peak ELL (segments 2, 1, and 13). After Bonferroni correction, only the anterior RV septal attachment sites at the base and mid RV wall (segments a and f, dark gray), the mid RV anterior wall (segment g), and the basal LV anteroseptal wall (segment 2) remained significantly reduced in PAH patients. LV peak ECC was mainly reduced in the basal and mid IVS and in the inferior wall in PAH patients (segments 3, 4, 8, 10; segments 2 and 15 with borderline significance). After Bonferroni correction, only the LV mid inferior wall peak ECC and RV lateral mid wall ETang (segment h) remained significantly reduced (segment 10, dark gray). LV segments were as follows: 1 = basal anterior, 2 = basal anteroseptal, 3 = basal inferoseptal, 4 = basal inferior, 5 = basal inferolateral, 6 = basal anterolateral, 7 = mid anterior, 8 = mid anteroseptal, 9 = mid inferoseptal, 10 = mid inferior, 11 = mid inferolateral, 12 = mid anterolateral, 13 = apical anterior, 14 = apical septal, 15 = apical inferior, and 16 = apical lateral. RV segments were as follows: a = basal anterior RV attachment site, b = basal anterior, c = basal lateral, d = basal inferior, e = basal inferior RV attachment site, f = mid anterior RV attachment site, g = mid anterior, h = mid lateral, i = mid inferior, j = mid inferior RV attachment site, k = apical anterior RV attachment site, l = apical anterior, m = apical lateral, n = apical inferior, and o = apical inferior RV attachment site.
In the LV, participants demonstrated reduced peak systolic circumferential contractility at the basal inferoseptal, basal inferior, mid anteroseptal, and mid inferior segments (Fig 2b, Table E4 [online]). After Bonferroni correction, the circumferential contractility of the mid inferior segment remained significant.
Biventricular Function and Pulmonary Hemodynamics
Mean RV ELL was positively correlated with RV afterload (mean PAP and PVRI) markers (mean PAP [r = 0.62, P < .0001] and PVRI [r = 0.77, P < .0001]) and ventricular mass index (r = 0.5, P = .001); negatively correlated with global RV function (RVEF [r = −0.52, P = .001] and RV stroke volume index [r = −0.45, P = .006]), negatively with LV end-diastolic volume index (r = −0.51, P = .002), and positively with LV EI (r = 0.66, P < .0001) (Bonferroni correction, P < .05 ÷ 14 = .0036) (Table 2).
Table 2.
Mean RV ELL Correlations with Global Function and Hemodynamics for Catheterization of the Right Side of the Heart in 35 PAH Patients
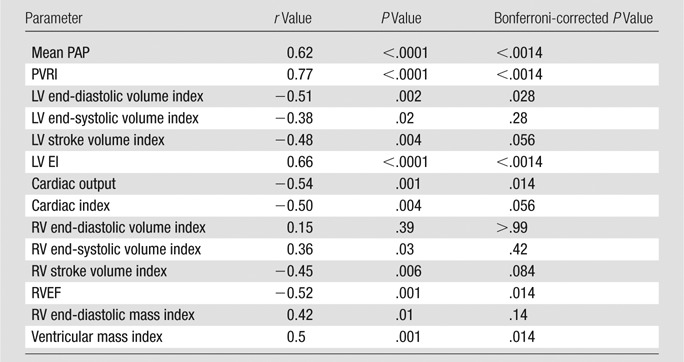
Note.—Spearman ρ correlation was used. Myocardial contraction was measured by using negative values: the higher (less negative) the value was, the less myocardial contractility, and the lower (more negative) the value was, the more myocardial contractility was present.
In the LV, basal anteroseptal ELL positively correlated with mean PAP (r = 0.5, P = .0002), PVRI (r = 0.6, P < .0001), and EI (r = 0.5, P = .001) in all PAH patients (Bonferroni correction, P < .05 ÷ 14 = .0036). For circumferential strain, regional septal LV ECC was also weakly positively correlated with septal EI and PVRI; however, after Bonferroni correction, the significance was lost (P > .05).
RV Regional Dysfunction in PAH Subgroup with Normal RVEF
Despite no significant difference in RV global function between control subjects and PAH patients in the highest tertile of RVEF (n = 12) (median RVEF, 55% [range, 51%–61%]; median mean PAP, 29.5 mm Hg [25th and 75th percentiles, 27 and 40 mm Hg, respectively]) (Table 3), regional analysis demonstrated reduced regional RV longitudinal contractility at basal and mid anterior septal insertions and the mid anterior RV segment (P = .04, .01, and .01, respectively) (Bonferroni correction, P < .05 ÷ 3 = .017) (Fig 3).
Table 3.
Global Function Comparison in 12 PAH Patients with Preserved RVEF versus 13 Control Subjects
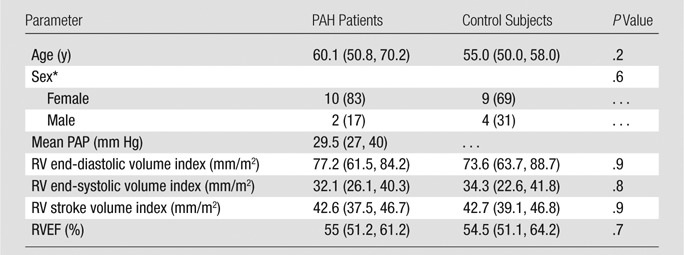
Note.—Data are medians, and lower and higher numbers in parentheses are the 25th and 75th percentiles, respectively, of the interquartile ranges, except where otherwise indicated. The Mann-Whitney test was used to compare PAH patients and control subjects.
Data are numbers of individuals, and numbers in parentheses are percentages. Percentages were rounded.
Figure 3a:

(a) Error bar representation of reduced RV segmental ELL in PAH patients with preserved global RV function compared with control subjects. (b) Schematic representation of reduced regional RV ELL at the basal and mid RV anterior septal insertions and mid RV anterior wall in PAH patients with preserved global RV function (Table 3). * = P < .05, for comparison of matching RV wall segments between the PAH patients and control subjects.
Figure 3b:
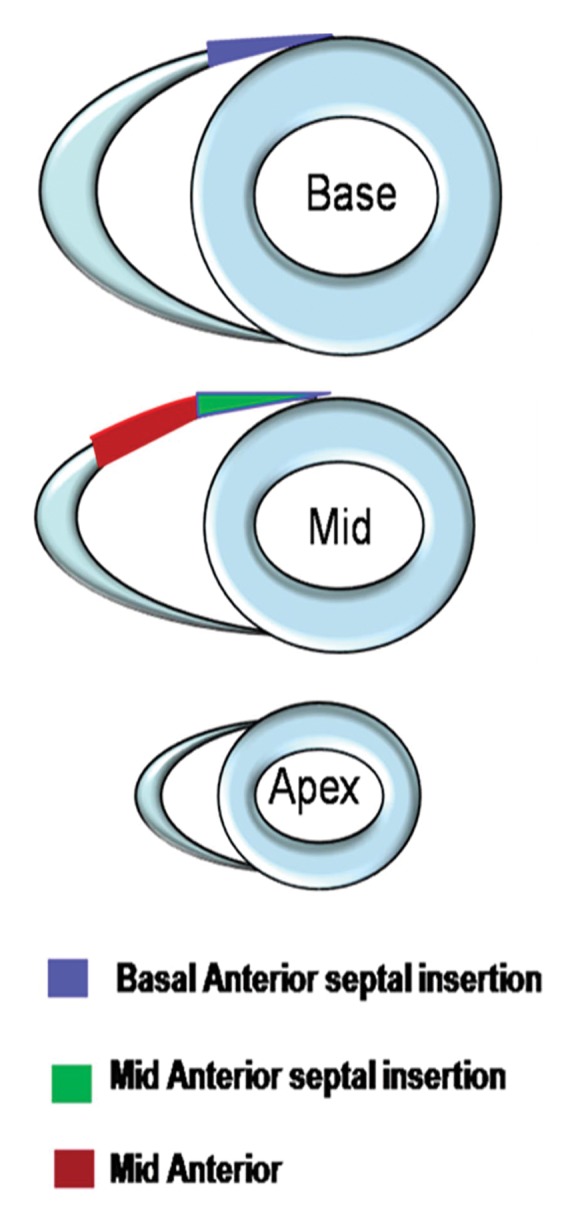
(a) Error bar representation of reduced RV segmental ELL in PAH patients with preserved global RV function compared with control subjects. (b) Schematic representation of reduced regional RV ELL at the basal and mid RV anterior septal insertions and mid RV anterior wall in PAH patients with preserved global RV function (Table 3). * = P < .05, for comparison of matching RV wall segments between the PAH patients and control subjects.
Linear Regression Analysis
In the RV, multiple linear regression analysis, including mean PAP, RV end-diastolic volume index, and RV mass index as parameters, revealed mean PAP as an independent predictor of reduced mean RV longitudinal contractility. For mean PAP, the β level was .19 (95% confidence interval [CI]: .07, .3), with a difference with a P value of .005; for RV end-diastolic volume, the β level was .015 (95% CI: −.051, .082), with a difference with a P value of .64; and for RV mass index, the β level was .059 (95% CI: −.063, .18), with a difference with a P value of .33.
In the LV, mean PAP remained an independent predictor of reduced regional longitudinal contractility at the basal anteroseptal region in a model including mean PAP, EI, LV end-diastolic volume index, and LV mass index as parameters. For mean PAP, the β level was .17 (95% CI: .16, .3), with a difference with a P value of .03; for EI, the β level was −.59 (95% CI: −4.3, 3.1), with a difference with a P value of .75; for LV end-diastolic mass index, the β level was .054 (95% CI: −.043, .15), with a difference with a P value of .27; and for LV end-diastolic volume index, the β level was −.12 (95% CI: −.24, .0007), with a difference with a P value of .051.
Discussion
In this study, we reported detailed regional biventricular function analysis results in relation to global function and pulmonary hemodynamics by using cardiac MR imaging in PAH patients. The major findings of our study included the following: (a) Reduced RV wall longitudinal contractility in PAH patients correlates with the degree of RV global ventricular dysfunction and increased afterload. (b) Increased RV afterload is associated with reduced LV basal anteroseptal longitudinal contractility. (c) PAH patients, compared with control subjects, with preserved RVEF show reduced regional RV longitudinal contractility at the anterior RV septal insertion sites.
In our study, PAH patients demonstrated reduced peak systolic RV longitudinal shortening in the majority of segments—except for the inferior RV wall—and reduced mean RV longitudinal contractility compared with control subjects. These findings are in agreement with previously published data reported by Fayad et al (6) demonstrating impaired peak systolic RV ELL in pulmonary hypertension patients using conventional MR tagging. In their study, the authors used conventional breath-hold MR tagging acquisitions in the long-axis plane which may limit strain quantification in some RV segments because of partial volume effects.
In our study, increased RV afterload (mean PAP) was an independent predictor for deterioration of mean RV ELL after adjusting for RV end-diastolic volume index and RV mass index in PAH patients. Furthermore, reduced mean RV longitudinal contractility was significantly correlated with the degree of RV global dysfunction. Using speckle tracking echocardiography, Puwanant et al (15) demonstrated significant reduction in RV lateral wall longitudinal contractility in PAH patients. Dambrauskaite et al (16) studied 27 pulmonary hypertension patients and 27 control subjects by using Doppler echocardiography strain and strain rate imaging. Dividing the lateral RV free wall into basal and apical segments, they reported an association between reduced apical longitudinal contractility and echocardiographic parameters of RV global dysfunction. Similarly, Pettersen et al (17) showed the decline of longitudinal deformation in patients with systemic RVs in the face of elevated pressure load.
Unlike the thick-walled LV pumping against high systemic resistance, the thin-walled RV is more suited to face a low-pressure vascular bed (1). As described by Ho and Nihoyannopoulos (18), the deep muscle layer of the RV wall is composed primarily of longitudinal fibers. This architectural pattern contributes to the predominantly longitudinal RV shortening responsible for blood ejection during systole and might explain the effect of increased afterload primarily on longitudinal RV shortening in our study.
In the present study, PAH patients demonstrated reduced regional IVS deformation in the longitudinal and circumferential direction. By using MR tagging (6) and speckle tracking echocardiography (15), researchers in previous studies reported reduced longitudinal and circumferential contractility in various segments of the IVS in PAH patients. In contrast, Huez et al (19) reported preserved IVS ELL in 18 pulmonary hypertension patients by using tissue Doppler imaging. In our study, we demonstrated that impaired septal ELL in PAH patients is a regional process that involves mainly the anteroseptal segment and proceeds from basal involvement in mild PAH cases to involvement of the whole septum in advanced conditions. ECC in the LV wall is mainly impaired in the IVS and inferior wall. Also, LV global function may be generally reduced because of decreased preload in this patient population.
The IVS plays an important functional role for both ventricles. Although structurally and anatomically considered part of the LV, the IVS is essential for RV ejection with normal conditions. Ventricular interdependence through the IVS is most apparent with changes in RV loading conditions (20). With elevated pulmonary pressure, increased RV pressure shifts the IVS toward the left, altering the LV geometry and thus affecting LV filling, as reflected by reduced LV end-diastolic volume and reduced LV stroke volume in the PAH group. In addition, elevated mean PAP was an independent predictor of reduced longitudinal contractility at the LV basal anteroseptal region. Reduced longitudinal contractility at that region and elevated mean PAP were, in turn, correlated with increased EI and reduced LV filling. Our results are in agreement with data in previous studies showing that septal dysfunction is present when septal stretch from volume and/or pressure loading impairs fiber shortening (21). Interestingly, PAH patients also demonstrated reduced LV regional longitudinal contractility at the basal anterior segment, as well as reduced regional circumferential contractility at the mid inferior LV segment. This finding could be attributed to the fact that these segments are in vicinity to the RV attachment zones at the IVS (20).
A clinically important finding in our study was the detection of altered RV regional deformation in PAH patients with preserved global RV function. Our results suggest that RV regional dysfunction in areas of potential mechanical stress—particularly at the anterior RV septal insertion site—may precede RV global compromise in response to elevated pulmonary pressure. In fact, we (22) recently demonstrated that, at the basal anterior RV septal attachment zone, decreased RV longitudinal contractility correlated with colocalized fibrosis mass on late gadolinium-enhanced MR images in PAH patients. In addition, the RV septomarginal trabeculations get inserted near the basal anterior RV attachment zone and are significantly hypertrophied in PAH. Their mass correlates with pulmonary pressure and resistance in PAH patients (23). These findings support the hypothesis that the anterior basal and mid ventricular RV septal attachment is under preferential mechanical stress likely due to its proximity to the RV outflow tract, which is directly exposed to increased pressure and resistance from the pulmonary vascular bed. This mechanical stress may result in increased interspersed wall fibrosis and mainly longitudinal regional myocyte dysfunction in this particular region of the myocardium. In contrast, at the inferior RV septal attachment zone, mainly septal and LV inferior wall circumferential strain is reduced in our PAH patient group. This could be due to increased RV wall tension from dilation and hypertrophy of the RV affecting mainly the circumferential shortening of the adjacent LV segment. Van Wolferen et al (4) demonstrated the value of MR-quantified global function parameters as prognostic markers of PAH patient survival. By using strain rate as a marker of myocardial functional impairment, Simon et al (24), further demonstrated gradual decline in RV longitudinal contractility in patients with elevated pulmonary pressures compared with control subjects and further decline in patients with associated RV failure. Therefore, MR regional ELL analysis could be a useful clinical tool for detection of incipient global RV dysfunction in PAH patients, perhaps prompting more aggressive medical therapy. At this time, however, the response of regional RV function to PAH therapy needs further investigation in longitudinal cohort studies.
In this study, we analyzed the biventricular longitudinal and circumferential components of myocardial strain. We did not, however, investigate the radial component of deformation. While this can be measured with conventional tagging, the low spatial density of tag lines in the radial direction (5) added to the thin RV wall make radial strain analysis quite challenging and more susceptible to measurement errors.
In conclusion, in PAH patients, reduced RV longitudinal contractility and anteroseptal LV longitudinal contractility are predicted by increased RV afterload. Further research is needed to determine whether early detection of regional RV longitudinal dysfunction can be used to affect treatment and predict outcome in PAH patients.
Advances in Knowledge.
• Chronic right ventricular (RV) pressure overload affects RV longitudinal systolic contractility and is associated with reduced left ventricular (LV) anteroseptal longitudinal shortening.
• LV longitudinal and circumferential strain is reduced mainly at the basal level in pulmonary arterial hypertension (PAH) patients.
• PAH patients with preserved RV global function show reduced regional RV longitudinal systolic contractility at the anterior RV septal insertion site.
Implication for Patient Care.
• MR regional strain analysis with fast strain-encoded imaging could be a useful clinical tool for detection of incipient global RV dysfunction in PAH patients.
Disclosures of Conflicts of Interest: M.L.S. No relevant conflicts of interest to disclose. A.A.H. No relevant conflicts of interest to disclose. J.S. No relevant conflicts of interest to disclose. T.A.B. No relevant conflicts of interest to disclose. D.B. No relevant conflicts of interest to disclose. N.L. Financial activities related to the present article: none to disclose. Financial activities not related to the present article: received consultancy fee from Synapse, payment for expert testimony from University of Miami, institution received grants or has grants pending from Cystic Fibrosis Foundation, received payment for lectures including service on speakers bureaus from Respironics. Other relationships: none to disclose. S.C.M. Financial activities related to the present article: none to disclose. Financial activities not related to the present article: received consultancy fees from Glead Sciences, Actelion, Bayer, and United Therapeutics; institution received unrestricted educational grant from Glead Sciences. Other relationships: none to disclose. R.G. No relevant conflicts of interest to disclose. N.F.O. Financial activities related to the present article: none to disclose. Financial activities not related to the present article: employed by, received royalties and stock or stock options from Diagnosoft. Other relationships: none to disclose. J.A.C.L. No relevant conflicts of interest to disclose. D.A.B. No relevant conflicts of interest to disclose. P.M.H. Financial activities related to the present article: none to disclose. Financial activities not related to the present article: received consultany fees from Pfizer and Glead Sciences, institution received grants or has grants pending for PAH database from Actelion and United Therapeutics. Other relationships: none to disclose. J.V. No relevant conflicts of interest to disclose.
Supplementary Material
Received July 29, 2011; revision requested September 23; final revision received March 15, 2012; accepted April 11; final version accepted July 11.
Funding: This research was supported by the National Institutes of Health (grants 1P50 HL084946-01 and 1P50HL08946) and by the National Heart, Lung, and Blood Institute (grant K23 HL092287). D.A.B. is an employee of the National Institutes of Health.
Abbreviations:
- CI
- confidence interval
- ECC
- circumferential strain
- EI
- eccentricity index
- ELL
- longitudinal strain
- ETang
- tangential strain
- IVS
- interventricular septum
- LV
- left ventricle
- PAH
- pulmonary arterial hypertension
- PAP
- pulmonary arterial pressure
- PVRI
- pulmonary vascular resistance index
- RV
- right ventricle
- RVEF
- RV ejection fraction
- SENC
- strain encoded
References
- 1.Chin KM, Kim NH, Rubin LJ. The right ventricle in pulmonary hypertension. Coron Artery Dis 2005;16(1):13–18 [DOI] [PubMed] [Google Scholar]
- 2.Marcu CB, Beek AM, Van Rossum AC. Cardiovascular magnetic resonance imaging for the assessment of right heart involvement in cardiac and pulmonary disease. Heart Lung Circ 2006;15(6):362–370 [DOI] [PubMed] [Google Scholar]
- 3.Champion HC, Michelakis ED, Hassoun PM. Comprehensive invasive and noninvasive approach to the right ventricle-pulmonary circulation unit: state of the art and clinical and research implications. Circulation 2009;120(11):992–1007 [DOI] [PubMed] [Google Scholar]
- 4.van Wolferen SA, Marcus JT, Boonstra A, et al. Prognostic value of right ventricular mass, volume, and function in idiopathic pulmonary arterial hypertension. Eur Heart J 2007;28(10):1250–1257 [DOI] [PubMed] [Google Scholar]
- 5.Moore CC, Lugo-Olivieri CH, McVeigh ER, Zerhouni EA. Three-dimensional systolic strain patterns in the normal human left ventricle: characterization with tagged MR imaging. Radiology 2000;214(2):453–466 [DOI] [PMC free article] [PubMed] [Google Scholar]
- 6.Fayad ZA, Ferrari VA, Kraitchman DL, et al. Right ventricular regional function using MR tagging: normals versus chronic pulmonary hypertension. Magn Reson Med 1998;39(1):116–123 [DOI] [PubMed] [Google Scholar]
- 7.Haber I, Metaxas DN, Axel L. Three-dimensional motion reconstruction and analysis of the right ventricle using tagged MRI. Med Image Anal 2000;4(4):335–355 [DOI] [PubMed] [Google Scholar]
- 8.Pan L, Stuber M, Kraitchman DL, Fritzges DL, Gilson WD, Osman NF. Real-time imaging of regional myocardial function using fast-SENC. Magn Reson Med 2006;55(2):386–395 [DOI] [PubMed] [Google Scholar]
- 9.Osman NF, Sampath S, Atalar E, Prince JL. Imaging longitudinal cardiac strain on short-axis images using strain-encoded MRI. Magn Reson Med 2001;46(2):324–334 [DOI] [PubMed] [Google Scholar]
- 10.Shehata ML, Basha TA, Tantawy WH, et al. Real-time single-heartbeat fast strain-encoded imaging of right ventricular regional function: normal versus chronic pulmonary hypertension. Magn Reson Med 2010;64(1):98–106 [DOI] [PMC free article] [PubMed] [Google Scholar]
- 11.Korosoglou G, Youssef AA, Bilchick KC, et al. Real-time fast strain-encoded magnetic resonance imaging to evaluate regional myocardial function at 3.0 tesla: comparison to conventional tagging. J Magn Reson Imaging 2008;27(5):1012–1018 [DOI] [PubMed] [Google Scholar]
- 12.López-Candales A, Rajagopalan N, Kochar M, Gulyasy B, Edelman K. Systolic eccentricity index identifies right ventricular dysfunction in pulmonary hypertension. Int J Cardiol 2008;129(3):424–426 [DOI] [PubMed] [Google Scholar]
- 13.Ryan T, Petrovic O, Dillon JC, Feigenbaum H, Conley MJ, Armstrong WF. An echocardiographic index for separation of right ventricular volume and pressure overload. J Am Coll Cardiol 1985;5(4):918–927 [DOI] [PubMed] [Google Scholar]
- 14.Cerqueira MD, Weissman NJ, Dilsizian V, et al. Standardized myocardial segmentation and nomenclature for tomographic imaging of the heart: a statement for healthcare professionals from the Cardiac Imaging Committee of the Council on Clinical Cardiology of the American Heart Association. Circulation 2002;105(4):539–542 [DOI] [PubMed] [Google Scholar]
- 15.Puwanant S, Park M, Popović ZB, et al. Ventricular geometry, strain, and rotational mechanics in pulmonary hypertension. Circulation 2010;121(2):259–266 [DOI] [PMC free article] [PubMed] [Google Scholar]
- 16.Dambrauskaite V, Delcroix M, Claus P, et al. Regional right ventricular dysfunction in chronic pulmonary hypertension. J Am Soc Echocardiogr 2007;20(10):1172–1180 [DOI] [PubMed] [Google Scholar]
- 17.Pettersen E, Helle-Valle T, Edvardsen T, et al. Contraction pattern of the systemic right ventricle shift from longitudinal to circumferential shortening and absent global ventricular torsion. J Am Coll Cardiol 2007;49(25):2450–2456 [DOI] [PubMed] [Google Scholar]
- 18.Ho SY, Nihoyannopoulos P. Anatomy, echocardiography, and normal right ventricular dimensions. Heart 2006;92(suppl 1):i2–i13 [DOI] [PMC free article] [PubMed] [Google Scholar]
- 19.Huez S, Vachiéry JL, Unger P, Brimioulle S, Naeije R. Tissue Doppler imaging evaluation of cardiac adaptation to severe pulmonary hypertension. Am J Cardiol 2007;100(9):1473–1478 [DOI] [PubMed] [Google Scholar]
- 20.Haddad F, Hunt SA, Rosenthal DN, Murphy DJ. Right ventricular function in cardiovascular disease. I. Anatomy, physiology, aging, and functional assessment of the right ventricle. Circulation 2008;117(11):1436–1448 [DOI] [PubMed] [Google Scholar]
- 21.Buckberg GD; RESTORE Group The ventricular septum: the lion of right ventricular function, and its impact on right ventricular restoration. Eur J Cardiothorac Surg 2006;29(suppl 1):S272–S278 [DOI] [PubMed] [Google Scholar]
- 22.Shehata ML, Lossnitzer D, Skrok J, et al. Myocardial delayed enhancement in pulmonary hypertension: pulmonary hemodynamics, right ventricular function, and remodeling. AJR Am J Roentgenol 2011;196(1):87–94 [DOI] [PMC free article] [PubMed] [Google Scholar]
- 23.Vogel-Claussen J, Shehata ML, Lossnitzer D, et al. Increased right ventricular septomarginal trabeculation mass is a novel marker for pulmonary hypertension: comparison with ventricular mass index and right ventricular mass. Invest Radiol 2011;46(9):567–575 [DOI] [PMC free article] [PubMed] [Google Scholar]
- 24.Simon MA, Rajagopalan N, Mathier MA, Shroff SG, Pinsky MR, López-Candales A. Tissue Doppler imaging of right ventricular decompensation in pulmonary hypertension. Congest Heart Fail 2009;15(6):271–276 [DOI] [PMC free article] [PubMed] [Google Scholar]
Associated Data
This section collects any data citations, data availability statements, or supplementary materials included in this article.