Tomosynthesis used as a replacement for conventional diagnostic views leads to a significant improvement in accuracy of the diagnostic assessment for patients with soft-tissue–based breast lesions.
Abstract
Purpose:
To compare the diagnostic performance of breast tomosynthesis versus supplemental mammography views in classification of masses, distortions, and asymmetries.
Materials and Methods:
Eight radiologists who specialized in breast imaging retrospectively reviewed 217 consecutively accrued lesions by using protocols that were HIPAA compliant and institutional review board approved in 182 patients aged 31–60 years (mean, 50 years) who underwent diagnostic mammography and tomosynthesis. The lesions in the cohort included 33% (72 of 217) cancers and 67% (145 of 217) benign lesions. Eighty-four percent (182 of 217) of the lesions were masses, 11% (25 of 217) were asymmetries, and 5% (10 of 217) were distortions that were initially detected at clinical examination in 8% (17 of 217), at mammography in 80% (173 of 217), at ultrasonography (US) in 11% (25 of 217), or at magnetic resonance imaging in 1% (2 of 217). Histopathologic examination established truth in 191 lesions, US revealed a cyst in 12 lesions, and 14 lesions had a normal follow-up. Each lesion was interpreted once with tomosynthesis and once with supplemental mammographic views; both modes included the mediolateral oblique and craniocaudal views in a fully crossed and balanced design by using a five-category Breast Imaging Reporting and Data System (BI-RADS) assessment and a probability-of-malignancy score. Differences between modes were analyzed with a generalized linear mixed model for BI-RADS–based sensitivity and specificity and with modified Obuchowski-Rockette approach for probability-of-malignancy–based area under the receiver operating characteristic (ROC) curve.
Results:
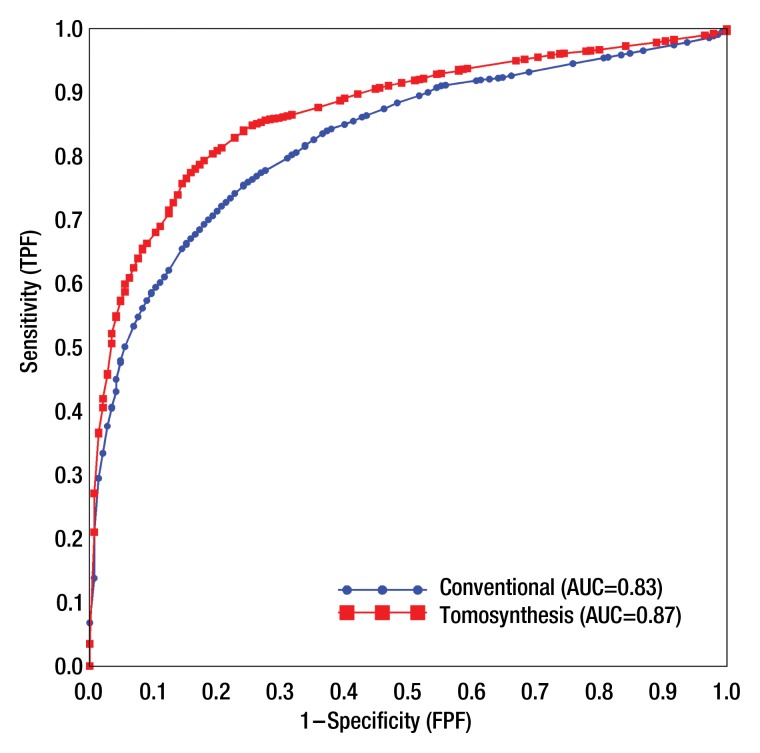
Average probability-of-malignancy–based area under the ROC curve was 0.87 for tomosynthesis versus 0.83 for supplemental views (P < .001). With tomosynthesis, the false-positive rate decreased from 85% (989 of 1160) to 74% (864 of 1160) (P < .01) for cases that were rated BI-RADS category 3 or higher and from 57% (663 of 1160) to 48% (559 of 1160) for cases rated BI-RADS category 4 or 5 (P < .01), without a meaningful change in sensitivity. With tomosynthesis, more cancers were classified as BI-RADS category 5 (39% [226 of 576] vs 33% [188 of 576]; P = .017) without a decrease in specificity.
Conclusion:
Tomosynthesis significantly improved diagnostic accuracy for noncalcified lesions compared with supplemental mammographic views.
© RSNA, 2012
Introduction
Supplemental diagnostic mammographic views are used to assist radiologists with their assessment of possible abnormalities, and they are performed in addition to the standard mediolateral oblique and craniocaudal views. These views include angled, rolled, or spot compression views with or without magnification. Although this paradigm has been useful, the average positive predictive value of an abnormal interpretation in the diagnostic setting, even with these supplemental views, is less than 36% (1–3). The average sensitivity has been reported to be approximately 85% in the diagnostic setting, and the percentage of cancers that are found at stage 0 or I is only slightly greater than 62% for diagnostic patients (2).
The use of digital mammography has been found to result in substantial improvements in performance of radiologists who interpret screening examinations of younger women with dense breast tissue (4). Full-field digital detectors with high resolution and large sensor size offer not only better contrast sensitivity but also opportunities to develop advanced digital imaging techniques. Digital breast tomosynthesis is an advanced technique that offers a potential advantage for evaluation of masses, areas of architectural distortion, and asymmetries compared with conventional two-dimensional mammographic images. With this technology, the x-ray tube moves through a prescribed arc and collects multiple low-dose images of the breast that are then reconstructed into sections as thin as 1 mm. Therefore, the overlying tissue that confounds the clear depiction of lesion margin and shape analysis on two-dimensional mammographic images is out of the plane of focus with tomosynthesis. In theory, the radiologist may be more accurate in not only characterizing these findings, but also more sensitive in detecting smaller lesions that were obscured by superimposed dense tissue on the conventional mammogram. It is possible that tomosynthesis may reduce the need for extra views and even ultrasonography (US) in some cases. Even more important, tomosynthesis may reduce the rate of false-positive breast biopsies. Several studies have shown that tomosynthesis is subjectively preferred to conventional mammography, and it may offer superior diagnostic accuracy for the evaluation of breast lesions (5–12).
The purpose of our study was to compare the diagnostic performance of digital breast tomosynthesis and conventional supplemental diagnostic digital mammography in the classification of masses, distortions, and asymmetries initially identified at standard two-view mammography, US, clinical examination, or magnetic resonance (MR) imaging.
Materials and Methods
Study Population
The images used in this institutional review board–approved retrospective reader study were acquired with Health Insurance Portability and Accountability Act–compliant protocols in which patients underwent both conventional diagnostic digital mammography as part of routine clinical practice and digital breast tomosynthesis at our facility. In part, the protocols were supported by research grants that were awarded by Hologic (Bedford, Mass) to our institution to perform applied projects on digital breast tomosynthesis. Hologic had no control over our study design, data analyses, or the publication of the results. Prior to participation, each patient signed written informed consent forms for the prospectively accrued source protocols to undergo digital breast tomosynthesis. For this study, a waiver of informed consent was obtained to perform a retrospective review of those cases. The images, clinical information, histopathologic information (if applicable), and outcomes were all made anonymous and stored in a secure research database. Patients who were eligible for this reader study were identified through a search of the database that included over 2500 experimental studies.
Inclusion criteria for the search were all patients who underwent diagnostic mammography with supplemental mammographic views (eg, spot compression, angled, and/or magnification views) and breast tomosynthesis for a tissue-density finding, including a mass, architectural distortion, or asymmetry, from June 25, 2008, to January 21, 2011. All of the prospectively accrued source protocols had the same inclusion criteria for up to 60 years of age, and so that was not a specific inclusion criterion for this retrospective review study. The inclusion criteria allowed the diagnostic mammographic evaluation to have been initiated by a clinical issue, such as a palpable lump, a finding on the mammogram, or a finding on US or MR images. The search revealed a total of 206 patients who met the inclusion criteria. If the identified lesion was only a calcification (101 cases), it was excluded because that cohort had previously been reported (13). One case was excluded because of tomosynthesis failure, and 23 other cases were excluded because the lesion that was sampled at biopsy was detected with US or MR imaging and was visible with neither the supplemental views nor tomosynthesis. This resulted in the final cohort of 182 women with 217 verified lesions.
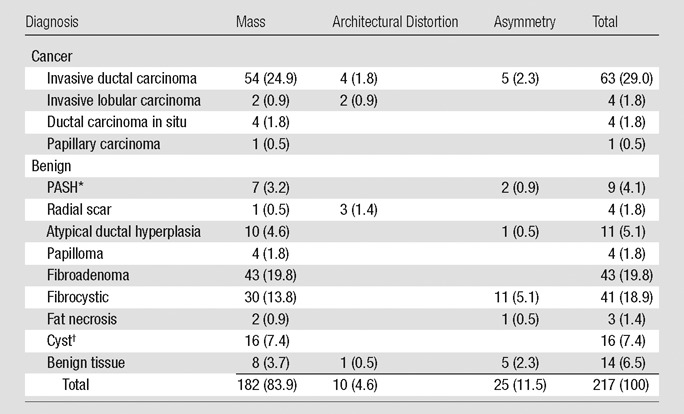
The average patient age was 50 years (range, 31–60 years; median, 50 years). Patients who presented with a clinical symptom, for screening recall, or for high-risk screening were included, and the study lesions were initially detected by means of clinical examination (8% [17 of 217]), mammography (80% [173 of 217]), US (11% [25 of 217]), or MR imaging (1% [two of 217]). Average lesion size was 18 mm (range, 2–93 mm; median, 13 mm) and 84% (182 of 217) were masses, 11% (25 of 217) were asymmetries, and 5% (10 of 217) were distortions. Truth was based on histopathologic analysis from biopsy (191 lesions), US that showed an anechoic cyst (12 lesions), or normal follow-up of 1–3 years (mean, 1 year) for benign stable tissue (14 lesions) (Table 1). A total of 33% (72 of 217) of the lesions were malignant, and 67% (145 of 217) were benign. Twelve cases had been used in prior detection-type observer studies (9).
Table 1.
Diagnosis of 217 Lesions according to Imaging Appearance
Note.—Numbers in parentheses are percentages.
PASH = pseudoangiomatous stromal hyperplasia.
Based on US findings, 12 cysts did not undergo biopsy and four did undergo biopsy.
The cohort was reviewed by a Mammography Quality Standards Act (MQSA)-qualified radiologist (M.L.Z) with 15 years of experience in mammography and 4 years of experience in evaluating tomosynthesis studies and who had knowledge of the clinical data and outcomes and did not participate in the reader study. To ensure that the correct findings were analyzed for each case, this radiologist marked the type and location of each lesion of interest on a reader study form. In cases where there was more than one lesion, a separate form was created for each lesion.
Image Acquisition
The tomosynthesis images were acquired by a research unit (Hologic) that evolved over the course of data collection. Twenty-five studies with 26 lesions that were imaged from June 25 to December 31, 2008, were acquired by using molybdenum or rhodium for target and filter, and 11 projection images were obtained through a 15° arc. From January 1, 2009, to January 21, 2011, 157 patients with 191 lesions underwent tomosynthesis that used a tungsten target and a silver filter, and 15 low-dose projection images were obtained over a 15° arc. The peak voltage and milliampere-seconds settings were automatically determined by the system in autofilter mode for all versions of the unit. For each breast of each patient, mediolateral oblique and craniocaudal tomosynthesis image sets were obtained. The system automatically computed radiation dose per view for the tomosynthesis image sets and the corresponding two-dimensional mammograms, which was, on average, 257 mGy ± 73 and 230 mGy ± 76, respectively. Prior to their use in this study, all tomosynthesis data sets were reprocessed by the vendor to provide the most current version of image processing for this study.
The conventional two-view mammograms (including mediolateral oblique, craniocaudal, and all supplemental diagnostic views) were obtained by our clinical full-field digital mammography units, which used either molybdenum or rhodium for target and filter (Selenia; Hologic). The system’s autofilter mode automatically determined peak voltage and milliampere-seconds settings for these studies.
Readers and Training
Eight MQSA-qualified academic breast imaging radiologists who had 2–38 years (average, 18 years) of experience in interpretation of mammograms and 2–7 years (average, 4 years) of experience in evaluation of tomosynthesis images participated in this protocol. An instructional form was developed and given to each reader, along with a training set of 10 cases to familiarize the readers with the study tasks. Training cases were not included in any of the analyses. Readers were given an opportunity to ask questions, and a research staff was available during this training session to answer questions.
Studies were displayed on a commercially available digital mammography workstation that included two 5–megapixel monitors (SecureView Dx; Hologic). This workstation displayed mammographic and tomosynthesis images and was clinically used in our practice. Therefore, the readers were familiar with the features of the workstation. A hanging protocol was developed to enable expeditious review of each case, but the radiologists were allowed to deviate from this protocol, and they used all display tools as they would in the clinical environment.
Observer Performance Study
Each lesion was interpreted twice by every reader; once with tomosynthesis and the standard mediolateral oblique and craniocaudal views, and once with all supplemental views (eg, spot compression, angled, rolled) and mediolateral oblique and craniocaudal views in a fully mode-crossed and balanced design. To minimize case recall as much as possible, there was a 6-week delay between interpretations of the two modes for each reader. The order in which the cases were displayed was created by a computer program and was unique for each reader. Four of the readers interpreted the lesions with the original mediolateral oblique and craniocaudal views along with the tomosynthesis images first, and the other four readers began the study by interpreting the original mediolateral oblique and craniocaudal views together with the conventional diagnostic images. In both modes, the radiologists provided a number from 1 to 100 for a probability-of-malignancy rating, as well as a five-category Breast Imaging Reporting and Data System (BI-RADS) assessment for the specified lesion.
Statistical Analysis
The performance of the two modes was summarized with receiver operating characteristic (ROC) curves that were constructed from the following two assessment scales: diagnostic BI-RADS and pseudocontinuous rating of the perceived or subjectively estimated probability of malignancy. Performance levels of the eight readers were summarized with the average ROC curve for the probability-of-malignancy scale and the pooled ROC curve for the BI-RADS scale. A linearly interpolated empiric estimate (14) was used for generating ROC curves for individual readers, modality, and type of scale. For each modality, the probability-of-malignancy ROC curve was obtained as a vertical average of reader-specific ROC curves. The ROC curves for the BI-RADS scale were estimated by averaging reader-specific sensitivity and specificity that corresponded to a given threshold on the BI-RADS scale.
In the main analysis, we compared reader-averaged areas under the ROC curves for the probability-of-malignancy scale by using a conventional approach for analysis of cross-correlated multireader data (15). This analysis accounted for the cross-correlated structure of the data, which was due to cases and readers, and for random reader factors. The method was based on the nonparametric estimates of the area under the ROC curve (AUC) and jackknife covariance estimates.
We also considered differences between the modes in terms of the frequencies of several clinically relevant categories of the BI-RADS scale, which included nonnegative findings (BI-RADS category 3, 4, or 5), biopsy recommendations (BI-RADS category 4 or 5), and assessments that were highly suggestive of malignancy (BI-RADS category 5). This was equivalent to a point-by-point comparison of BI-RADS–based ROC curves. We performed the statistical analysis of differences in the frequencies within a generalized linear mixed model framework (PROC GLIMMIX v.9.2; SAS Institute, Cary, NC), and accounted for the correlation between the assessments of the same patients, as well as for the random reader factors. Finally, although every lesion was evaluated independently, we verified that the results of the statistical analysis remained significant after we accounted for a possible correlation between evaluations of additional lesions that were identified in the same patients by using residual random effects. With this evaluation, the results remained statistically significant (P < .05).
Results
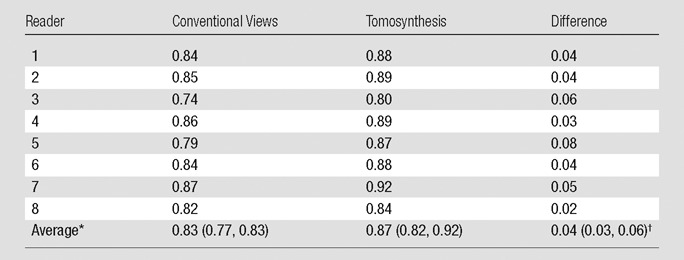
The average AUC for the probability-of-malignancy assessments performed with tomosynthesis views was significantly higher than that for the conventional views (0.87 vs 0.83, respectively; P < .001) (Fig 1). Each of the eight readers performed better by using tomosynthesis than by using standard views (Table 2).
Figure 1:
ROC curves for average probability of malignancy as assessed by using conventional supplemental diagnostic views and tomosynthesis views.
Table 2.
Reader-specific and Reader-averaged Area Under the Probability-of-Malignancy–based ROC Curves
Data in parentheses are the 95% confidence intervals. Confidence intervals and P value account for the correlation between the estimates of the reader-specific AUC and variability between readers.
P < .001 for testing differences is the average AUC.
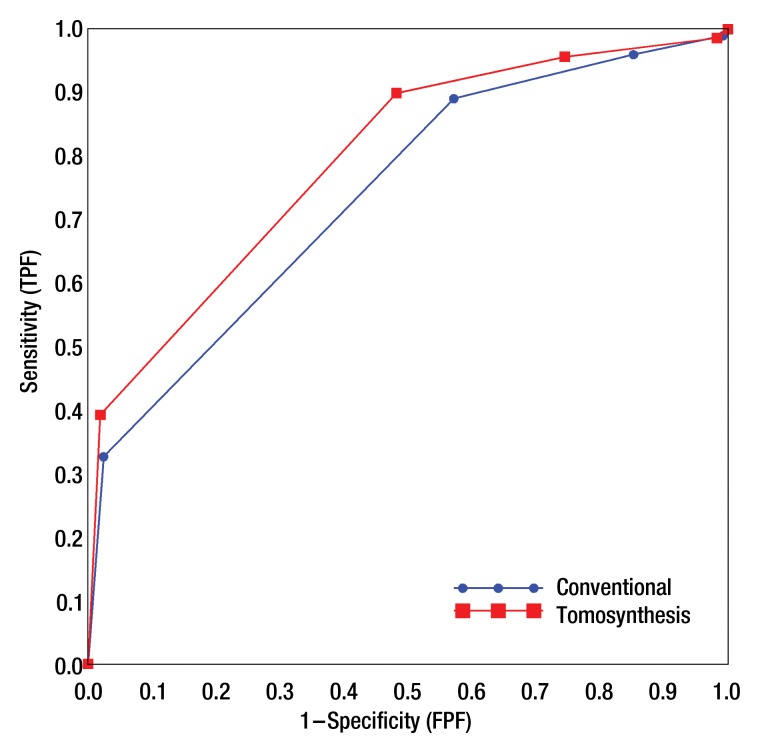
Similar to the probability-of-malignancy scale, the overall ROC curve for tomosynthesis based on BI-RADS was uniformly higher than that for supplemental views (Fig 2). Using tomosynthesis, radiologists, on average, reduced the frequency of recommendations for either short-interval follow-up or biopsy (BI-RADS category 3, 4, or 5) for patients with benign lesions (Table 3). The average false-positive rate decreased to 74% (864 of 1160) for tomosynthesis from 85% (989 of 1160) for additional views (P < .01), while the average true-positive rate remained roughly 96% for both modes (551 of 576 and 553 of 576, correspondingly). For lesions that were assigned a BI-RADS category of 4 or 5, the frequency of biopsy recommendations for benign lesions decreased from 57% (663 of 1160) for additional views to 48% (559 of 1160) for tomosynthesis (P < .01) while the biopsy recommendations remained at roughly 90% for malignant lesions for both modes (513 of 576 and 518 of 576, correspondingly). Finally, radiologists, on average, increased the frequency of BI-RADS category 5 assessment for malignant lesions from 33% (188 of 576) for additional views to 39% (226 of 576) for tomosynthesis (P = .017) without increasing the frequency of false-positive ratings for lesions that were actually benign. Analysis that accounted for correlation between evaluations of lesions from the same patients yielded similar results. Figure 3 shows a mass on spot compression and tomosynthesis images and demonstrates the improved depiction of the mass with tomosynthesis.
Figure 2:
Pooled BI-RADS–based ROC curves for diagnostic assessment of conventional diagnostic views and tomosynthesis views (numeric estimates are provided in Table 3).
Table 3.
Reader-specific and Average Frequencies of Several Categories of BI-RADS Ratings

Note.— Data are from 217 cases (72 malignancies).The marked differences in average frequencies are statistically significant at the .05 level. Statistical analysis accounted for both cross-correlated structure of the data and random reader factors. Conv = conventional, FPF = false-positive fraction, Tomo = tomosynthesis, TPF = true-positive fraction.
BI-RADS 3, 4, 5 were considered test positive.
BI-RADS 4, 5 were considered test positive.
BI-RADS 5 was considered test positive.
Figure 3a:
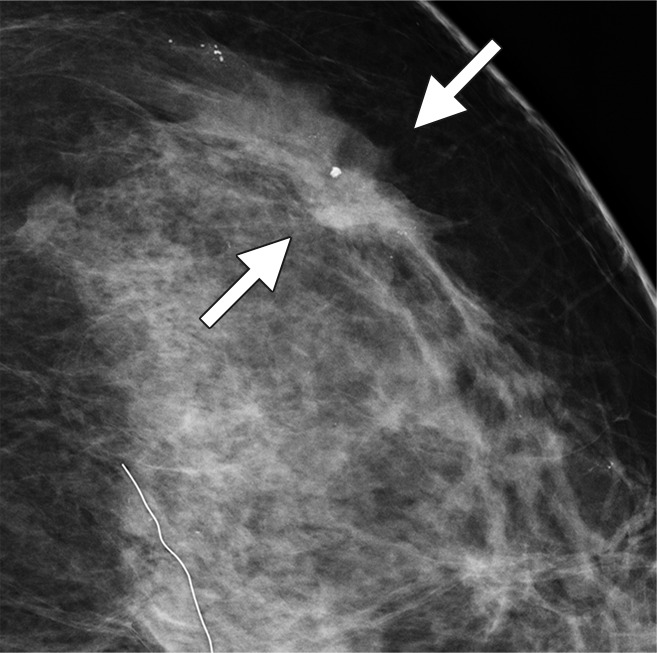
Possible mass in a 54-year-old woman. Craniocaudal (a) spot compression and (b) tomosynthesis images show biopsy-proved invasive ductal carcinoma (arrows). The spiculated mass margins are better shown in b than in a.
Figure 3b:
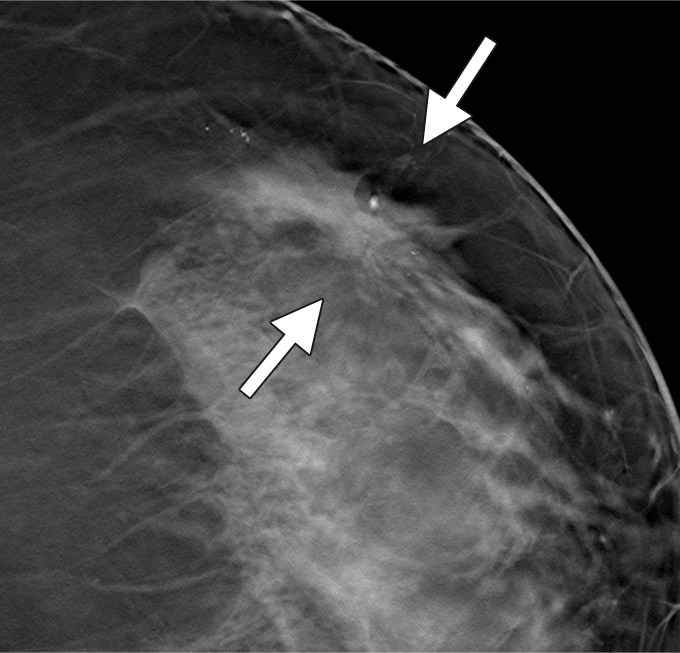
Possible mass in a 54-year-old woman. Craniocaudal (a) spot compression and (b) tomosynthesis images show biopsy-proved invasive ductal carcinoma (arrows). The spiculated mass margins are better shown in b than in a.
Discussion
In this study, the use of tomosynthesis as a replacement for conventional diagnostic views led to a significant improvement in accuracy of the diagnostic assessment for patients with soft-tissue–based breast findings. By using tomosynthesis views, radiologists rated fewer benign masses as BI-RADS category 3, 4, or 5, without loss of sensitivity. More malignant lesions were rated as highly suggestive of malignancy (BI-RADS category 5), and, by using tomosynthesis, radiologists better differentiated between malignant and benign lesions.
In clinical practice, the results of this study suggest that use of tomosynthesis is likely to translate into fewer recalled screening examinations, fewer short-interval follow-up studies, and fewer biopsies in patients with benign lesions. Prediction that tomosynthesis will lead to lower recalled screening exams has been published previously. Poplack et al (16) found a possible recall reduction of 40% when tomosynthesis was performed in a cohort of 98 patients who had been recalled after conventional screening. Similarly, Gur et al (17) found a 30% recall reduction for patients with verified benign findings in a retrospective review of 125 cases that did not overlap with this dataset.
Our results suggest that tomosynthesis may be used in lieu of supplemental diagnostic views, based on the improvement in the probability-of-malignancy evaluation and BI-RADS classifications observed across all readers. These observations were similar to findings from several prior studies. Because tomosynthesis allows the radiologist to evaluate lesions more thoroughly by partially removing the tissues that are present above and below the plane of the lesion (and which are overlying structures with conventional mammography), the lesion margins can be more readily assessed. Also, by being able to assess the lesions using varying section thicknesses, the radiologist has the opportunity to understand the three-dimensional character of the lesion better with tomosynthesis. One study has shown that by using tomosynthesis, radiologists more accurately assessed tumor measurements and tumor outlines than when using standard mammography (18).
Previously, in a nonoverlapping retrospective side-by-side comparison of 25 patients with tissue-based lesions, Hakim et al (11) reported that tomosynthesis was subjectively preferred to additional views in 50% of the ratings. In a retrospective reader study that involved 125 cases with 35 cancers and eight readers, Gur et al (17) also found that radiologists, on average, had higher sensitivity and specificity when standard digital craniocaudal and mediolateral oblique images were interpreted with tomosynthesis versus when they used standard mammographic views alone. Finally, in a follow-up study that used the same data, Gur et al (19) performed a lesion-level detection-localization–based free-response ROC analysis that compared tomosynthesis and digital mammography against digital mammography alone, and found that radiologists achieved an average performance improvement of 16% (range, 5%–34%) when tomosynthesis was added (P < .01). Noroozian et al (12) published a retrospective review of 67 masses in which visibility, reader performance, and BI-RADS assessments for tomosynthesis were similar to those for supplemental diagnostic views. However, according to the authors’ report, that study may not have had sufficient power to demonstrate a difference between the modes. In another series of 52 patients recalled from screening for noncalcified lesions, both tomosynthesis and diagnostic views were performed and evaluated by two radiologists (20). That study reported 100% sensitivity for both techniques and higher specificity for tomosynthesis than for supplemental views (100% vs 94%). Several additional studies in the screening and diagnostic setting have shown that tomosynthesis is similar or superior to standard mammography for detecting breast cancer (6–8,10,16).
Our study had several limitations. First, it was retrospective, therefore the results may not completely translate to the clinical environment. In addition, the studies from which the data set was selected were designed for women aged 60 years or younger; hence, the age distribution in our study population is not representative of the entire screened population. Second, lesion location was marked for the readers, and so this was not a detection study but rather a classification study. Therefore, the results of this study cannot be construed to state that the use of tomosynthesis will increase cancer detection. We do not believe that our results were affected by the use of 12 cases from previous studies, which primarily involved detection tasks and were, for the most part, interpreted by other radiologists. For this study, an experimental tomosynthesis unit was used and continually refined over time, and it is possible that the results were biased in favor of additional views. Finally, all cases were collected from our practice with one vendor’s equipment and all readers were from our institution; therefore, our findings may not be as easily generalized as those from a multi-institutional study. Previously, it was reported that tomosynthesis was not superior to conventional craniocaudal and mediolateral oblique (not magnified) mammographic views in the detection and classification of calcifications (13); in the current study, we assessed only noncalcified lesions, therefore, the results cannot be extrapolated to assess calcified lesions. Because of these limitations, the results presented here may not be applicable to the entire population of diagnostic cases or different and perhaps more advanced tomosynthesis systems; hence, additional validation may be warranted.
In conclusion, tomosynthesis significantly improved diagnostic accuracy for noncalcified lesions compared with supplemental mammographic views. Our results suggest that practice patterns may be altered to allow for the replacement of conventional supplemental views with tomosynthesis images for assessment of these findings.
Advance in Knowledge.
• Radiologists’ use of digital breast tomosynthesis improves diagnostic accuracy for breast masses, asymmetries, and architectural distortion compared with standard supplemental diagnostic mammographic views: For eight radiologists and 217 lesions, the average probability-of-malignancy–based area under the ROC curve was 0.87 for tomosynthesis compared with 0.83 for supplemental views (P < .001).
Implication for Patient Care.
• Tomosynthesis can be used in place of conventional additional diagnostic views in the evaluation of findings that are not solely calcifications.
Disclosures of Conflicts of Interest: M.L.Z. Financial activities related to the present article: none to disclose. Financial activities not related to the present article: grant to institution from Hologic for further tomosynthesis study; travel expenses paid by Hologic to attend a scientific advisory meeting for digital mammography in 2011. Other relationships: none to disclose. A.I.B. Financial activities related to the present article: none to disclose. Financial activities not related to the present article: grant from Hologic for analysis of a prospective tomosynthesis screening study. Other relationships: none to disclose. M.A.G. No relevant conflicts of interest to disclose. J.H.S. Financial activities related to the present article: none to disclose. Financial activities not related to the present article: consultancies for Guidepoint Global, Morgan Stanley, and MEDACorp; provided expert testimonies for malpractice cases for Steven J. Forry, Stege & Michelson Co LPA, Moscarino & Treu LLP, and Comstock, Springer & Wilson Co LPA; received grant from Hologic; received payment for lectures from Educational Symposia, Postgraduate Institute for Medicine, Innova Health System, and the University of Florida; received travel, accommodations, and/or meeting expenses unrelated to listed activities from Suros. Other relationships: none to disclose. A.E.K. No relevant conflicts of interest to disclose. V.J.C. No relevant conflicts of interest to disclose. G.Y.R. No relevant conflicts of interest to disclose. A.H.L. No relevant conflicts of interest to disclose. D.G. No relevant conflicts of interest to disclose.
Acknowledgments
The authors thank Diane Wibner, Cyndee M. Sobran, BA, and Linda Lovy for their tireless assistance in the preparation of this work.
Received March 7, 2012; revision requested April 23; revision received May 30; accepted June 22; final version accepted July 17.
Supported in part by grant KG0803409 from the Susan G. Komen Foundation to the University of Pittsburgh.
Funding: This research was supported by the National Institutes of Health (grants CA 143019, CA 144055, and CA 163300).
Abbreviations:
- AUC
- area under the ROC curve
- BI-RADS
- Breast Imaging Reporting and Data System
- MQSA
- Mammography Quality Standards Act
- ROC
- receiver operating characteristic
References
- 1.Sickles EA, Wolverton DE, Dee KE. Performance parameters for screening and diagnostic mammography: specialist and general radiologists. Radiology 2002;224(3):861–869 [DOI] [PubMed] [Google Scholar]
- 2.BCSC website http://breastscreening.cancer.gov/data/benchmarks/screening/ Accessed 12/1/2012
- 3.Sickles EA, Miglioretti DL, Ballard-Barbash R, et al. Performance benchmarks for diagnostic mammography. Radiology 2005;235(3):775–790 [DOI] [PubMed] [Google Scholar]
- 4.Pisano ED, Gatsonis C, Hendrick E, et al. Diagnostic performance of digital versus film mammography for breast-cancer screening. N Engl J Med 2005;353(17):1773–1783 [DOI] [PubMed] [Google Scholar]
- 5.Good WF, Abrams GS, Catullo VJ, et al. Digital breast tomosynthesis: a pilot observer study. AJR Am J Roentgenol 2008;190(4):865–869 [DOI] [PubMed] [Google Scholar]
- 6.Gennaro G, Toledano A, di Maggio C, et al. Digital breast tomosynthesis versus digital mammography: a clinical performance study. Eur Radiol 2010;20(7):1545–1553 [DOI] [PubMed] [Google Scholar]
- 7.Andersson I, Ikeda DM, Zackrisson S, et al. Breast tomosynthesis and digital mammography: a comparison of breast cancer visibility and BIRADS classification in a population of cancers with subtle mammographic findings. Eur Radiol 2008;18(12):2817–2825 [DOI] [PubMed] [Google Scholar]
- 8.Teertstra HJ, Loo CE, van den Bosch MAAJ, et al. Breast tomosynthesis in clinical practice: initial results. Eur Radiol 2010;20(1):16–24 [DOI] [PubMed] [Google Scholar]
- 9.Gur D, Zuley ML, Anello MI, et al. Dose reduction in digital breast tomosynthesis (DBT) screening using synthetically reconstructed projection images: an observer performance study. Acad Radiol 2012;19(2):166–171 [DOI] [PMC free article] [PubMed] [Google Scholar]
- 10.Svahn T, Andersson I, Chakraborty D, et al. The diagnostic accuracy of dual-view digital mammography, single-view breast tomosynthesis and a dual-view combination of breast tomosynthesis and digital mammography in a free-response observer performance study. Radiat Prot Dosimetry 2010;139(1-3):113–117 [DOI] [PMC free article] [PubMed] [Google Scholar]
- 11.Hakim CM, Chough DM, Ganott MA, Sumkin JH, Zuley ML, Gur D. Digital breast tomosynthesis in the diagnostic environment: A subjective side-by-side review. AJR Am J Roentgenol 2010;195(2): W172–W176 [DOI] [PubMed] [Google Scholar]
- 12.Noroozian M, Hadjiiski L, Rahnama-Moghadam S, et al. Digital breast tomosynthesis is comparable to mammographic spot views for mass characterization. Radiology 2012;262(1):61–68 [DOI] [PMC free article] [PubMed] [Google Scholar]
- 13.Spangler ML, Zuley ML, Sumkin JH, et al. Detection and classification of calcifications on digital breast tomosynthesis and 2D digital mammography: a comparison. AJR Am J Roentgenol 2011;196(2):320–324 [DOI] [PubMed] [Google Scholar]
- 14.Zhou XH, Obuchowski NA, McClish DK. Statistical methods in diagnostic medicine. 2nd ed. Hoboken, NJ: Wiley, 2011 [Google Scholar]
- 15.Hillis SL, Schartz KM, Berbaum KS. OR/DBM MRMC 3.0 for SAS (computer software). http://perception.radiology.uiowa.edu. Accessed February 12, 2012
- 16.Poplack SP, Tosteson TD, Kogel CA, Nagy HM. Digital breast tomosynthesis: initial experience in 98 women with abnormal digital screening mammography. AJR Am J Roentgenol 2007;189(3):616–623 [DOI] [PubMed] [Google Scholar]
- 17.Gur D, Abrams GS, Chough DM, et al. Digital breast tomosynthesis: observer performance study. AJR Am J Roentgenol 2009;193(2):586–591 [DOI] [PubMed] [Google Scholar]
- 18.Förnvik D, Zackrisson S, Ljungberg O, et al. Breast tomosynthesis: Accuracy of tumor measurement compared with digital mammography and ultrasonography. Acta Radiol 2010;51(3):240–247 [DOI] [PubMed] [Google Scholar]
- 19.Gur D, Bandos AI, Rockette HE, et al. Localized detection and classification of abnormalities on FFDM and tomosynthesis examinations rated under an FROC paradigm. AJR Am J Roentgenol 2011;196(3):737–741 [DOI] [PubMed] [Google Scholar]
- 20.Tagliafico A, Astengo D, Cavagnetto F, et al. One-to-one comparison between digital spot compression view and digital breast tomosynthesis. Eur Radiol 2012;22(3):539–544 [DOI] [PubMed] [Google Scholar]


