

The high affinity of a cationic iodinated contrast agent for cartilage provides better tissue visualization, easier segmentation, higher contrast-to-noise ratios, and longer usable imaging windows and requires a lower dose of injected contrast agent compared with an anionic contrast agent.
Abstract
Purpose:
To quantify the affinity of a cationic computed tomography (CT) contrast agent (CA4+) and that of an anionic contrast agent (ioxaglate) to glycosaminoglycans (GAGs) in ex vivo cartilage tissue explants and to characterize the in vivo diffusion kinetics of CA4+ and ioxaglate in a rabbit model.
Materials and Methods:
All in vivo procedures were approved by the institutional animal care and use committee. The affinities of ioxaglate and CA4+ to GAGs in cartilage (six bovine osteochondral plugs) were quantified by means of a modified binding assay using micro-CT after plug equilibration in serial dilutions of each agent. The contrast agents were administered intraarticularly to the knee joints of five New Zealand white rabbits to determine the in vivo diffusion kinetics and cartilage tissue imaging capabilities. Kinetics of diffusion into the femoral groove cartilage and relative contrast agent uptake into bovine plugs were characterized by means of nonlinear mixed-effects models. Diffusion time constants (τ) were compared by using a Student t test.
Results:
The uptake of CA4+ in cartilage was consistently over 100% of the reservoir concentration, whereas it was only 59% for ioxaglate. In vivo, the contrast material–enhanced cartilage reached a steady CT attenuation for both CA4+ and ioxaglate, with τ values of 13.8 and 6.5 minutes, respectively (P = .04). The cartilage was easily distinguishable from the surrounding tissues for CA4+ (12 mg of iodine per milliliter); comparatively, the anionic contrast agent provided less favorable imaging results, even when a higher concentration was used (80 mg of iodine per milliliter).
Conclusion:
The affinity of the cationic contrast agent CA4+ to GAGs enables high-quality imaging and segmentation of ex vivo bovine and rabbit cartilage, as well as in vivo rabbit cartilage.
© RSNA, 2012
Supplemental material: http://radiology.rsna.org/lookup/suppl/doi:10.1148/radiol.12112246/-/DC1
Introduction
Medical imaging, be it magnetic resonance (MR) imaging, x-ray computed tomography (CT), ultrasonography (US), or positron emission tomography, continues to play a major role in the diagnosis and treatment of numerous disorders. Depending on the application and imaging modality, a contrast agent is used to enhance tissue differentiation, which is especially important for imaging soft tissues—like cartilage—with x-rays. Specifically, contrast material–enhanced CT is an emerging technique for imaging articular cartilage (1–10). In fact, minimally invasive imaging techniques that help quantify the biochemical and/or biomechanical health of articular cartilage (11) along with enabling morphologic assessment are of substantial interest as a means to detect and monitor osteoarthritis (12), a noninflammatory disease of the diarthrodial joints (13–16). Such imaging techniques are also needed because there is a lack of sensitive methods for evaluating the increasing number of small molecules, growth factors, and tissue engineering–based therapies entering preclinical and clinical studies for the treatment of damaged cartilage. In 2009, we reported the synthesis of new cationic iodinated CT contrast agents for imaging articular cartilage that were designed on the basis of favorable electrostatic interactions between negatively charged glycosaminoglycans (GAGs) and the positively charged contrast agent (1). Use of these agents to image individual ex vivo rabbit femurs with x-ray CT has shown that the greater cationic charge on the agents yields higher CT attenuation. Compared with typically used anionic contrast agents (ioxaglate, iothalamate) in cartilage CT imaging that are electrostatically repelled by the anionic GAGs, cationic contrast agents are highly taken up in cartilage (Fig 1). In our current study, we quantified the affinity of a cationic contrast agent (CA4+) to GAGs in ex vivo cartilage tissue explants and compared the results with those for an analogous commercially available anionic contrast agent (ioxaglate). Finally, we evaluated the performance of CA4+ and ioxaglate in an in vivo CT imaging study by using a rabbit model.
Figure 1:

Cationic and anionic CT contrast agents used in our study and their proposed electrostatic interactions with GAGs in articular cartilage. The electrostatic attraction between the negatively charged GAGs and the cationic agent affords greater contrast agent accumulation in cartilage, whereas the anionic agent is partially excluded from the cartilage. atten = Attenuation.
Materials and Methods
Preparation of Contrast Agent Solutions and Osteochondral Plug Samples
The cationic contrast agent was synthesized following our published procedure (H.L.) (1). CA4+ is structurally similar to the commercially available anionic iodinated contrast agent ioxaglate, the key distinction being that CA4+ bears four positive charges to ioxaglate’s one negative charge (Fig 1). Serial dilutions of CA4+ and ioxaglate (Hexabrix-320; Mallinckrodt, Hazelwood, Mo) in deionized water were prepared and adjusted to pH 7.4 and 420 mOsm/kg (Appendix E1 [online]).
Sixteen bovine osteochondral plugs (7 mm in diameter) were harvested from freshly slaughtered bovine femoral condyles according to a published procedure (10,17) (Appendix E1 [online]). Diffusion kinetics experiments were conducted to determine the immersion time required to achieve a steady state of contrast agent in the osteochondral plugs at room temperature prior to conducting the uptake experiments. For both CA4+ and ioxaglate, five plugs were immersed in contrast agent (16 mg of iodine per milliliter [mg I/mL]), with periodic micro-CT scanning over 20 hours.
Imaging Protocol for Uptake Experiment
Each of six adjacently harvested plugs were imaged before contrast agent immersion. Three plugs were randomly chosen to be immersed in either CA4+ or ioxaglate. The plugs were sequentially immersed in large reservoirs of serially diluted CA4+ or ioxaglate for 24 hours at room temperature. After each immersion, sequential axial images of the cartilage and underlying subchondral bone were acquired by using a micro-CT imaging system (microCT40; Scanco Medical, Brütisellen, Switzerland) at an isotropic voxel resolution of 36 µm3, 70-kVp tube voltage, and 113-µA current. The CT data sets were imported into Analyze (Mayo Clinic, Rochester, Minn), and the cartilage was segmented by using a semiautomatic contour-based segmentation algorithm (R.C.S.). The mean x-ray attenuation value (Hounsfield scale) for each plug was converted to contrast agent concentration (in milligrams of iodine per milliliter) by using a standard curve and was plotted as a function of reservoir concentration. To ensure uniformity of GAG content across the plugs, GAG content was quantified by using the 1,9-dimethylethylene blue colorimetric assay (10,17) (Appendix E1 [online]).
Imaging Protocols for ex Vivo and in Vivo Rabbit Knees
Five milliliters of CA4+ and ioxaglate at 12 mg I/mL were injected into contralateral intact ex vivo rabbit knees (Pel-Freez Biologics, Rogers, Ark). After 4 hours at room temperature, the joints were scanned by using the same imaging system and parameters as for the uptake experiment. Subsequently, the ioxaglate-infused joint was lavaged with saline, and ioxaglate (4 mL at 80 mg I/mL) was injected. The joint was scanned similarly after 4 hours. The CT data sets were rendered as two-dimensional color maps to show the relative contrast enhancement in each case.
All procedures were approved by the institutional animal care and use committee at Beth Israel Deaconess Medical Center. Five male New Zealand White rabbits (Millbrook Breeding Laboratories, Amherst, Mass) were anesthetized by means of intramuscular injection of ketamine and xylazine. The rabbits received isoflurane for the entire duration of the experiment. First, a baseline scan of one randomly selected knee was obtained by using a peripheral quantitative CT scanner (XCT Research SA+; Stratec Medizintechnik, Pforzheim, Germany). Each examination consisted of an axial section across the femoral groove, acquired at 100-mm in-plane resolution and section thickness, 50-kVp tube voltage, and 300-µA current. Next, 3 mL ioxaglate (80 mg I/mL) was administered to the knee joint through the suprapatellar recess in aseptic conditions (V.E.). Time-course scans were obtained by repeatedly scanning the selected section location; the scan time was approximately 10 minutes per section, with acquisition for 110 minutes after injection. Twenty-four hours after injection, each rabbit was anesthetized again, and a baseline scan was performed to confirm that there was no residual contrast agent. Subsequently, 3 mL of CA4+ (12 mg I/mL) was injected into the same knee by using a similar approach. Time-course scans were obtained in the same way they were with ioxaglate. The resulting CT data sets were imported into Analyze, and the femoral groove cartilage and the surrounding synovial joint space were manually segmented (P.N.B.). Mean cartilage x-ray attenuation values on the Hounsfield scale were obtained by averaging attenuation values over the entire segmented volume (Appendix E1 [online]).
Histologic Examination of in Vivo Rabbit Knees
After the animals were euthanized, the knee joints were harvested and visually inspected for signs of inflammation; the femoral groove was then sliced (V.E.). Hematoxylin-eosin–stained slides were evaluated with light microscopy for structural changes of articular cartilage and chondrocytes by using a semiquantitative score (18,19). Microscopic examination of synovium was also performed to assess synovial membrane cell hyperplasia, vascular dilatation, and inflammation semiquantitatively. The presence of synovial membrane necrosis and the composition of the inflammatory infiltrate were also noted (18–22). Joint fluid aspirates were processed by using SurePath (Becton-Dickinson/TriPath, Burlington, NC) and were cytologically evaluated by using a semiquantitative score. Histopathologic evaluations were performed by a pathologist (R.M.N.) who was blinded to the study protocol (Appendix E1 [online]).
Computational and Statistical Methods
Nonlinear mixed-effects models with maximum likelihood estimates of the regression parameters were used to fit the ioxaglate and CA4+ diffusion kinetics and relative uptake data (nlmefit routine, MATLAB R2011a; Mathworks, Natick, Mass). For each model parameter, a fixed effect (typical value) and a random effect (representative of interindividual variability) component were included; all model results are reported as fixed effect (typical value) ± standard error of the mean. Diffusion data were fit to a curve of the form A · [1 − exp (−t/τ)], where A is maximum percentage CT attenuation, t is diffusion time, and the τ value was calculated as the time required to reach 63.2% of the maximum CT attenuation (9). Relative uptake data were fit with a linear curve for ioxaglate and a Langmuir isotherm of the form (A · x)/(x + b), where A is the maximum contrast agent concentration in the cartilage, x is contrast agent reservoir concentration, and b is the reservoir concentration at which the cartilage internal concentration is at 50% of its maximum value (or EC50), for CA4+ (23). Student t tests were used to compare GAG contents and diffusion time constants (SPSS, version 17.0; SPSS, Chicago, Ill). In vivo contrast-to-noise ratio (CNR) was computed as the ratio between the image contrast between segmented cartilage regions and adjacent joint space regions and the image noise. For all analyses, P < .05 was considered to indicate a significant difference.
Results
The diffusion kinetics experiment in osteochondral plugs yielded τ values of 1.12 hours ± 0.20 and 1.74 hours ± 0.12 for ioxaglate and CA4+, respectively, which were statistically different (P = .02). Given the diffusion profiles (Fig 2), data for the uptake experiments were collected at 24 hours of immersion in reservoirs of CA4+ and ioxaglate.
Figure 2:

Graph of diffusion data shows mean contrast-enhanced CT attenuation in articular cartilage plugs as a percentage of contrast agent reservoir attenuation for plugs immersed in ioxaglate and CA4+ for 20 hours (n = 5 each). Ioxaglate and CA4+ data are modeled with nonlinear mixed-effects models with curves of the form A · [1 − exp (−t/τ)]. Solid lines = plug-specific fits (fixed plus random effects), dashed lines = typical diffusion behavior (fixed effects only). The time constants for CA4+ and ioxaglate were significantly different (P = .02). atten = Attenuation.
As shown in the mixed-effects contrast agent uptake models (Fig 3), ioxaglate tissue concentration increased linearly with ioxaglate reservoir concentration, with a slope of 0.59 ± 0.02. Conversely, CA4+ cartilage tissue concentration increased nonlinearly with CA4+ reservoir concentration, yielding an EC50 of 23.62 mg I/mL ± 2.10. At low reservoir concentrations, CA4+ uptake into the cartilage was approximately 400%–600% of the concentration in the surrounding reservoir. At higher reservoir concentrations, this uptake tapered off. In the uptake experiment, all six plugs were verified to have similar GAG contents (P = .98; Appendix E1 [online]).
Figure 3:

Graph shows contrast agent concentration inside articular cartilage plugs as a function of contrast agent reservoir concentration for plugs immersed in ioxaglate and CA4+ (n = 3 each). Mixed-effects models for ioxaglate and CA4+ data are fitted with a linear and a nonlinear curve, respectively. Solid lines = plug-specific fits (fixed plus random effects), dashed lines = typical uptake behavior (fixed effects only). EC50 = reservoir concentration at which the cartilage internal concentration is at 50% of its maximum value.
In the color maps showing intact ex vivo rabbit knees injected with either 12 mg I/mL CA4+ or ioxaglate (Fig 4, A, B), only CA4+ produced clear attenuation differentiation between soft tissues, cartilage, and the underlying subchondral bone. This concentration of ioxaglate did not yield sufficient cartilage signal to distinguish it from the surrounding soft tissue (Fig 4, B), but the second injection of ioxaglate at 80 mg I/mL did allow the cartilage to be more clearly seen as a low-attenuation space between the highly attenuating ioxaglate pooled in the joint space and the underlying subchondral bone (Fig 4, C).
Figure 4:

A–C, Contrast-enhanced CT color maps in intact ex vivo rabbit knee joint 4 hours after injection with, A, CA4+ at 12 mg I/mL, B, ioxaglate at 12 mg I/mL, and, C, ioxaglate at 80 mg I/mL. In A, increasing attenuation from the femoral groove cartilage surface to the deep zone is evident, as is the clear interface between cartilage and subchondral bone. Note the lack of attenuation from the femoral groove cartilage in B. In C, the cartilage can be seen as a low-attenuation space between the highly attenuating contrast agent pooled in the joint space and the underlying bone.
In the in vivo imaging study, ioxaglate (80 mg I/mL) diffused into the femoral groove cartilage tissue, with the contrast-enhanced CT attenuation of the femoral groove cartilage increasing to a maximum value of 1554 HU ± 102 in the first 40 minutes after contrast agent injection (Fig 5). The τ value was 6.5 minutes ± 1.0. At the end of the scanning period, about 69% of the contrast agent had diffused out of the joint space. The contrast-enhanced CT images (Fig 5, bottom) reflected the diffusion profile of the anionic contrast agent into the femoral groove cartilage. The ioxaglate solution appeared as a highly attenuating (blue-green) region in the joint space, which decreased in attenuation over the scanning period. The cartilage was visible as a lower-attenuation space between the ioxaglate solution and the subchondral bone.
Figure 5:

Top: Graph shows change in contrast-enhanced CT (CECT) attenuation (atten) (in Hounsfield units) of the femoral groove cartilage and the contrast agent in the joint space as a function of time (in minutes) after injection for the anionic contrast agent (ioxaglate). The diffusion data were modeled by using mixed-effects modeling. Solid lines = subject-specific fits (fixed plus random effects), heavy dashed line = typical diffusion behavior (fixed effects only), light dashed lines = contrast agent dilution in and diffusion out of the joint spaces over time. Bottom: Representative time-series contrast-enhanced CT images for a knee injected with ioxaglate. With increasing time, there is an increase in the intensity in the femoral groove cartilage and a corresponding decrease in the dark blue color in the synovial joint space above the femoral groove cartilage. The intense blue color above the femoral groove cartilage is noteworthy, indicating the high concentration of the contrast agent used. Color map scale = x-ray attenuation values in Hounsfield units for cartilage and bone.
The CA4+ (12 mg I/mL) also diffused into and enabled imaging of the femoral groove cartilage tissue; the contrast-enhanced CT attenuation of the femoral groove cartilage increased to a maximum attenuation of 1410 HU ± 86, and a τ value of 13.8 minutes ± 2.5 was determined from the diffusion data (Fig 6). The diffusion time constant (τ) was statistically different between ioxaglate and CA4+ (P = .04). For CA4+, the contrast-enhanced CT attenuation started to plateau after 40 minutes and increased only a few percentage points thereafter before leveling off. Representative contrast-enhanced CT color map images (Fig 6, bottom) show the diffusion profile of the cationic contrast agent into the femoral groove cartilage. The contrast agent penetration increased with time, as indicated by the increase in attenuation (blue color). The CT attenuation of the cationic contrast agent in the joint space continuously decreased until the end of the scanning period. The concentration in the joint space decreased by approximately 70% in the first 20–25 minutes and then slowly decreased over the remaining time. At the end of the scanning period, about 90% of the contrast agent had diffused out of the joint space, with the cartilage tissue still clearly visible.
Figure 6:

Top: Graph shows change in contrast-enhanced CT (CECT) attenuation of the femoral groove cartilage and the contrast agent in the joint space as a function of time (in minutes) after injection for the cationic contrast agent (CA4+). The diffusion data were modeled by using mixed-effects modeling. Solid lines = subject-specific fits (fixed plus random effects), heavy dashed line = typical diffusion behavior (fixed effects only), light dashed lines = contrast agent dilution in and diffusion out of the joint spaces over time. Bottom: Representative time-series contrast-enhanced CT images for one knee injected with the cationic contrast agent (CA4+). With increasing time, there is an increase in the intensity in the femoral groove cartilage, as indicated by the increase in the blue color. If observed closely, there is also a corresponding decrease in the green-yellow color with time in the synovial joint space above the femoral groove cartilage. This intensity is very low because of the low concentration of the contrast agent used. Color map scale = x-ray attenuation values in Hounsfield units for cartilage and bone.
Representative color map images of peripheral quantitative CT data from the femoral groove in the same knee injected with CA4+ or ioxaglate at 60 minutes after injection provided a closer comparison between the agents. For ioxaglate, the high-concentration contrast agent solution appeared as a highly attenuating region in the joint space (Fig 7, top), whereas the femoral groove cartilage appeared as a lower-attenuation region between the pooled contrast agent and the underlying bone. For CA4+ (Fig 7, bottom) the cartilage was more easily distinguished from the surrounding joint space and was clearly distinguishable from the underlying bone. The CNR for ioxaglate and CA4+ was plotted as a function of diffusion time (Fig 8). For ioxaglate, CNR was highest immediately after contrast agent injection, and CNR decreased as the contrast agent penetrated into the cartilage. Conversely, for CA4+, the CNR increased with time.
Figure 7:
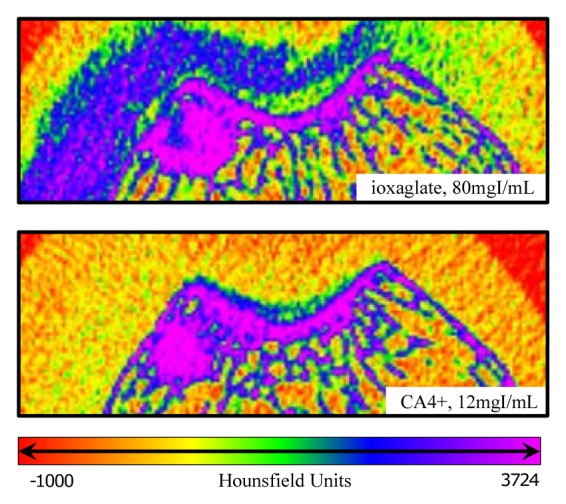
Enlarged contrast-enhanced CT images of an in vivo rabbit knee injected with (top) CA4+ at 12 mg I/mL and (bottom) ioxaglate at 80 mg I/mL. Both images are from the same knee and were captured 1 hour after injection. For ioxaglate (top), the exclusion of ioxaglate from the femoral groove cartilage (relative to the injected contrast agent in the joint space) appears as a region of lower attenuation between the bright blue-purple subchondral bone and the blue ioxaglate solution pooled in the joint space. For CA4+ (bottom), the cartilage is highlighted in green-blue, having attained a much higher tissue CA4+ concentration than the surrounding solution in the joint space, which is itself indistinguishable from the surrounding soft tissue.
Figure 8:

Graph shows CNRs for ioxaglate and CA4+ in femoral groove cartilage as a function of time (in minutes) after injection in five rabbit knees. For ioxaglate, CNR decreases rapidly with time, whereas CNR increases with time for CA4+, providing a longer imaging window with good contrast enhancement.
Both contrast agents were cleared from the joint by 24 hours, as determined at CT imaging, and we observed no gross inflammation or swelling of the knee after injection of CA4+ or ioxaglate. No animals exhibited any obvious pain or atypical cage behavior indicative of an adverse reaction to the experimental protocol. At histopathologic examination, the articular cartilage structure and chondrocytes showed no or modest changes, and an intact tide mark was observed in all cases. Synovial membrane evaluation for hyperplasia and inflammation also revealed no or modest histologic changes, with absence of vascular dilatation. Lack of acute toxicity was further supported by the absence of neutrophils in synovial fluid cytopreparations (Appendix E1 [online]).
Discussion
Although electrostatic interactions are relatively weak, we hypothesized that sufficient attraction between CA4+ and GAGs in cartilage could be attained to produce a beneficial in vivo imaging outcome. Accordingly, we first determined the affinities of CA4+ and ioxaglate, which have the same number of iodine atoms and similar structures, to GAGs within cartilage tissue samples. This experiment was performed in a manner similar to that in classic protein binding studies in which the binding of a radioactive small molecule to a protein is determined. However, in our experiment we utilized a micro-CT scanner along with a standard curve to measure the concentrations of the iodinated contrast agent present with the GAGs. Specifically, the affinity of the contrast agents to GAGs in ex vivo osteochondral plugs was determined in serial contrast agent concentration immersions. The data showed ioxaglate being partially (41%) excluded from the tissue matrix, owing to electrostatic repulsion, which leads to less contrast agent being present in the tissue compared with the reservoir. On the other hand, CA4+ demonstrated an affinity to the anionic GAGs in cartilage, which resulted in enhanced uptake of CA4+ into the cartilage (up to six times compared with the reservoir).
The partitioning of freely mobile charged species within a matrix containing immobile charges can be characterized by the Donnan equilibrium. In this model, the fixed negative charge of cartilage enhances or diminishes uptake (or partitioning) of a positively charged or negatively charged contrast agent, respectively. If the affinity is sufficiently strong because of a collection of electrostatic and other noncovalent interactions, there is the additional possibility of binding between the contrast agent and the GAGs. For example, previous studies with singly charged ions (Na+) and cartilage explants have shown that the interaction with GAGs can be described by Donnan partitioning (24,25), whereas the binding of multicharged peptides to GAG can be governed by binding and/or Donnan partitioning, depending on the specific composition being investigated (23,26,27). Mechanistic studies, including competitive binding experiments, are planned by the authors to elucidate the mechanism behind the observed affinity of the contrast agent for GAG.
Micro-CT imaging of ex vivo intact rabbit knees by using CA4+ and ioxaglate revealed that a relatively low concentration (12 mg I/mL) of CA4+ and a higher concentration (80 mg I/mL) of ioxaglate could be used to visualize the cartilage, and thus these contrast agent concentrations were selected for the in vivo study. In vivo, the diffusion profile for ioxaglate highlights a characteristic challenge with the use of anionic contrast agents for cartilage imaging. Because ioxaglate is partially excluded from cartilage, high concentrations are needed, and the tissue appears as a low-attenuating space on the CT image. Over time, as the higher-attenuating ioxaglate diffuses out of the joint space, the CT attenuations of cartilage and the surrounding joint space converge, impairing the ability to differentiate the boundary. With CA4+, on the other hand, a low concentration (6.7 times lower than that of ioxaglate) is highly taken up into the tissue (attenuation increases), while CA4+ diffuses out of the joint space, which results in good distinction between cartilage, surrounding joint space, and bone. This is advantageous from a segmentation standpoint and highlights the improved CNR over longer imaging windows provided by a contrast agent, like CA4+, with an affinity to GAGs in cartilage. Additionally, improved CNR may provide better opportunities for quantitative GAG imaging in addition to visual morphologic assessment, as shown here. In support of this hypothesis, we have recently reported GAG quantification in ex vivo cartilage tissue samples using contrast-enhanced CT and the CA4+ contrast agent (17). The histopathologic findings revealed no to modest changes with contrast agent administration and were similar to those described for well-tolerated contrast media using these techniques (22).
Although this study quantified the higher affinity of a cationic iodinated contrast agent compared with an anionic contrast agent for cartilage and, to our knowledge, demonstrated the first in vivo imaging with CA4+, there were several limitations to our study, as well as additional experiments to be performed. First, in our study we evaluated only healthy cartilage tissue. Going forward, it is critical to explore the capacity of contrast-enhanced CT with CA4+ to depict changes associated with osteoarthritis in a trauma- or drug-induced model with animals. Another limitation of our study was the inability of the peripheral quantitative CT scanner to capture sufficient images to create volumetric reconstructions within a short time frame. Also, different cartilage surfaces within a joint will vary in thickness and extracellular matrix component proportions, which may also affect contrast agent uptake and diffusion kinetics. Finally, additional safety and pharmacokinetic studies must be performed prior to any future clinical use.
In summary, the high affinity of a cationic iodinated contrast agent for cartilage provides better tissue visualization, easier segmentation, higher CNR, and a longer usable imaging window and requires a lower dose of injected contrast agent compared with an anionic contrast agent. These attributes translate to high-quality in vivo imaging with contrast-enhanced CT in a rabbit model. Hence, this method complements other imaging modalities being explored for cartilage imaging, including MR imaging (19,28–33), US (34,35), fluorescence (36), and optical coherence tomography (37–39). With regard to tissue-specific CT contrast agents (40–44), the results here provide further guidance for optimization of the contrast agent for characterizing cartilage in vivo. In addition, this technique may be useful for assessment in longitudinal animal models of cartilage degeneration, where destructive techniques are most often used for biochemical analysis. The development of a sensitive, minimally invasive cartilage imaging technique that allows assessment of cartilage thickness, morphology, equilibrium compressive modulus, and GAG content will aid in the diagnosis, treatment, and monitoring of osteoarthritis. Hence, the development and evaluation of new imaging techniques, image processing routines, instrumentation, and contrast agents should be encouraged.
Advances in Knowledge.
• A cationic CT contrast agent (CA4+) has a greater affinity to cartilage than an anionic contrast agent (ioxaglate) in ex vivo bovine cartilage plugs, in intact ex vivo rabbit knees, and in an in vivo rabbit model.
• High-quality contrast-enhanced in vivo CT images of cartilage can be obtained with facile segmentation from the synovial space and bone by using a cationic contrast agent.
• Use of a cationic contrast agent enables CT imaging of ex vivo and in vivo cartilage at lower concentrations than use of an anionic contrast agent.
• The concentration of the cationic contrast agent remains relatively constant for 80 minutes in in vivo cartilage tissue after intraarticular injection.
Implications for Patient Care.
• High-quality contrast-enhanced CT images of cartilage can potentially be obtained by using a low dose of a multiply charged cationic iodinated contrast agent.
• Development of sensitive imaging methods for quantifying cartilage thickness, morphology, glycosaminoglycan content, and equilibrium compressive modulus may enable earlier detection, monitoring, and treatment of osteoarthritis.
Disclosures of Conflicts of Interest: R.C.S. No relevant conflicts of interest to disclose. P.N.B. No relevant conflicts of interest to disclose. V.E. No relevant conflicts of interest to disclose. H.L. No relevant conflicts of interest to disclose. R.M.N. No relevant conflicts of interest to disclose. B.D.S. No relevant conflicts of interest to disclose. M.W.G. No relevant conflicts of interest to disclose.
Supplementary Material
Acknowledgments
We thank the staff of the Beth Israel Deaconess Medical Center animal facility for their support during the in vivo rabbit experiment, as well as the staff of the Massachusetts General Hospital Cytopathology Laboratory for their pathology contributions.
Received November 5, 2011; revision requested January 23; revision received June 5; accepted July 11; final version accepted July 26.
Supported by the Coulter Foundation and Boston University. R.C.S. supported by the Henry Luce Foundation.
Funding: This research was supported by the National Institutes of Health (grant R01GM098361).
Abbreviations:
- CNR
- contrast-to-noise ratio
- GAG
- glycosaminoglycan
References
- 1.Joshi NS, Bansal PN, Stewart RC, Snyder BD, Grinstaff MW. Effect of contrast agent charge on visualization of articular cartilage using computed tomography: exploiting electrostatic interactions for improved sensitivity. J Am Chem Soc 2009;131(37):13234–13235 [DOI] [PubMed] [Google Scholar]
- 2.Xie L, Lin AS, Levenston ME, Guldberg RE. Quantitative assessment of articular cartilage morphology via EPIC-microCT. Osteoarthritis Cartilage 2009;17(3):313–320 [DOI] [PMC free article] [PubMed] [Google Scholar]
- 3.Kallioniemi AS, Jurvelin JS, Nieminen MT, Lammi MJ, Töyräs J. Contrast agent enhanced pQCT of articular cartilage. Phys Med Biol 2007;52(4):1209–1219 [DOI] [PubMed] [Google Scholar]
- 4.Silvast TS, Jurvelin JS, Lammi MJ, Töyräs J. pQCT study on diffusion and equilibrium distribution of iodinated anionic contrast agent in human articular cartilage: associations to matrix composition and integrity. Osteoarthritis Cartilage 2009;17(1):26–32 [DOI] [PubMed] [Google Scholar]
- 5.Piscaer TM, Waarsing JH, Kops N, et al. In vivo imaging of cartilage degeneration using microCT-arthrography. Osteoarthritis Cartilage 2008;16(9):1011–1017 [DOI] [PubMed] [Google Scholar]
- 6.Xie L, Lin AS, Guldberg RE, Levenston ME. Nondestructive assessment of sGAG content and distribution in normal and degraded rat articular cartilage via EPIC-microCT. Osteoarthritis Cartilage 2010;18(1):65–72 [DOI] [PMC free article] [PubMed] [Google Scholar]
- 7.Cockman MD, Blanton CA, Chmielewski PA, et al. Quantitative imaging of proteoglycan in cartilage using a gadolinium probe and microCT. Osteoarthritis Cartilage 2006;14(3):210–214 [DOI] [PubMed] [Google Scholar]
- 8.Silvast TS, Jurvelin JS, Aula AS, Lammi MJ, Töyräs J. Contrast agent-enhanced computed tomography of articular cartilage: association with tissue composition and properties. Acta Radiol 2009;50(1):78–85 [DOI] [PubMed] [Google Scholar]
- 9.Palmer AW, Guldberg RE, Levenston ME. Analysis of cartilage matrix fixed charge density and three-dimensional morphology via contrast-enhanced microcomputed tomography. Proc Natl Acad Sci U S A 2006;103(51):19255–19260 [DOI] [PMC free article] [PubMed] [Google Scholar]
- 10.Bansal PN, Joshi NS, Entezari V, Grinstaff MW, Snyder BD. Contrast enhanced computed tomography can predict the glycosaminoglycan content and biomechanical properties of articular cartilage. Osteoarthritis Cartilage 2010;18(2):184–191 [DOI] [PubMed] [Google Scholar]
- 11.Ateshian G, Eckstein F. Quantitative anatomy and imaging of diarthridial joint articular layers. In: Mow VC, Huiskes R, eds. Basic orthopaedic biomechanics and mechano-biology. 3rd ed Philadelphia, Pa: Lippincott Williams & Wilkins, 2005; 401–447 [Google Scholar]
- 12.Brandt KD. Pain, synovitis, and articular cartilage changes in osteoarthritis. Semin Arthritis Rheum 1989;18(4 Suppl 2):77–80 [DOI] [PubMed] [Google Scholar]
- 13.Felson DT, Lawrence RC, Dieppe PA, et al. Osteoarthritis: new insights. I. The disease and its risk factors. Ann Intern Med 2000;133(8):635–646 [DOI] [PubMed] [Google Scholar]
- 14.Read SJ, Dray A. Osteoarthritic pain: a review of current, theoretical and emerging therapeutics. Expert Opin Investig Drugs 2008;17(5):619–640 [DOI] [PubMed] [Google Scholar]
- 15.Goldring SR. Needs and opportunities in the assessment and treatment of osteoarthritis of the knee and hip: the view of the rheumatologist. J Bone Joint Surg Am 2009;91(Suppl 1):4–6 [DOI] [PubMed] [Google Scholar]
- 16.Block JA, Shakoor N. The biomechanics of osteoarthritis: implications for therapy. Curr Rheumatol Rep 2009;11(1):15–22 [DOI] [PubMed] [Google Scholar]
- 17.Bansal PN, Joshi NS, Entezari V, et al. Cationic contrast agents improve quantification of glycosaminoglycan (GAG) content by contrast enhanced CT imaging of cartilage. J Orthop Res 2011;29(5):704–709 [DOI] [PubMed] [Google Scholar]
- 18.Mankin HJ, Dorfman H, Lippiello L, Zarins A. Biochemical and metabolic abnormalities in articular cartilage from osteo-arthritic human hips. II. Correlation of morphology with biochemical and metabolic data. J Bone Joint Surg Am 1971;53(3):523–537 [PubMed] [Google Scholar]
- 19.Winalski CS, Shortkroff S, Schneider E, Yoshioka H, Mulkern RV, Rosen GM. Targeted dendrimer-based contrast agents for articular cartilage assessment by MR imaging. Osteoarthritis Cartilage 2008;16(7):815–822 [DOI] [PubMed] [Google Scholar]
- 20.Dogan N, Erdem AF, Erman Z, Kizilkaya M. The effects of bupivacaine and neostigmine on articular cartilage and synovium in the rabbit knee joint. J Int Med Res 2004;32(5):513–519 [DOI] [PubMed] [Google Scholar]
- 21.Lindblad S, Wredmark T. Traumatic synovitis analysed by arthroscopy and immunohistopathology. Br J Rheumatol 1990;29(6):422–425 [DOI] [PubMed] [Google Scholar]
- 22.Papacharalampous X, Patsouris E, Mundinger A, et al. The effect of contrast media on the synovial membrane. Eur J Radiol 2005;55(3):426–430 [DOI] [PubMed] [Google Scholar]
- 23.Garcia AM, Szasz N, Trippel SB, Morales TI, Grodzinsky AJ, Frank EH. Transport and binding of insulin-like growth factor I through articular cartilage. Arch Biochem Biophys 2003;415(1):69–79 [DOI] [PubMed] [Google Scholar]
- 24.Maroudas A. Distribution and diffusion of solutes in articular cartilage. Biophys J 1970;10(5):365–379 [DOI] [PMC free article] [PubMed] [Google Scholar]
- 25.Maroudas A, Evans H. A study of ionic equilibria in cartilage. Connect Tissue Res 1972;1(1):69–77 [Google Scholar]
- 26.Byun S, Tortorella MD, Malfait AM, Fok K, Frank EH, Grodzinsky AJ. Transport and equilibrium uptake of a peptide inhibitor of PACE4 into articular cartilage is dominated by electrostatic interactions. Arch Biochem Biophys 2010;499(1-2):32–39 [DOI] [PMC free article] [PubMed] [Google Scholar]
- 27.Hunter GK, Wong KS, Kim JJ. Binding of calcium to glycosaminoglycans: an equilibrium dialysis study. Arch Biochem Biophys 1988;260(1):161–167 [DOI] [PubMed] [Google Scholar]
- 28.Bacic G, Liu KJ, Goda F, Hoopes PJ, Rosen GM, Swartz HM. MRI contrast enhanced study of cartilage proteoglycan degradation in the rabbit knee. Magn Reson Med 1997;37(5):764–768 [DOI] [PubMed] [Google Scholar]
- 29.Bashir A, Gray ML, Burstein D. Gd-DTPA2- as a measure of cartilage degradation. Magn Reson Med 1996;36(5):665–673 [DOI] [PubMed] [Google Scholar]
- 30.Trattnig S, Winalski CS, Marlovits S, Jurvelin JS, Welsch GH, Potter HG. Magnetic resonance imaging of cartilage repair: a review. Cartilage 2011;2(1):5–26 [DOI] [PMC free article] [PubMed] [Google Scholar]
- 31.Wheaton AJ, Borthakur A, Kneeland JB, Regatte RR, Akella SV, Reddy R. In vivo quantification of T1rho using a multislice spin-lock pulse sequence. Magn Reson Med 2004;52(6):1453–1458 [DOI] [PubMed] [Google Scholar]
- 32.Taylor C, Carballido-Gamio J, Majumdar S, Li X. Comparison of quantitative imaging of cartilage for osteoarthritis: T2, T1rho, dGEMRIC and contrast-enhanced computed tomography. Magn Reson Imaging 2009;27(6):779–784 [DOI] [PMC free article] [PubMed] [Google Scholar]
- 33.Roemer FW, Crema MD, Trattnig S, Guermazi A. Advances in imaging of osteoarthritis and cartilage. Radiology 2011;260(2):332–354 [DOI] [PubMed] [Google Scholar]
- 34.Keen HI, Wakefield RJ, Conaghan PG. A systematic review of ultrasonography in osteoarthritis. Ann Rheum Dis 2009;68(5):611–619 [DOI] [PubMed] [Google Scholar]
- 35.Joshua F, Edmonds J, Lassere M. Power Doppler ultrasound in musculoskeletal disease: a systematic review. Semin Arthritis Rheum 2006;36(2):99–108 [DOI] [PubMed] [Google Scholar]
- 36.Yin M, Shen J, Pflugfelder GO, Müllen K. A fluorescent core-shell dendritic macromolecule specifically stains the extracellular matrix. J Am Chem Soc 2008;130(25):7806–7807 [DOI] [PubMed] [Google Scholar]
- 37.Bear DM, Williams A, Chu CT, Coyle CH, Chu CR. Optical coherence tomography grading correlates with MRI T2 mapping and extracellular matrix content. J Orthop Res 2010;28(4):546–552 [DOI] [PMC free article] [PubMed] [Google Scholar]
- 38.Herrmann JM, Pitris C, Bouma BE, et al. High resolution imaging of normal and osteoarthritic cartilage with optical coherence tomography. J Rheumatol 1999;26(3):627–635 [PubMed] [Google Scholar]
- 39.Pan Y, Li Z, Xie T, Chu CR. Hand-held arthroscopic optical coherence tomography for in vivo high-resolution imaging of articular cartilage. J Biomed Opt 2003;8(4):648–654 [DOI] [PubMed] [Google Scholar]
- 40.Popovtzer R, Agrawal A, Kotov NA, et al. Targeted gold nanoparticles enable molecular CT imaging of cancer. Nano Lett 2008;8(12):4593–4596 [DOI] [PMC free article] [PubMed] [Google Scholar]
- 41.Kim D, Jeong YY, Jon S. A drug-loaded aptamer-gold nanoparticle bioconjugate for combined CT imaging and therapy of prostate cancer. ACS Nano 2010;4(7):3689–3696 [DOI] [PubMed] [Google Scholar]
- 42.Parkesh R, Gowin W, Lee TC, Gunnlaugsson T. Synthesis and evaluation of potential CT (computer tomography) contrast agents for bone structure and microdamage analysis. Org Biomol Chem 2006;4(19):3611–3617 [DOI] [PubMed] [Google Scholar]
- 43.Parkesh R, Clive Lee T, Gunnlaugsson T, Gowin W. Microdamage in bone: surface analysis and radiological detection. J Biomech 2006;39(8):1552–1556 [DOI] [PubMed] [Google Scholar]
- 44.Eck W, Nicholson AI, Zentgraf H, Semmler W, Bartling S. Anti-CD4-targeted gold nanoparticles induce specific contrast enhancement of peripheral lymph nodes in X-ray computed tomography of live mice. Nano Lett 2010;10(7):2318–2322 [DOI] [PubMed] [Google Scholar]
Associated Data
This section collects any data citations, data availability statements, or supplementary materials included in this article.