

Abstract
A simple form of presynaptic plasticity, paired-pulse facilitation (PPF), has been explained as a transient increase in the probability of vesicular release. Using the whole-cell patch-clamp technique to record synaptic activity in rat cerebellar slices, we found different forms of presynaptically originated short-term plasticity during glutamatergic excitatory neurotransmission from granule cells (GCs) to molecular-layer interneurones (INs). Paired-pulse activation of GC axons at short intervals (30–100 ms) elicited not only a facilitation in the peak amplitude (PPFamp), but also a prolongation in the decay-time constant (PPPdecay) of the EPSCs recorded from INs. The results of pharmacological tests and kinetics analyses suggest that the mechanisms underlying the respective types of short-term plasticity were different. PPFamp was elicited by a transient increase in the number of released vesicles. On the other hand, PPPdecay was caused not only by delayed release as has been reported but also by extrasynaptic spillover of the GC transmitter and the subsequent intersynaptic pooling. Both PPFamp and PPPdecay closely rely on repetitive-activation-induced multivesicular release. Using a dynamic clamp technique, we further examined the physiological significance of different presynaptic plasticity, and found that PPFamp and PPPdecay can differentially encode and process neuronal information by influencing the total synaptic charge transferred to postsynaptic INs to reflect activation frequency of the presynaptic GCs.
Key points
Paired-pulse facilitation (PPF) is a widely observed form of presynaptically originated short-term plasticity.
Here, we report that, in rat cerebellar cortex, paired-pulse activation of glutamatergic granule cell axon fibres causes not only a facilitation in the peak amplitude (PPFamp) but also a prolongation in the decay-time constant (PPPdecay) of the EPSCs recorded from molecular-layer interneurones (INs).
PPFamp is elicited, in part, by an increase in the number of released vesicles (that is, multivesicular release), whereas PPPdecay results from extrasynaptic spillover of the transmitter glutamate and its intersynaptic pooling among active synapses, as well as from delayed release as has been explained.
PPFamp and PPPdecay play unique roles in determining excitability of the INs.
These findings help us understand the mechanisms underlying encoding and processing of the neuronal information in the cerebellar cortex.
Introduction
Dynamic properties of synaptic transmission have been assessed in detail with a paired-pulse protocol, in which two repetitive stimulations are applied at a short interval of tens of milliseconds. A simple form of presynaptically originated short-term plasticity, paired-pulse facilitation (PPF), is generally explained as a transient increase in the probability of vesicular release resulting from a prior accumulation of residual Ca2+ at the synaptic terminal and a lingering effect of Ca2+ on the exocytotic Ca2+ sensor of releasable vesicles during the second stimulus (as reviewed in Thomson, 2000; Zucker & Regehr, 2002; Neher & Sakaba, 2008).
In addition, the number of synaptic vesicles available for fast release also plays a role in determining the strength of postsynaptic response (Zucker & Regehr, 2002). For example, if the releasable vesicles are depleted during a train of high-frequency presynaptic stimulation, synaptic responses will be depressed. On the other hand, if an abundant fraction of releasable vesicles is left after a single stimulation, synaptic responses to subsequent stimulation will be facilitated due to accumulation of residual Ca2+ at the release site. The evoked quantal output of a single terminal is usually restricted to one vesicle per presynaptic action potential, whereas concomitant release of multiple vesicles per action potential is observed in some excitatory and inhibitory synapses (Stevens & Wang, 1995; Auger et al. 1998; Wall & Usowicz, 1998; Wadiche & Jahr, 2001). It remains, however, uncertain whether changes in the number of vesicles released at a single synapse or the timing of the vesicular release influence the aspect of PPF.
Here, using the whole-cell recording technique on rat cerebellar slices, we examined excitatory synaptic transmission from the ascending fibres of granule cells (GCs) to the molecular-layer interneurones (INs). We found that paired-pulse activation of the GC fibres at short intervals (30–100 ms) elicits not only a facilitation of the peak amplitude (PPFamp), but also a prolongation of the decay-time (PPPdecay) of the EPSCs. The results of pharmacological tests, and kinetics and simulation analyses suggest that: (1) PPFamp was caused by a transient increase in the number of released vesicles at the peak phase of the EPSC; and that (2) PPPdecay was elicited by extrasynaptic spillover of the GC transmitter glutamate and the subsequent intersynaptic pooling of glutamate among adjacent active GC–IN synapses, as well as by delayed release of the GC transmitter as has been described (Atluri & Regehr, 1998; Chen & Regehr, 1999). In addition, using a dynamic clamp technique (Sharp et al. 1993), we evaluated the physiological significance of PPPdecay by monitoring the effects of EPSC decay prolongation on the excitability of INs. Our results indicate that presynaptically originated PPFamp and PPPdecay differently encode and process neuronal information by influencing the total synaptic charge transferred to postsynaptic neurones; especially, PPPdecay plays a significant role when GC–IN synapses transmit burst-like signals.
Methods
All experiments were carried out in accordance with institutional guidelines for animal experiments, and were approved by The Institutional Animal Care and Use Committee of the National Institutes of Natural Sciences.
Preparation of cerebellar slices
Parasagittal cerebellar slices (250 μm thick) were prepared from Wistar rats (12–21 days old, total of 84 rats), which were decapitated after deep anaesthetization with halothane, with a vibratome (VT1000S; Leica Microsystems, Wetzlar, Germany) in iced Na+-deficient saline that contained (in mm): sucrose, 300; KCl, 3.4; CaCl2, 0.3; MgCl2, 3.0; Hepes, 10; NaH2PO4, 0.6; glucose, 10.0 (the saline was equilibrated with 100% O2, pH adjusted to 7.4 with NaOH at room temperature). After incubation at room temperature for at least 1 h with an artificial cerebrospinal fluid (ACSF) that contained (in mm): NaCl, 138.6; KCl, 3.35; CaCl2, 2.5; MgCl2, 1.0; NaHCO3, 21.0; NaH2PO4, 0.6; glucose, 10.0 (the ACSF was equilibrated with 95% O2 and 5% CO2 to maintain a pH of 7.4 at room temperature), the slices were transferred to a recording chamber mounted on a microscope stage (BX51WI; Olympus, Tokyo, Japan), where they were continuously superfused with ACSF. The flow rate was 0.8–1.5 ml min−1 and experiments were carried out at room temperature (24–27°C) unless otherwise stated.
Recording of postsynaptic currents
We used the whole-cell voltage-clamp technique (Satake et al. 2000) to record synaptic responses from visually identified INs or Purkinje cells (PCs) under Normarski optics with a water-immersion objective (63×, NA 0.90; Olympus). Patch-clamp electrodes (resistance: 3–6 MΩ) were filled with an internal solution that contained (in mm): caesium methanesulphonate, 150.0; KCl, 5.0; EGTA, 0.1; Hepes, 5.0; Mg-ATP, 3.0; Na3-GTP, 0.4; the pH was adjusted to 7.4. Membrane potential was held at −80 and −30 mV to record EPSCs and inhibitory postsynaptic currents (IPSCs), respectively, through a voltage-clamp amplifier (EPC-10; HEKA Elektronik, Lambrecht, Germany), using ‘PULSE’ software (HEKA Elektronik). The current signals were filtered at 3 kHz and digitized at 10–50 kHz (mostly, 20 kHz). The series resistance and leak currents were monitored continuously and, when these parameters increased significantly during recording, such cells were discarded from further analysis.
Cerebellar GC (ascending fibre)-mediated EPSCs were evoked by focal stimulation through ACSF-filled glass electrodes (10–20 MΩ) that were placed at the PC layer between the recorded IN and the GC layer. A single pulse of 5 V for 100 μs was applied by a programmable multichannel stimulator (Master-8; A.M.P.I., Jerusalem, Israel) and stimulus isolators (ISO-Flex; A.M.P.I.). The stimulus artefacts have been truncated for the illustration. We prepared horizontal slices (250 μm thick) of cerebellar cortex to examine the properties of parallel fibre (PF) beam-to-IN synapses. The stimulation electrode was placed in the outer molecular layer at a distance of at least 100 μm from the recorded IN (Sims & Hartell, 2005). We stimulated, by different electrodes (S1 and S2), two independent sets of ascending GC axon fibres converging on a single IN, and then checked cross-activation of the GC fibres by observing whether PPFamp was evoked with an alternate PP stimulation between the different electrodes (S1 → S2 and S2 → S1). IN-mediated IPSCs were evoked in a similar fashion as GC-EPSCs, but the stimulation electrode was placed on the outer molecular layer. In some experiments, we added bicuculline (5 μm) or 6-cyano-7-nitroquinoxaline-2,3-dione (CNQX; 10 μm) to the ACSF in order to distinguish EPSCs and IPSCs, respectively.
To record GC-mediated asynchronously occurring EPSCs from the IN, we replaced 2.5 mm CaCl2 in the external ACSF with 4 mm SrCl2 and 0.5 mm CaCl2 (for the paired-stimulation experiment), or 5 mm SrCl2 (for all other experiments; nominally Ca2+ free). Asynchronized EPSCs were analysed by the ‘Mini Analysis’ program (Synaptosoft, Decatur, GA, USA) in a 300 ms window, as described by Oliet et al. (1997) and Matsushita et al. (2002). All drugs used in this study were bath applied, unless otherwise stated. Drugs were purchased from Tocris Bioscience (Bristol, UK), and Wako Pure Chemical Industries (Osaka, Japan). Some stock solutions were prepared in dimethyl sulphoxide. During electrophysiological experiments, the final dimethyl sulphoxide concentration never exceeded 0.1% (vol/vol). Dextran (40 kDa) was diluted in the ACSF at a concentration of 5% (w/v), and this solution was rendered isoosmotic with distilled water, as described by Savtchenko and Rusakov (2005). Rose Bengal and bafilomycin A1 were applied by incubation of cerebellar slices on an interface chamber for at least 1 h at room temperature, during which the drug was continuously superfused during patch-clamp recording.
Calculation of paired-pulse ratio (PPR) and statistical analysis
EPSC and IPSC amplitudes were measured from the peak of the postsynaptic current to the basal current level immediately preceding the artefact of the electrical stimulation. The decay-time constant of the postsynaptic currents was mostly calculated with a single-exponential fitting procedure in the ‘PULSEFIT’ program (HEKA Elektronik). The PPR of the amplitude and the decay-time constant (τ), the latter obtained by a single-exponential function, was calculated in individual traces from the ratio of the second to the first currents evoked by PP stimulation with interstimulus intervals (ISIs) of 30–1000 ms, as previously described (Satake et al. 2010). Differences between treatments were evaluated using ANOVA and post hoc multiple comparison tests, both of which were performed in the ‘KyPlot’ program (KyensLab, Tokyo, Japan). Differences giving P values < 0.05 were judged as significant.
Simulation of postsynaptic conductance
A multi-step model was constructed to simulate Ca2+ transients, vesicular releases and postsynaptic conductance changes. Ten nerve terminals, each with five independent release sites, were activated by paired stimulation with an interval of 30 ms. Bell-shaped presynaptic Ca2+ transients were created using a simple quartic function, y(t) = peak × ((d×t– 1)2– 1)2, d= 2 × (1 – (0.5)1/2)1/2/hw, 0 ≤t≤ 1/d, where t is time after onset of the Ca2+ transient, peak is the maximum Ca2+ concentration, and hw is the width of the half-maximum concentration. The Monte Carlo method was used to simulate vesicular glutamate release according to the Ca2+-dependent kinetic model. For the Ca2+-dependent kinetic model, we tested the models by Schneggenburger & Neher (2000) and Lou et al. (2005), and we used the former model because it causes delayed release more frequently (data not shown).
Glutamate released from the release sites within a single terminal activated a single population of opposing postsynaptic receptors. Some of the simulation assumed an additional common glutamate pool, in which a small proportion of released glutamate is accumulated. The time course of the glutamate concentration and the postsynaptic conductance were calculated according to Wadiche & Jahr (2001). The peak glutamate concentration was 1 mm (Häusser & Roth, 1997). For each condition, we calculated an average trace from 200 EPSC simulations. We used the fourth-order Runge–Kutta method with a fixed time step of 10 μs to obtain numeric integration for calculating the postsynaptic conductance. The simulation program was written in C++ and executed on a personal computer.
Dynamic clamp analysis
A dynamic clamp technique (Sharp et al. 1993) was used to generate GC-IN EPSCs with various conductances and decay-times. To make the EPSCs realistic, parameters of EPSC kinetics (rise times, decay-time constants and PPRs) were first obtained using voltage-clamp recordings, as described in Measurement in Tables 1 and 2. Computer simulations were then run to generate equations that could reproduce EPSCs satisfying these experimental parameters (Simulation in Tables 1 and 2).
Table 1.
Parameters of decay-time constants of GC-IN EPSC applied for dynamic clamp analysis
| First EPSC | Second EPSC (ISI, ms) | ||||
|---|---|---|---|---|---|
| 15 | 30 | 100 | 300 | ||
| Measurement1 | 1.36 ± 0.15 | 2.89 ± 0.62 | 2.00 ± 0.34 | 1.68 ± 0.22 | 1.47 ± 0.20 |
| Simulation | 1.4 | 2.9 | 2.0 | 1.7 | 1.5 |
Synaptic responses were recorded by the whole-cell voltage-clamp mode at a high temperature (31–35°C). Each measurement represents the mean ± SEM (n= 11–12). ISI, interstimulus interval.
Table 2.
PPRamp parameters applied for dynamic clamp analysis
| ISI (ms) | ||||
|---|---|---|---|---|
| 15 | 30 | 100 | 300 | |
| Measurement1 | 1.65 ± 0.06 | 1.75 ± 0.09 | 1.54 ± 0.11 | 1.05 ± 0.11 |
| Simulation | 1.65 | 1.75 | 1.54 | 1.05 |
Synaptic responses were recorded by the whole-cell voltage- clamp mode at a high temperature (31–35°C). Each measurement represents the mean ± SEM (n= 11–12). ISI, interstimulus interval.
The equation for the dynamic clamp EPSCs was as follows: Isyn=Gmax×s×[O]× (Vm–Erev), where Isyn is the synaptic current, Vm is the membrane potential, Gmax is the maximal synaptic conductance (set to 4 nS) and Erev is the reversal potential (set to 0 mV). [O] is the fraction of open channels, calculated from the equation: d[O]/dt=α×[T]× (1 –[O]) –β×[O], where α (= 1.2) and β (= 0.75) are the rate constants for rise-times and decay-times of EPSCs, respectively. [T] represents a transmitter pulse: [T]= H(t0+tmax–t) ×H(t–t0), where H(x) is the Heaviside function (unit step function) and t0 is the time instant of receptor activation. tmax is the duration of the receptor activation (set to 0.6 ms). The rate constants for decay-times (β) varied from 0.75 to 0.34, 0.51, 0.60 and 0.7, which reproduced experimentally fitted decay-times (1.4 to 2.9, 2.0, 1.7 and 1.5 ms, respectively; Table 1). Because changes in β also slightly changed the peak conductance, values were multiplied by a scaling factor (s= 1.000 to 0.903, 0.943, 0.964, 0.988, respectively) to adjust the peak conductance constant (1.70 nS by Gmax of 4 nS). In the dynamic clamp for paired-pulse EPSCs, first EPSCs were Isyn with β= 0.75 (and s= 1.000), whereas second EPSCs were Isyn with various β (and s) multiplied by the corresponding PPR of EPSC amplitude.
Finally, these equations were implemented on a personal computer in a custom-made dynamic clamp system that consisted of conventional analog-to-digital and digital-to-analog converters (Micro Science, Matsudo, Japan). The dynamic clamp program was written in C/C++ and executed under the MS-DOS (single-task) operating system. Every 50 μs (i.e. 20 kHz), the dynamic clamp system received membrane potentials of neurones from an Axoclamp-2B amplifier (Molecular Devices Inc., Sunnyvale, CA, USA), and sent the EPSCs back to the amplifiers. The internal solution for recording the membrane potential of the IN was as follows (in mm): K-methanesulphonate, 130.0; NaCl, 6.0; EGTA, 0.2; Hepes, 10.0; Mg-ATP, 0.3; Na3-GTP, 0.4; phosphocreatine-Tris, 10.0; the pH was adjusted to 7.3.
Results
In the cerebellar cortex, GC axon fibres innervate the axon hillock region of the molecular-layer IN, as well as dendritic trees as PFs (Hámori, 1981; Castejón et al. 2001). The majority of GC synaptic contacts on the axon hillock originate from ascending GC fibres. Hámori (1981) calculated that, in adult rats, one IN (basket cell) receives a focal beam of approximately eight–10 ascending axons from neighbouring GCs, whereas it receives approximately 2500 PF-endings on the dendritic tree. In the present study, we recorded synaptic currents from visually identified INs located in the inner quarter of the molecular layer (thus, they were mostly basket cells), and placed stimulation electrodes in the exterior region of the PC layer between the recorded IN and the GC layer to activate GC axons. Stimulation in this configuration will activate only a small number of ascending GC fibres to evoke excitatory synaptic transmission to the axon hillock region of the IN, and the amplitude of the EPSCs showed a profound diversity among the cells (66.0–1279.5 pA, the average was 342.7 ± 26.5 pA, n= 62).
The PP-activation-evoked EPSCs showed obvious PPFamp (F3,40= 21.7, P < 0.001; Fig. 1A and B): the PPR of the peak amplitude (PPRamp, the ratio of the second to the first peak amplitude) examined at an ISI of 30 ms was 2.00 ± 0.23 (n= 11), and was very similar to that of the previous report examined at an ISI of 20 ms in the mouse PF–basket cell synapse (Bao et al. 2010). The relationship between the ISI and PPRamp was also similar to those recorded at GC–PC synapses (F1,68= 0.55, P= 0.46; Fig. 2C and D).
Figure 1. PPFamp and PPPdecay at GC–IN synapses in rat cerebellar cortex.
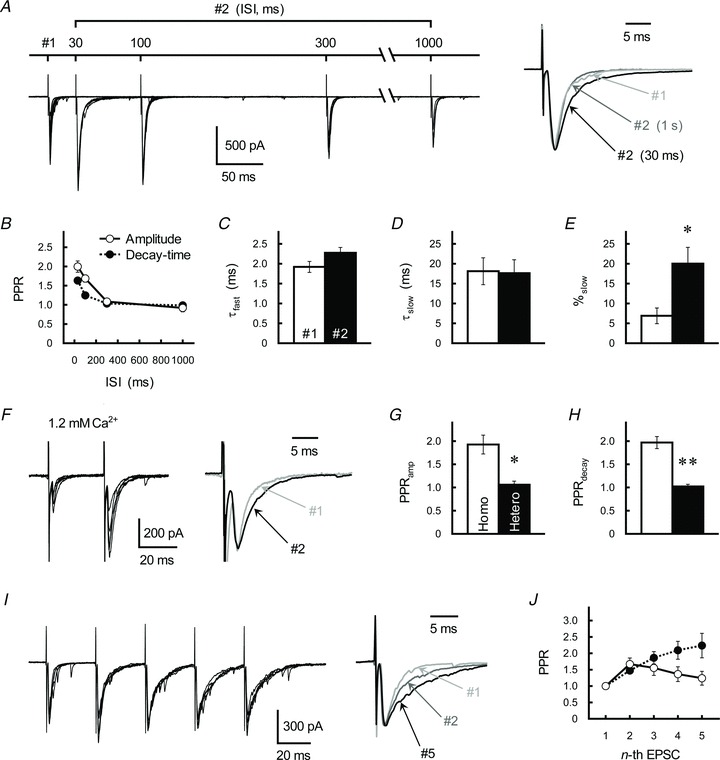
A, effects of PP stimulation on GC-IN excitatory transmission. Left, traces represent superimpositions of five successive EPSCs recorded from a single IN. GC axons were repetitively stimulated with ISIs of 30, 100, 300 or 1000 ms. Right, averaged traces of the first (#1, light grey trace) and second (#2, ISI of 30 ms, black trace; ISI of 1 s, dark grey trace) postsynaptic currents evoked at GC–IN synapses. Each trace was scaled to the same peak amplitude. B, relationship between ISI and the PPRamp (open circles) and the PPRdecay (filled circles). Each point represents the mean ± SEM (n= 11). C–E, summary of kinetics of the second EPSC (ISI of 30 ms), as fitted by a double-exponential procedure. Each column represents the mean ± SEM (n= 9–11). *P < 0.05. F, GC-IN EPSCs examined in 1.2 mm Ca2+-containing ACSF. Left, traces represent superimpositions of five successive EPSCs recorded from a single IN. GC axons were repetitively stimulated with an ISI of 30 ms. Right, averaged traces of the first (grey trace) and second EPSCs (black trace) were scaled to the same peak amplitude. G and H, PPRamp (G) and PPRdecay (H) of the GC-IN EPSCs evoked by repetitive (Homo, open columns) or alternative (Hetero, filled columns) stimulation of the independent GC fibres converging onto the single IN (ISI of 30 ms). Two independent ascending GC axons were repetitively (homo) or alternately (hetero) activated by two different stimulation electrodes with an ISI of 30 ms. If a significant PPFamp occurred in the alternative stimulation experiment, the sample was discarded from further analysis. Each column represents the mean ± SEM (n= 5). **P < 0.01. I, effects of repetitive stimulation on GC-IN EPSCs. Left, traces represent superimpositions of five successive EPSCs recorded from a single IN. GC axons were repetitively stimulated with an ISI of 30 ms. Right, averaged traces of the first (#1, light grey trace), second (#2, dark grey trace) and fifth (#5, black trace) postsynaptic currents evoked at GC–IN synapses. Each trace was scaled to the same peak amplitude. J, relationship between the number of repetitive stimulations (ISI of 30 ms) and the PPRamp (open circles) and the PPRdecay (filled circles). Each point represents the mean ± SEM (n= 9).
Figure 2. Further characterization of postsynaptic currents recorded from the IN and PC.
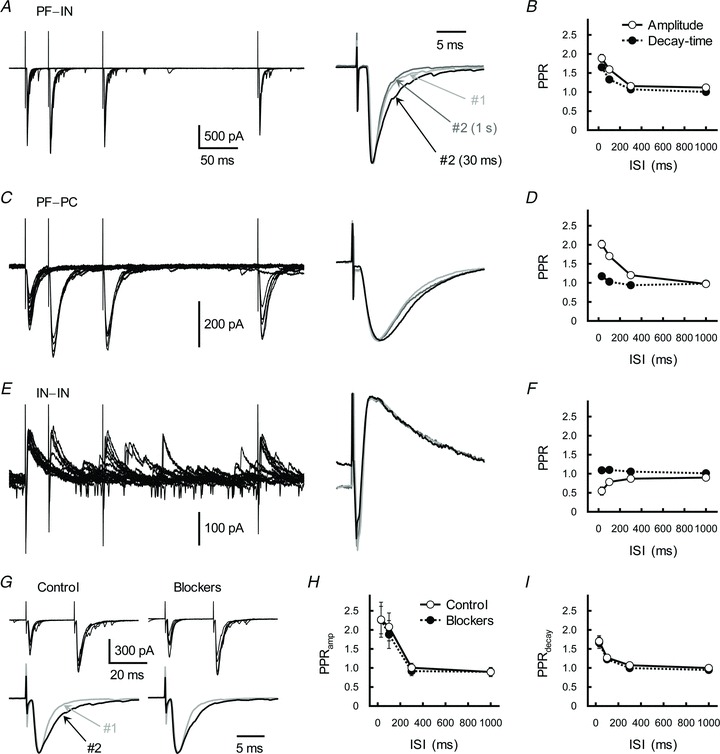
A, C and E, effects of PP stimulation on EPSCs at PF-IN (A) and PF–PC (C) excitatory synapses, and the IPSCs at IN–IN inhibitory synapses (E). Left, traces represent superimpositions of five successive EPSCs/IPSCs recorded from a single IN and PC. GC and IN axons were repetitively stimulated with ISIs of 30, 100 or 300 ms. Right, averaged traces of the first (#1, light grey trace) and second (#2, ISI of 30 ms, black trace; and ISI of 1 s, dark grey trace) postsynaptic currents were scaled to the same peak amplitude. B, D and F, relationship between ISI and the PPRamp (open circles) and the PPRdecay (filled circles) examined at PF–IN (B), PF–PC (D) and IN–IN (F) synapses. Each point represents the mean ± SEM (n= 8–11). G, effects of receptor blockers (d-AP5 (50 μm), AIDA (300 μm) and bicuculline (5 μm)) on GC–IN synaptic transmission. Top, GC axons were repetitively stimulated with an ISI of 30 ms. Traces represent superimpositions of five successive EPSCs recorded from a single IN before (left) and during (right) treatment with the blocker. Bottom, averaged traces of the first (grey traces) and second (black traces) EPSCs were scaled to the same peak amplitude. H and I, relationship between ISI and the PPRamp (H) and the PPRdecay (I) before (control, open circles) and during (filled circles) treatment with the mixture of receptor blocker. Each point represents the mean ± SEM (n= 7).
PPPdecay: a short-term plasticity in the decay kinetics of the GC-IN EPSC
The PP activation of the GC–IN synapse caused a significant increase in the decay-time constants (τ), which were calculated by a single-exponential fitting procedure, of the EPSC (the τ-values of the first and second EPSC, and the PPRdecay, both of which were examined at an ISI of 30 ms, were 2.00 ± 0.18 and 3.27 ± 0.35 ms, and 1.63 ± 0.06, respectively, n= 11; Fig. 1A). The increase in the τ-value of the second EPSC was closely dependent on ISIs (F3,40= 32.1, P < 0.001; Fig. 1B). The decay kinetics of the second EPSC was well fitted by a double-exponential procedure. The decay-time constant of the fast (τfast) and slow (τslow) components did not differ between the first and second EPSCs (Fig. 1C and D), but the ratio of the τslow component (the ratio of the amplitude of slow component to the total amplitude, %slow) was profoundly higher in the second EPSC (Fig. 1E). Therefore, it appears that PPPdecay resulted from a PP-stimulation-induced increase in the τslow component in the ratio. When the Ca2+ concentration of ACSF (2.5 mm) was reduced to 1.2 mm, the amplitude of the EPSC became smaller (51.4–392.4 pA, the average was 149.8 ± 31.6 pA, n= 11) with a higher PPRamp (the value examined at an ISI of 30 ms was 2.51 ± 0.21, n= 11; Fig. 1F). In contrast, neither the decay-time constants of the EPSC nor the PPPdecay showed any significant change (the τ-value of the first EPSC was 2.27 ± 0.20 ms, and the PPRdecay examined at an ISI of 30 ms was 1.76 ± 0.15, n= 11; Fig. 1F), which shows that PPPdecay occurs at the physiological Ca2+ concentration.
Using two stimulation electrodes (S1 and S2), we activated two independent (where heterosynaptic PPFamp was absent; Fig. 1G), but closely located sets of ascending GC axons converging on a single IN. When each independent pathway was activated repetitively at an ISI of 30 ms (homosynaptic stimulation, S1 → S1 and S2 → S2), significant PPFamp and PPPdecay were observed, as mentioned above (Fig. 1G and H). However, when the independent pathways were activated alternately at an ISI of 30 ms (heterosynaptic stimulation, S1 → S2 and S2 → S1), PPPdecay was completely absent (Fig. 1H). This finding suggests that PPPdecay is an activity-dependent short-term plastic change evoked at a single or a closely-located GC-IN pathway. When the number of GC stimulations was increased (up to five stimulations at an ISI of 30 ms), no further facilitation of the EPSC amplitude was observed (Fig. 1I). Thus, PPRamp value, which was calculated by dividing the amplitude of the n-th EPSC by that of the first, reached the highest limit at the second stimulation and then decreased as a function of stimulation number (Fig. 1J; see also Bao et al. 2010). By contrast, PPRdecay value progressively increased as the stimulation was repeated (Fig. 1I and J; see also Carter & Regehr, 2000). The latter result suggests that PPPdecay plays a role in processing neuronal information by specifically enhancing burst-like signals.
In horizontal cerebellar slices, when PP stimulation was applied to the outer molecular-layer PF inputs onto the IN, we observed a marked increase in both the amplitude and decay-time constant of the second EPSC. There were no significant differences in the properties of either PPFamp or PPPdecay between ascending fibre and PF pathways (F1,80= 0.066, P= 0.80 for PPFamp; F1,80= 0.88, P= 0.35 for PPPdecay; Fig. 2A and B). This suggests that both PPRamp and PPRdecay values were common characteristics among GC–IN synapses, irrespective of differences in their contacting sites. In contrast with GC–IN synapses, only a very weak PPPdecay was observed at GC–PC excitatory synapses (F3,28= 8.24, P < 0.001; Fig. 2C and D). No significant PPPdecay was detected at IN–IN inhibitory synapses (F3,28= 0.35, P= 0.79; Fig. 2E and F).
We then examined pharmacological properties of the GC (ascending fibre)-IN EPSC. The AMPA receptor (AMPAR)-selective antagonist SYM2206 (50 μm) strongly suppressed EPSC. By contrast, treatment with a mixture of the NMDA receptor antagonist d-AP5 (d-(−)-2-amino-5-phosphonopentanoic acid, 50 μm), the group I metabotropic glutamate receptor antagonist AIDA ((RS)-1-aminoindan-1,5-dicarboxylic acid, 300 μm) and the GABAA receptor antagonist bicuculline (5 μm) did not affect PPFamp (F1,48= 0.013, P= 0.72) or PPPdecay (F1,48= 0.64, P= 0.43; Fig. 2G–I). Thus, EPSC appears to be mediated by AMPARs, and other receptor types do not have any impact on the PP-stimulation-induced plastic changes (see also Clark & Cull-Candy, 2002).
Cerebellar INs mainly express GluA2/GluA3- containing AMPARs (Satake et al. 2006), which show rapid desensitization (∼5 ms) and slow recovery (∼26 ms; as reviewed in Dingledine et al. 1999), resulting in increasing desensitization in response to repetitive activation. The AMPAR desensitization blocker cyclothiazide (50 μm) markedly augmented the magnitude of PPRdecay (F1,63= 26.5, P < 0.001; Supplementary Fig. 1), which suggests that postsynaptic AMPARs were strongly desensitized during the repetitive activation, causing the PPRdecay value to be underestimated when measured without cyclothiazide. However, cyclothiazide has non-specific presynaptic effects (Diamond & Jahr, 1995; Ishikawa & Takahashi, 2001), rendering it unsuitable for studies of presynaptic mechanisms (see below). In fact, cyclothiazide (50 μm) increased the EPSC amplitude (183.9 ± 22.9% of control; n= 9, P= 0.007) and caused a marked reduction of the magnitude of PPRamp (F1,63= 10.4, P= 0.002; Supplementary Fig. 1). Therefore, we decided not to use cyclothiazide in subsequent experiments.
Presynaptic origin of PPPdecay
GC stimulation often elicits a long-lived quantal release (lasting several tens to hundreds of milliseconds after the macroscopic EPSC) called ‘delayed’ or ‘transient’ release (Atluri & Regehr, 1998; Chen & Regehr, 1999). To examine the possible contribution of the delayed release to PPPdecay, we made a multi-step simulation of postsynaptic conductance using a simple bell-shaped Ca2+ transient (control). Its shape was modified in three ways to evoke different patterns of release (Fig. 3A): (1) an increase in peak Ca2+ concentration; (2) a broadening of Ca2+ transients; and (3) an addition of a tail component of the Ca2+ (with a time constant of 2.5 ms). Modification of the Ca2+ transient altered release rate and postsynaptic conductance in different ways (Fig. 3A). Increases in both the peak and width of presynaptic Ca2+ transients profoundly enhanced the peak amplitude of the postsynaptic conductance, but these modifications did not elicit any prolongation of the decay-time constant (Fig. 3B). By contrast, a moderate prolongation of the release was simulated by the addition of the tail component of the Ca2+ transients, but this modification failed to generate the slow decaying component (τslow) of the conductance (Fig. 3A and B). Cumulatively, these results suggest that delayed release is not enough to explain the mechanisms underlying PPPdecay and that another process is involved in eliciting PPPdecay.
Figure 3. A multi-step simulation of postsynaptic conductance.
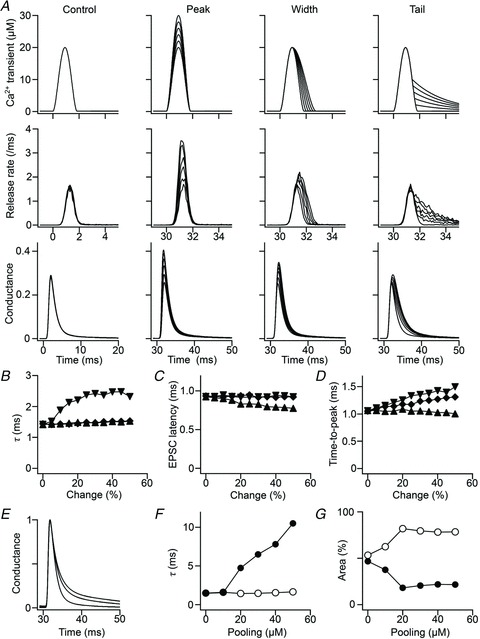
A, effects of modifying the presynaptic Ca2+ transient on vesicular release and postsynaptic conductance. Panels in the top, middle and bottom rows show the Ca2+ transient, release rate per terminal and postsynaptic conductance normalized to the maximum conductance, respectively. The leftmost column shows the control (the first stimulation). The second, third and fourth columns show peak, width and tail modifications, respectively. Six traces are superimposed in each panel. The ordinate is common in each row; the abscissas are common in the top and middle rows. B–D, summary of the simulation. Decay-time constant (B), latency (C) and time-to-peak (D) of the postsynaptic conductance are plotted against change of peak (triangles), width (diamonds) and tail (inverted triangles) of the presynaptic Ca2+ transient (% of control). The decay-time constant was obtained by a single-exponential fitting. E, effects of glutamate pooling on conductance. It is assumed that each vesicular release contributed to pooling, with a peak concentration of 0–50 μm (pooling concentration). The glutamate concentration was assumed to be additive and to decay exponentially (τ was fixed to 8 ms). Conductance traces normalized to the peak are shown for the pooling concentrations of 0, 20 and 40 μm. The trace without pooling was best fitted with a single-exponential function, whereas traces with pooling concentrations ≥20 μm were better fitted with a double-exponential function. F and G, the time constants (F) and percent areas (G) plotted against the pooling concentration for the fast (open circles) and slow (filled circles) components. The simple assumption of a single common pool failed to reproduce the increase in area, but not in time constant, when there was more pooling.
Asking whether PPPdecay involves a presynaptic or postsynaptic site of action, we first observed the effect of GC activation on properties of postsynaptic neurones. GC fibre stimulation did not influence the input resistance (Rinput) of INs (800.9 ± 148.0 and 843.9 ± 179.6 MΩ with and without single GC stimulation, respectively; n= 12, P= 0.32; Fig. 4A and B). If PPPdecay resulted from poor voltage-clamping, reduction of the EPSC amplitude should reduce the magnitude of PPRdecay. Moderate concentration (0.5 μm) of the high-affinity competitive AMPAR-antagonist CNQX reduced the peak amplitude of the GC-IN EPSC to 59.7 ± 5.7% (n= 6) of the control, but did not affect PPRamp or PPRdecay (Fig. 5A, C and D). Thus, properties of the postsynaptic INs do not appear to have been artificially changed by repetitive GC stimulation.
Figure 4. Relationship between PPF at GC-IN synapses and changes in the properties of postsynaptic AMPARs.
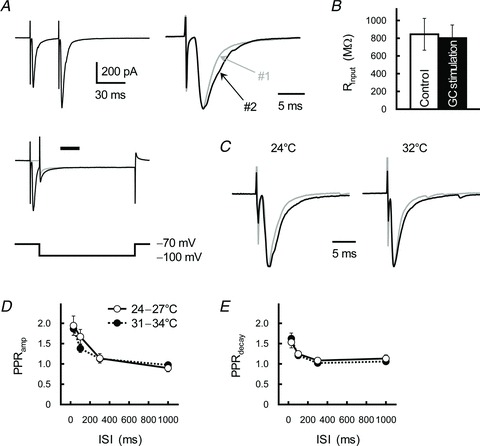
A, stimulation-evoked EPSCs did not change input resistance of the IN. Holding potentials of the IN changed from −70 to −100 mV (left bottom); traces were averaged both before (grey trace) and after (black trace) GC stimulation (left middle). Rinput was calculated 30 ms after the GC stimulation (as indicated by the horizontal bar, a timing of the second EPSC, refer to traces showing at the left top). Superimpositions of averaged traces, scaled to the same peak amplitude, of the first (#1, grey trace) and second (#2, black trace) EPSCs (right). B, summary of the Rinput calculated before (open columns) and after (filled columns) GC stimulation. Each column represents the mean ± SEM (n= 12). C, GC–IN synaptic transmission at a high temperature. GC axons were repetitively stimulated with an ISI of 30 ms. Superimpositions of averaged traces of the first (grey traces) and second (black traces) EPSCs recorded at 24°C (left) or 32°C (right). Each trace was scaled to the same peak amplitude. D and E, relationship between ISI and the PPRamp (D) and the PPRdecay (E) recorded at 24–27°C (open circles) or 31–34°C (filled circles). Each point represents the mean ± SEM (n= 7).
Figure 5. Effects of different competitive antagonists for glutamate receptors on PPF at GC–IN synapses.
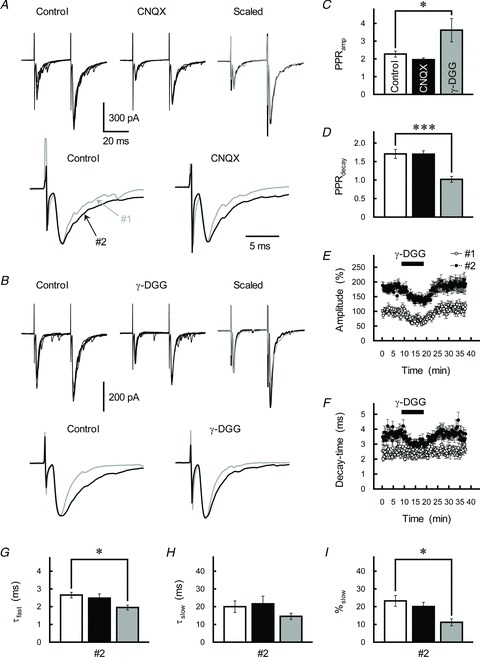
A and B, top, effects of CNQX (0.5 μm, A) and γ-DGG (200 μm, B) on GC–IN synaptic transmission. GC axons were repetitively stimulated with an ISI of 30 ms. Traces represent superimpositions of five successive EPSCs recorded from the IN before (left) and during (middle) drug treatment. After averaging, the depressed first EPSC (black traces) was scaled to the control EPSC (grey traces) and superimposed (right). Bottom, averaged traces of the first (grey traces) and second (black traces) EPSCs were scaled to the same peak amplitude. C and D, the PPRamp (C) and PPRdecay (D) before (control, open columns) and during treatment with CNQX (0.5 μm, black columns) or γ-DGG (200 μm, grey columns). Each column represents the mean ± SEM (n= 6–7). ***P < 0.001, *P < 0.05. The inhibitory effects of 0.5 μm CNQX and 200 μmγ-DGG on the peak amplitude of the first EPSC were not different significantly (P= 0.69). E and F, time course of changes in the amplitude (E) and decay-time constant (F) of the first (open circles) and second (filled circles) EPSCs during application of γ-DGG (200 μm). EPSCs were evoked every 15 s by test stimulation. The amplitude is expressed as a percentage of the first EPSC, which was determined prior to application of γ-DGG. γ-DGG was applied for 10 min by perfusion (as indicated by the horizontal bar). Each point represents the mean ± SEM (n= 8–11). G–I, summary of the effects of CNQX (black columns) and γ-DGG (grey columns) on the kinetics of the second EPSC, as fitted by a double-exponential procedure. Each column represents the mean ± SEM (n= 6–12).
To evaluate the effects of differing postsynaptic AMPARs on PPPdecay, we observed asynchronized EPSCs evoked in Sr2+-containing ACSF (Oliet et al. 1997; Xu-Friedman & Regehr, 1999; Matsushita et al. 2002). When substituted for Ca2+, Sr2+ triggers synaptic vesicular release but leads to asynchronized release (Abdul-Ghani et al. 1996). Because the asynchronous release only occurs at a subset of the electrically stimulated synapses, it permits a detailed analysis of miniature events originating at the actual GC axons contributing to PPF. In an Sr2+-containing solution, PP stimulation of GC axons (ISI of 30 ms) markedly augmented the frequency of asynchronized EPSCs without affecting the mean amplitude (Fig. 6A–C); this confirms that synaptic vesicular release at the GC terminal is likely facilitated by repetitive activation. The decay-time constant of Sr2+-asynchronized EPSCs, however, did not increase in response to PP activation (n= 8, P= 0.19; Fig. 6D). The mean decay-time constant of the asynchronized EPSC (1.49 ± 0.16 ms, n= 8) seemed to be slightly smaller than the τfast value of the first EPSCs evoked by electrical stimulation in normal ACSF (1.92 ± 0.14 ms, n= 11, P= 0.055), possibly reflecting the contribution of less synchronous vesicular release and/or multivesicular release (MVR) to the evoked EPSC (Diamond & Jahr, 1995; Isaacson & Walmsley, 1995). Overall, the results of these experiments clearly rule out the possibility that repetitive GC stimulation changed the properties of postsynaptic AMPARs. Rather, it appears that PPPdecay originates in the presynaptic mechanism.
Figure 6. Effect of PP stimulation on asynchronized EPSCs recorded at GC–IN synapses.
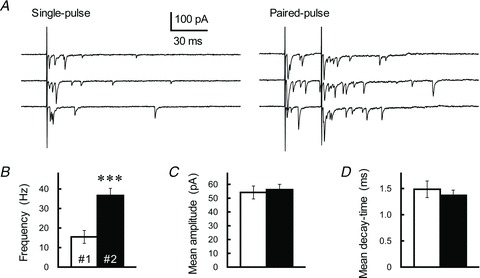
A, asynchronously occurring EPSCs evoked by a single (left) or paired-pulse (ISI of 30 ms, right) GC axon stimulation were recorded from a single IN at least 15 min after perfusion of Sr2+-containing ACSF; three successive sweeps are indicated. B–D, comparison of the frequency (B), mean amplitude (C) and mean decay-time constant (D) of asynchronized EPSCs evoked by first (#1, open columns) or second (#2, filled columns) stimulation. The asynchronized EPSCs were collected during a 300 ms window starting from the GC stimulation. Each column represents the mean ± SEM (n= 5, ***P < 0.001).
Relationship between MVR and PPPdecay
To examine the mechanisms underlying presynaptic PPPdecay in greater detail, we first investigated the effect of the low-affinity competitive AMPAR-antagonist γ-d-glutamylglycine (γ-DGG), which can less effectively inhibit actions produced by a higher concentration of glutamate (Wadiche & Jahr, 2001; Kodama et al. 2006; Satake et al. 2006). γ-DGG (200 μm) reduced the peak amplitude of the first EPSC to 62.4 ± 3.6% (n= 10). It had significantly less pronounced effects on the second EPSC (71.2 ± 3.2%, n= 10, P= 0.006), resulting in a marked increase in the magnitude of PPRamp (F2,88= 7.24, P= 0.001; Fig. 5B and E). This suggests that glutamate concentration in the synaptic cleft ([Glu]cleft) at GC–IN synapses is significantly higher during the second EPSC than the first. In other words, PP activation of GC axon fibres increases the number of vesicles released from the single presynaptic terminal (namely, facilitation of MVR). Furthermore, γ-DGG clearly reduced the decay-time constant of the second EPSC more than that of the first, and therefore the PPRdecay value became smaller (F2,88= 10.1, P < 0.001; Fig. 5D and F). In addition, the result of double-exponential fitting analysis indicated that there was a significant reduction in %slow of the second EPSC (Fig. 5G–I). The suppressive action of the low-affinity antagonist γ-DGG on PPPdecay suggests that AMPARs were still activated by low concentrations of glutamate during the τslow phase of the second EPSC.
To further evaluate the PP-activation-induced MVR, we monitored kinetics of the rising phase of the GC-IN EPSC. Paired stimulation of GC axons (ISI of 30 ms) reduced the latency between the stimulation artefact and the onset of the second EPSC (the latency was measured from the centre of the stimulation artefact, and the onset was defined as the time point corresponding to 1% of the maximum amplitude) without changing the 20–80% rise time (Fig. 7A, B and E). This reduced latency was explained by a simple model with multiple phases of Ca2+ binding to the exocytotic Ca2+ sensor, and following vesicle fusion (Schneggenburger & Neher, 2000). The result of the simulation clearly showed that the increased peak in Ca2+ transients reduced latency (Fig. 3C). The onset of the second EPSC became uniform at an earlier time point than during the first EPSC (Fig. 7A); therefore, the coefficient of variation (CV) of the latency was significantly smaller for the second EPSC (Fig. 7F). These findings suggest that: (1) the first EPSC originated from summation of less-uniformly occurring phasic vesicular release; and that (2) repetitive activation of GC axon fibres accelerated the release, possibly relying on accumulation of residual Ca2+ at the release site.
Figure 7. PP stimulation-induced changes in the kinetics of GC-IN EPSCs.
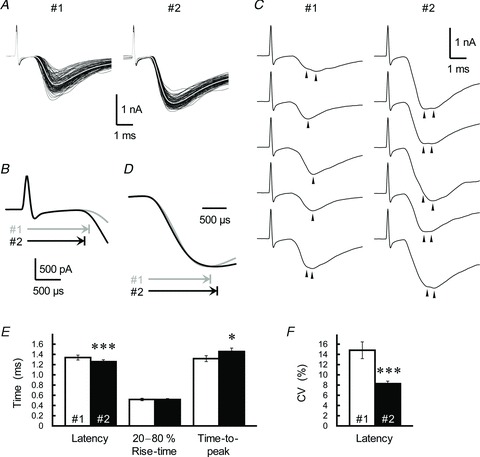
A, 100 consecutive sweeps of the first (#1) and second (#2, ISI of 30 ms) EPSCs were recorded from a single IN. The sampling rate was 50 kHz. The averaged trace is indicated by the grey line. B, superimposition of the rising phases of averaged traces from the first (grey trace) and second (black trace) EPSCs (same data as in A). Horizontal arrows show the latency from the stimulation artefact to the onset of the first and second EPSC. C, representative EPSC doublets from the first and second EPSC pairs (same data as in A). Some EPSCs display a secondary event or an inflection point in their rising phase. Individual events are indicated by arrowheads. D, averaged traces of the first (grey trace) and second (black trace) EPSCs were scaled to the same peak amplitude and aligned at the rising phase of the EPSCs (same data as in A). Horizontal arrows show the time-to-peak from the onset of the first and second EPSCs. E, summary of the kinetics of the first (open columns) and second (filled columns; ISI of 30 ms) EPSCs. Each column represents the mean ± SEM (n= 12). ***P < 0.001, *P < 0.05. F, the trial-to-trial fluctuation of the latency of the first (open columns) and second (filled columns; ISI of 30 ms) EPSCs. CV, coefficient of variation.
Additionally, PP activation of GC axons significantly increased the appearance of ‘EPSC doublets’ during the peak phase (Fig. 7C). Unfortunately, the second event in the doublets could not be unambiguously resolved, possibly due to high occupancy of the postsynaptic receptors during the doublet, as has been reported for inhibitory synapses (Auger et al. 1998). There was a significant prolongation of the time-to-peak from the onset of the EPSC after PP activation (Fig. 7D and E); this appeared to reflect an increase in the appearance of EPSC doublets. The results of simulation showed that broadening of the Ca2+ transients also contributed to the prolongation of the time-to-peak (Fig. 3D). Therefore, it is likely that multiple synaptic vesicles were released within sub-milliseconds of each other during the second EPSC. Together with the significant suppressing effect of γ-DGG on PPPdecay, the PP-activation-induced increase in the time-to-peak value (Fig. 7C and D) indicates that PPPdecay is elicited by a prolonged AMPAR activation in response to the glutamate transient caused by an MVR during the peak phase of second EPSC.
PPPdecay originates in extrasynaptic spillover and intersynaptic pooling of the GC transmitter
The decay-time constant of EPSCs closely depends on clearance of glutamate from the synaptic cleft and the neighbouring perisynaptic region. Thus, it is possible that glutamate spilled out of the GC–IN synapse activated remote AMPARs in the extrasynaptic region or neighbouring synapses, thereby prolonging the EPSC decay. Synaptically released glutamate is cleared not only by passive diffusion but also by the transporter-mediated uptake machinery distributed at perisynaptic glial cells and postsynaptic neurones. Because glutamate uptake is usually enhanced at higher temperatures (Asztely et al. 1997), we monitored decay kinetics of the GC-IN EPSC at different temperatures. The decay-time constant of the first EPSC recorded at a high temperature (1.67 ± 0.13 ms, 31–34°C) was significantly smaller than that examined at room temperature (2.17 ± 0.21 ms, 24–27°C; n= 7, P= 0.024; Fig. 4C). However, the relationships between ISI and PPRamp and between ISI and PPRdecay were similar at high (31–34°C) and room temperatures (F1,48= 0.60, P= 0.44 and F1,48= 0.001, P= 0.97, respectively; Fig. 4D and E). At GC–IN synapses (PFs), glial processes are sparse and the density of glial glutamate transporter is low (Chaudhry et al. 1995); both factors will allow the glutamate transient caused by an MVR to overwhelm uptake capacity of the transporters even at the higher temperature.
We next monitored the effect of dl-threo- β-benzyloxyaspartic acid (TBOA), a potent competitive blocker of glutamate transporters (Shimamoto et al. 1998; Satake et al. 2010), on kinetics of the EPSC; assuming that blocking glutamate uptake would mimic decay-time prolongation. Application of TBOA (100 μm) did not affect the amplitude of the EPSCs (Fig. 8A and B), and therefore the PPRamp value did not change significantly (P= 0.65; Fig. 8D). TBOA (100 μm) often disclosed a tail current of the first EPSC but never prolonged its decay (Fig. 8A and C); τ-values were 1.69 ± 0.31 and 1.45 ± 0.23 ms (n= 6, P= 0.044) before and during TBOA treatment, respectively (see also Clark & Cull-Candy, 2002). By contrast, the effect of TBOA on the second EPSC (ISI of 30 ms) was profoundly different (Fig. 8A–C); it reversibly increased the decay-time constant (Fig. 8C), therefore the PPRdecay value during treatment with TBOA was profoundly higher than that of the control examined before TBOA application (Fig. 8E). Specifically, TBOA (100 μm) increased the τslow (Fig. 8G) and %slow values (Fig. 8H) without altering the τfast (Fig. 8F). This result prompted to us to hypothesize that PPPdecay is induced by an increase of MVR at GC–IN synapses and the subsequent extrasynaptic spillover of MVR glutamate.
Figure 8. Contribution of extrasynaptic glutamate spillover in eliciting PPPdecay.
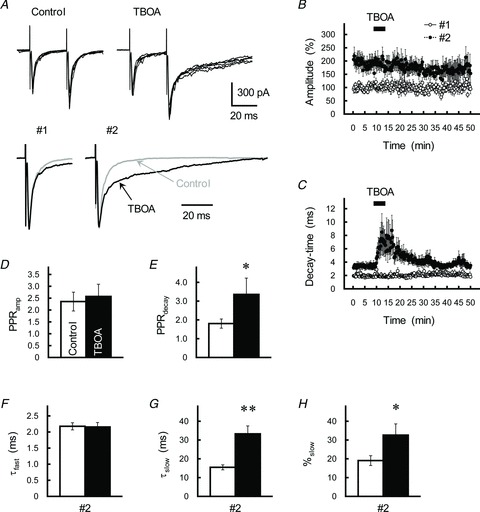
A, effects of the glutamate transporter blocker TBOA (30 μm) on GC–IN synaptic transmission. Top, GC axons were repetitively stimulated with an ISI of 30 ms. Traces represent superimpositions of five successive EPSCs recorded from a single IN before (left) and after (right) treatment with TBOA. Bottom, averaged traces of the first (#1) and second (#2) EPSCs before (grey traces) and during (black traces) treatment with TBOA were scaled to the same peak amplitude. B and C, time course of changes in the amplitude (B) and decay-time constant (C) of the first (open circles) and second (filled circles) EPSCs during application of TBOA (30 μm). EPSCs were evoked every 15 s by test stimulation. Amplitude is expressed as a percentage of the first EPSC, which was determined before application of TBOA. TBOA was applied for 10 min by perfusion (as indicated by the horizontal bar). Each point represents the mean ± SEM (n= 10). D and E, the PPRamp (D) and PPRdecay (E) before (control, open columns) and during treatment with TBOA (30 μm, black columns). Each column represents the mean ± SEM (n= 9–10). *P < 0.05. F–H, summary of the effects of TBOA (black columns) on the kinetics of the second EPSC, as fitted by a double-exponential procedure. Each column represents the mean ± SEM (n= 10, **P < 0.01).
It has been reported that the substantial viscosity increased by application of the inert macromolecule dextran into perfusion solution retards the diffusion coefficient of neurotransmitters in the extracellular space (Nielsen et al. 2004; Savtchenko & Rusakov, 2005). To evaluate involvements of extrasynaptic spillover in PPPdecay, we examined the effects of dextran on the property of GC-IN EPSCs assuming that: (1) retardation of transmitter diffusion increases the dwell time of glutamate molecules in the proximity of glutamate transporters; and that (2) the retardation will increase efficiency of the uptake and prevent further extrasynaptic diffusion of the GC-glutamate without affecting the delayed release-mediated process (see also Satake et al. 2006). Application of dextran (40 kDa, 5% w/v) into perfusion solution caused an irreversible decrease in the amplitude of EPSCs (Fig. 9A and B), but it did not change the PPRamp significantly (P= 0.12; Fig. 9D). Dextran clearly and reversibly reduced the decay-time constant of the second EPSC without changing that of the first EPSC (Fig. 9A and C); therefore, the PPRdecay decreased significantly (P= 0.043; Fig. 9E). When the double-exponential fitting was applied on the decay kinetics of the second EPSC, we found a marked reduction in the %slow value (P= 0.006), but did not detect significant changes in the τfast and τslow values (P= 0.42 and P= 0.61, respectively; Fig. 9F–H). The result agrees well with the hypothesis that PPPdecay is originated in extrasynaptic spillover of the GC transmitter.
Figure 9. Effects of a retardation of extracellular glutamate diffusion on PPPdecay.
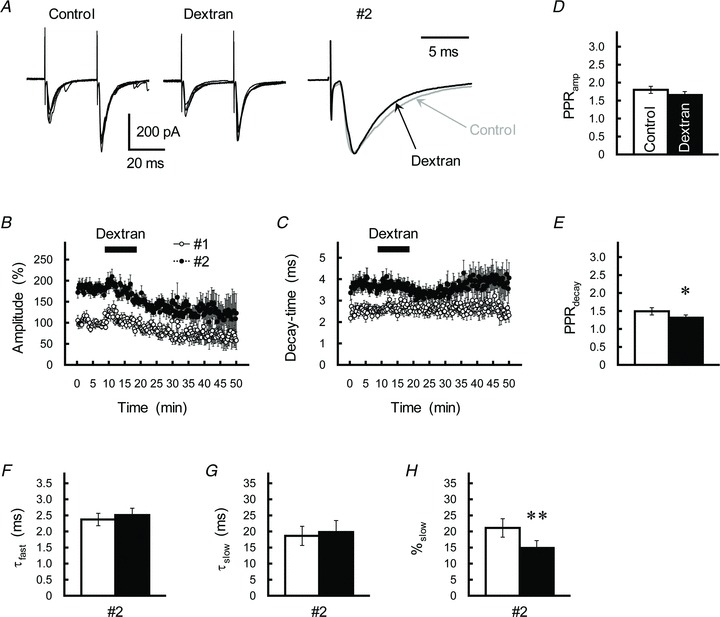
A, effects of the macromolecule dextran (40 kDa, 5% w/v) on GC–IN synaptic transmission. Left and middle, GC axons were repetitively stimulated with an ISI of 30 ms. Traces represent superimpositions of five successive EPSCs recorded from a single IN before (left) and after (middle) treatment with dextran. Right, averaged traces of the second EPSCs before (grey traces) and after (black traces) treatment with dextran were scaled to the same peak amplitude. B and C, time course of changes in the amplitude (B) and decay-time constant (C) of the first (open circles) and second (filled circles) EPSCs during application of dextran (5%). EPSCs were evoked every 15 s by test stimulation. Amplitude is expressed as a percentage of the first EPSC, which was determined before application of dextran. Dextran was applied for 10 min by perfusion (as indicated by the horizontal bar). Each point represents the mean ± SEM (n= 12). D and E, the PPRamp (D) and PPRdecay (E) before (control, open columns) and during treatment with dextran (5%, black columns). Each column represents the mean ± SEM (n= 12, *P < 0.05). F–H, summary of the effects of dextran (black columns) on the kinetics of the second EPSC, as fitted by a double-exponential procedure. Each column represents the mean ± SEM (n= 12, **P < 0.01).
It is also possible that PPPdecay may originate in a saturation of postsynaptic AMPARs with high [Glu]cleft during the peak phase of the second EPSC (Foster et al. 2005). To test this, we examined the effect of Rose Bengal, a blocker of vesicular-type glutamate transporters (Ogita et al. 2001; Shigeri et al. 2004; Wilson et al. 2005). We predicted that, because Rose Bengal reduces glutamate contents in the presynaptic vesicle, reduction in quantal size should prevent postsynaptic AMPARs from becoming saturated. After incubation of cerebellar slices with Rose Bengal (0.1 μm, >1 h), the cumulative amplitude distribution of the GC activation-evoked asynchronously occurring EPSCs recorded from INs in Sr2+-containing ACSF markedly shifted to the left (P < 0.001, Kolmogorov–Smirnov test; Fig. 10A). As a result, the mean amplitude of the asynchronized EPSCs was approximately half that of the control (F2,21= 6.16, P= 0.008; Fig. 10B). The Rose Bengal treatment, however, did not cause significant change in the PPRamp value (Fig. 10C and E). The PPRdecay examined after incubation with Rose Bengal was not significantly different from that of the control examined without the Rose Bengal treatment (Fig. 10C and F).
Figure 10. Effects of a reduction of vesicular glutamate on PPF at GC–IN synapses.
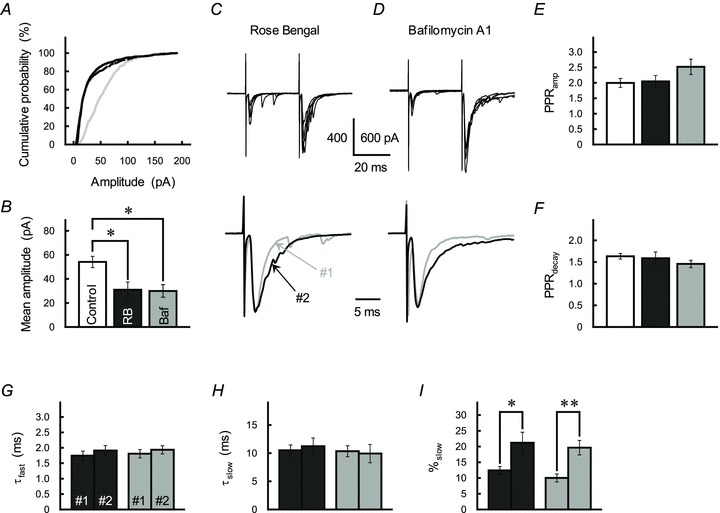
A, cumulative probability plot of the amplitude of asynchronized EPSC recorded from IN in the cerebellar slice incubated with Rose Bengal (0.1 μm, black line) or bafilomycin A1 (1 μm, dotted line), or without pharmacological treatment (control, grey line). B, summary of the effects of Rose Bengal (RB) and bafilomycin A1 (Baf) on the mean amplitude of the asynchronized EPSCs. Rose Bengal and bafilomycin A1 were applied in different sets of slices. Each column represents the mean ± SEM (n= 8). *P < 0.05. C and D, effects of Rose Bengal (0.1 μm, C) and bafilomycin A1 (1 μm, D) on GC–IN synaptic transmission. GC axons were repetitively stimulated with an ISI of 30 ms. Traces represent superimpositions of five successive EPSCs recorded from a single IN at least 1 h after incubation with the test drug (top). Averaged traces of the first (grey traces) and second EPSCs (black traces) were scaled to the same peak amplitude (bottom). E and F, summary of PPRamp (E) and PPRdecay (F) recorded from IN (ISI of 30 ms) incubated with Rose Bengal (black columns) or bafilomycin A1 (grey columns), or without treatment (control, open columns). Each column represents the mean ± SEM (n= 9–11). G–I, summary of the effects of Rose Bengal (black columns) or bafilomycin A1 (grey columns) on the kinetics of the first (#1) and second (#2) EPSCs, as fitted by a double-exponential procedure. Each column represents the mean ± SEM (n= 8–11, **P < 0.01).
Bafilomycin A1 (1 μm, >1 h), a specific inhibitor of vacuolar-type H+-ATPase (Zhou et al. 2000; Harrison & Jahr, 2003), also reduced the mean amplitude of the Sr2+-asynchronized EPSCs (Fig. 10A and B), presumably by collapsing the proton gradient necessary for vesicular storage of neurotransmitters, but did not affect the PPRdecay value (Fig. 10D–F). The absence of significant inhibitory effects of Rose Bengal and bafilomycin A1 treatment on PPRamp (F2,28= 2.11, P= 0.14) and PPRdecay values (F2,28= 0.92, P= 0.41) suggested that PPPdecay does not involve a saturation of the postsynaptic AMPARs during MVR at the second EPSC. Neither Rose Bengal nor bafilomycin A1 changed the PP-stimulation-induced increase of %slow (Fig. 10G–I). By contrast, the decay-time constant of the slow component of the second EPSC (ISI of 30 ms) after treatment with Rose Bengal and bafilomycin A1 (10.5 ± 1.1 ms, n= 19; Fig. 10H) was far smaller than that of the control (18.4 ± 1.5 ms, n= 41, P < 0.001, from data pooled from Figs 1D, 5H, 8G and 9G), possibly reflecting a reduction of the quantal size. Yet again, this finding suggests that extrasynaptic spillover of GC transmitter plays an important part in PPPdecay and, furthermore, that [Glu]cleft during the peak EPSC is a pivotal factor determining aspects of the spillover.
When the intensity of the second stimulation (ISI of 30 ms) was reduced by half to quarter that of the first stimulation (while the intensity of the first stimulation was constant), the amplitude of the second EPSC decreased gradually relying on the intensity (Fig. 11A and B). The decrease in amplitude presumably reflects a decrease in the number of GC axon fibres activated in response to the reduced stimulation intensity. Interestingly, the decay-time constant of the second EPSC also decreased closely depending on the reduced stimulation intensity (Fig. 11A). Therefore, PPPdecay disappeared when the intensity of the second stimulation was reduced to a quarter of that of the first stimulation (Fig. 11C). This suggests that a huge amount of GC transmitter spills out during the second EPSC, leading to intersynaptic pooling of the transmitter among adjacent active GC synapses.
Figure 11. Contribution of intersynaptic glutamate pooling in eliciting PPPdecay.
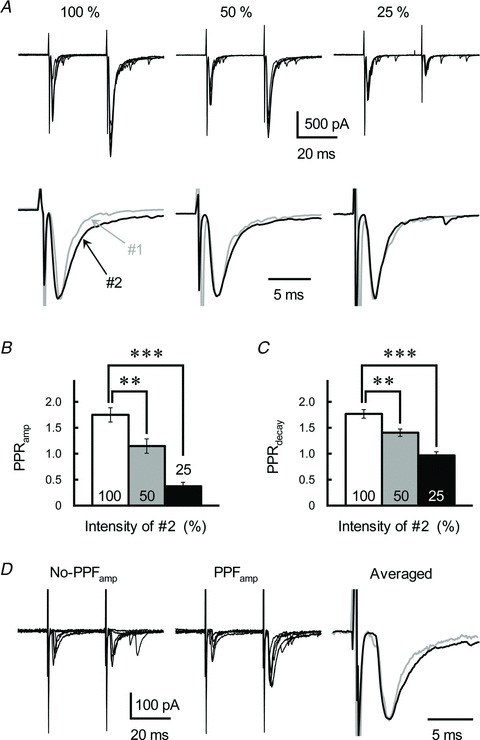
A, effects of reducing the number of activated GC axons on GC–IN synaptic transmission. GC axons were repetitively stimulated with an ISI of 30 ms (top). The intensity of the first stimulation was constant, but the intensity of the second stimulation was reduced as indicated (to half and quarter that of the first stimulation). Traces represent superimpositions of five successive EPSCs recorded from a single IN. Averaged traces of the first (grey traces) and second (black traces) EPSCs were scaled to the same peak amplitude (bottom). B and C, the PPRamp (B) and PPRdecay (C) of the GC-IN EPSCs evoked by repetitive stimulation, where the second stimulation intensity was less than that of the first. Each column represents the mean ± SEM (n= 11, ***P < 0.001, **P < 0.01). D, effects of low-intensity stimulation on GC–IN synaptic transmission. GC axons were repetitively stimulated with an ISI of 30 ms. In some cases, synaptic failure and disappearance of PPFamp was observed (No-PPFamp, left). When clear PPFamp occurred, PPPdecay was also observed (PPFamp, middle). Traces represent superimpositions of EPSCs. For successful PPFamp, averaged traces of the first (grey traces) and second (black traces) EPSCs were scaled to the same peak amplitude (Averaged, right).
To simulate intersynaptic pooling in the simplest way, we modelled an additional glutamate pool to influence postsynaptic conductance. This pool was common for the entire population of postsynaptic AMPARs, and a small amount of glutamate from each vesicular release accumulated in the pool. As the degree of pooling increased, a slow decay component (τslow) became evident, and the decay phase of the conductance was better fitted with a double-exponential function (Fig. 3E–G). This supports the notion that intersynaptic pooling of the GC-glutamate plays a dominant role in the induction of PPPdecay.
Threshold stimulation of the GC fibres leads to evoking smaller EPSCs (∼100 pA; Fig. 11D), in which the amplitude of the first EPSCs appeared to be similar to that of Sr2+-asynchronized quantal EPSCs (see also Fig. 6). The threshold stimulation caused not only an increase of synaptic failures but also a disappearance of PPFamp (in this examination, stimulation intensity was constant for paired-pulse stimulation, ISI of 30 ms). When PPFamp did not occur, PPPdecay was also ambiguous (Fig. 11D). By contrast, in the case when PPFamp occurred, clear PPPdecay was observed (Fig. 11D). The finding confirms again that an increase in the number of released vesicles (namely, MVR) during the second EPSC is necessary to elicit PPPdecay.
Physiological significance of PPPdecay: a dynamic clamp analysis
Finally, we evaluated the physiological significance of PPPdecay by monitoring the effects of EPSC decay prolongation on the excitability of INs. For this purpose, we used a dynamic clamp technique (Sharp et al. 1993), in which we can manipulate parameters of PPPdecay separately from those of PPFamp. First, we applied EPSCs with experimentally fitted decay-time constants into INs (Table 1), and observed EPSPs from the IN in response to the dynamic clamp EPSCs with different τ-values at high temperatures (31–35°C). Slowing of the EPSC decay increased EPSP half-width and time to the EPSP peak (Fig. 12A and B). Furthermore, it also clearly augmented the EPSP amplitude (Fig. 12A and C). Thus, changes in EPSC decay influenced not only the EPSP kinetics (half-width and time-to-peak), but also EPSP amplitude. Thus, it is highly likely that PPPdecay plays a significant role in influencing the excitability of INs.
Figure 12. Impact of EPSC decay on the excitability of INs: a dynamic clamp analysis.
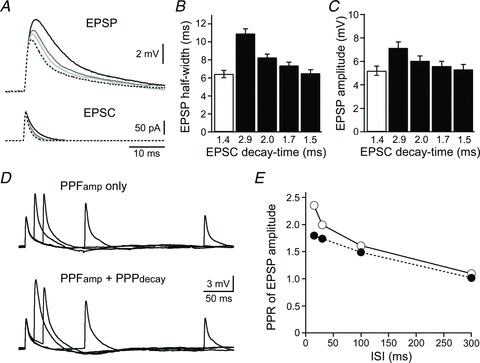
A, representative voltage responses recorded from a single IN (Vm=−65 mV), showing EPSPs (top) in response to EPSCs (bottom) applied with various decay-time constants. Dotted lines indicate EPSCs with decay-time constants of 1.4 ms, and the EPSC-evoked EPSP. Continuous lines indicate EPSCs with decay-time constants of 2.9, 2.0, 1.7 and 1.5 ms, and the EPSC-evoked EPSPs (darker traces correspond to slower EPSC decays). B and C, summary of the EPSP half-width (B) and amplitude (C). Each column represents the mean ± SEM (n= 8). Open columns indicate EPSP responses to EPSCs with decay-time constants of 1.4 ms, which correspond to the first (control) EPSC. Filled columns indicate EPSP responses to EPSCs with decay constants of 2.9, 2.0, 1.7 and 1.5 ms, which correspond to second EPSCs (ISIs of 15, 30, 100 and 300 ms, respectively). D, representative voltage changes recorded from a single IN (Vm=−65 mV), showing EPSPs in response to paired-pulse EPSCs (ISI = 15–300 ms). EPSPs were repetitively evoked with facilitation of EPSC amplitudes (PPFamp only, top), or with facilitation of EPSC amplitudes and slowing of EPSC decays (PPFamp+ PPPdecay, bottom). E, relationship between ISI and the PPR of EPSP amplitude examined with (open circles) or without (filled circles) a decay component. Each point represents the mean ± SEM (n= 8), but SEM is not shown because it is less than the size of the symbols.
Second, we concomitantly adjusted decay-time and amplitude of EPSCs to reproduce PPPdecay and PPFamp, and monitored EPSP facilitation in the IN to evaluate physiological significance of these PP-induced plastic changes (Fig. 12D and E; Table 2). The relationship between ISI and the PPR of EPSP amplitude was significantly different depending on whether the decay-time component was present or absent (F1,56= 251.9, P < 0.001; Fig. 12E). At ISI values of 300 and 100 ms, the presence of prolonged decay caused only a very small increase in the PPRamp of EPSP (Fig. 12E), suggesting that, at these lower frequencies, the amplitude of EPSC is the main determinant of IN excitability. By contrast, when ISI was reduced to 30 and 15 ms, the PPPdecay-mediated increase in the PPRamp of EPSP climbed dramatically (Fig. 12E). This suggests that PPPdecay and PPFamp play differential roles in positively controlling the excitability of INs depending on the frequency of GC firing. Given that PPPdecay increased in response to increasing stimulation numbers (Fig. 1I and J; and see also Carter & Regehr, 2000), it seems likely that PPPdecay has a physiological impact on synaptic information processing, especially when GC–IN synapses transmit burst-like signals.
Discussion
There are three major findings of the current study. First, repetitive activation of glutamatergic GC axon fibres not only causes PPFamp (Atluri & Regehr, 1998), but also a significant presynaptic short-term plasticity PPPdecay of EPSCs recorded at the molecular-layer IN. Second, different mechanisms appear to underlie PPFamp and PPPdecay. PPFamp is elicited in part by an increase in the number of vesicles released during a single action potential (i.e. MVR). On the other hand, PPPdecay results not only from: (1) a long-lived delayed release as described previously by other groups (Atluri & Regehr, 1998; Chen & Regehr, 1999); but also from (2) an extrasynaptic spillover of glutamate and the intersynaptic pooling that follows (present finding). The latter mechanism is closely reliant on PP-stimulation-induced facilitation of MVR. In this context, two presynaptic action potentials at short intervals are enough to elicit spillover-dependent processing of neuronal information (see also Carter & Regehr, 2000). Third, depending on the frequency of synaptic outputs from the GC axons, PPFamp and PPPdecay play unique roles in determining the excitability of the IN.
Different mechanisms underlie PPFamp and PPPdecay
PP activation of GC axon fibres caused a facilitation of the peak amplitude (PPFamp) and a prolongation of the decay-time (PPPdecay) of EPSCs recorded from INs (Fig. 1). The relationship between facilitation magnitude and ISI appeared to be similar for both PPFamp and PPPdecay, despite significant differences in the mechanisms underlying these processes. PPFamp consists of at least two components: (1) transient increase in the probability of synaptic vesicular release and/or in the release sites, as demonstrated by observations of increased frequency of Sr2+-asynchronized EPSCs in response to PP activation (Fig. 6); and (2) an increase in MVR, as demonstrated by pharmacological tests relating AMPAR-antagonist binding affinity and EPSC amplitude (Fig. 5; see also Sims & Hartell, 2005) and kinetics analysis showing that the PP stimulation increased both the appearance of EPSC doublets and the time-to-peak value of the EPSC (Fig. 7).
In the GC–IN synapse, repetitive-activation-induced prolongation of the EPSC decay has been explained by delayed release (Atluri & Regehr, 1998; Chen & Regehr, 1999). On the other hand, our present results indicate that delayed release is not enough to convincingly describe the mechanism of PPPdecay, and that extrasynaptic spillover of the GC transmitter and subsequent intersynaptic pooling of the transmitter also play a role to elicit PPPdecay. It is likely that contribution of delayed release and spillover to prolongation of the EPSC decay is different depending on the experimental condition, which includes, for example, frequency, number and intensity of the GC stimulation, and Ca2+ concentration of the extracellular solution.
Involvements of spillover and pooling in the induction of PPPdecay were demonstrated by five observations. (1) The decay-time constant of the second EPSC consists of two components (τfast and τslow). PPPdecay resulted from an increase in the τslow component in the ratio (namely, %slow) of the macroscopic EPSC (Fig. 1). (2) The low-affinity AMPAR-antagonist γ-DGG decreased the decay-time constant of the second EPSC by reducing the %slow value without significantly affecting that of the first EPSC (Fig. 5). Thus, the decay kinetics of the second EPSC does not appear to be determined solely by the closing kinetics of AMPARs. Furthermore, AMPAR activation appears to continue through the decay phase. (3) The glutamate transporter blocker TBOA increased both the τslow and %slow values, but did not have any significant effects on the first EPSC (Fig. 8). (4) Furthermore, retardation of extracellular diffusion of the GC transmitter decreased %slow of the second EPSC (Fig. 9). Because the transporter-mediated glutamate uptake machinery is distributed at perisynaptic sites, these findings strongly indicate that PPPdecay is caused by a spillover of glutamate into extrasynaptic space from the GC–IN synapse. (5) A decrease in the number of GC axons activated during the second EPSC significantly reduced the decay-time constant (Fig. 11). This indicates that transmitter pooling among active GC synapses is necessary to elicit PPPdecay. In summary, these findings indicate that peak amplitude and decay kinetics of the macroscopic EPSC at GC–IN synapses are composed by different, complex presynaptic mechanisms.
The time interval required for exocytosis of two synaptic vesicles from a single release site is markedly different among synapses. In the cerebellar GC–stellate cell synapse, for example, 15–20 ms intervals are required to mobilize one vesicle from the releasable pool to translocate, dock and prime (Crowley et al. 2007). In fact, the PPRamp value of GC-IN EPSC was similar at ISIs of both 15 and 30 ms (P= 0.91; Table 2), possibly due to depletion of the primed vesicles during such short ISIs. Intervals between the first and second events in the EPSC doublets at the PP-activated GC–IN synapse were too short (∼1 ms; Fig. 7) to release the next vesicle at the single release site. Thus, it is likely that the doublets and, possibly, the MVR originated in vesicles released at different sites that are near the release site that elicited the first event at the single terminal; both of these could target the same population of postsynaptic AMPARs, rather than sequentially released vesicles at a single release site.
In the cerebellar climbing fibre–PC glutamatergic synapse, the transmitter glutamate is released not only at the active zones but also at the ectopic sites (Matsui & Jahr, 2003). Similar ectopic release of glutamate may also play a role to elicit PPPdecay at the GC–IN synapse; however, the ectopic release at the climbing fibre is mainly mediated by Cav2.2 channel activation (Matsui & Jahr, 2004), whereas PPPdecay in the GC–IN synapse was insensitive to Cav2.2 channel blockade (Satake S and Imoto K, unpublished observation). Anyhow, in situations where GC–IN synapses should transmit burst-like synaptic information (for example, as in air-puff stimulation of the rat vibrissae, which evoked approximately 75 Hz burst of action potentials in cerebellar GCs; Chadderton et al. 2004), PPPdecay likely plays a role in compensating for inefficient PPFamp due to the shorter time interval required for vesicle priming processes (see also Fig. 1).
Physiological significance of PPPdecay in information processing in the cerebellar cortex
The cerebellum plays a pivotal role in the timing and coordination of active movements in vivo, and is thought to be capable of processing timing information on the scale of milliseconds to seconds. The sole output neurone PCs are directly excited by GCs (ascending fibres and PFs), after which they are inhibited by GABAergic activity through molecular-layer INs activated by the same set of GC inputs. Therefore, the efficacy of the asynchronously occurring EPSPs in PCs is reduced by feedforward disynaptic inhibition (Mittmann et al. 2005).
The results of our dynamic clamp test (Fig. 12) suggest that PPFamp and PPPdecay play unique roles in determining the excitability of INs. The mechanism described here predicts that bursts of activity in GCs will activate postsynaptic INs with significant PPFamp and PPPdecay. The different types of PP-induced short-term plasticity should play complementary and synergistic roles in augmenting the efficacy of the burst signal, as PPPdecay seems to be able to compensate the inefficient PPFamp (Fig. 1; Tables 1 and 2). However, because small numbers of coincident excitatory quanta could reliably trigger action potentials in cerebellar stellate cells (Carter & Regehr, 2002), further study is necessary to evaluate physiological impacts of PPFamp and PPPdecay on the IN firing. More recently, Savtchouk and Liu (2011) reported that a fear-inducing stimulus in vivo switches subtype of postsynaptic AMPARs in mouse cerebellar stellate cells and thereby causes a decay prolongation of the PF-mediated EPSCs, and this prolongation leads to increases in EPSP amplitude and probability of the action potential firing at the stellate cells. Thus, both presynaptically and postsynaptically originated plastic changes in the EPSC decay play a unique part in controlling activity of cerebellar INs.
It is also likely that the large number of released quantal vesicles underlying the PP-stimulation-evoked macroscopic EPSC provides a means for minimizing the contribution of stochastic variability in the time course of release of individual quanta (DiGregorio et al. 2002). Thus, not only the amplitude of the peak phase but also the duration of the decay phase of the postsynaptic current will play a role in encoding information between neurones. In addition, GC inputs are the major determinants for the recruitment of INs in the feedforward inhibition circuit to PCs (Bao et al. 2010). Because the inhibitory transmission is thought to be involved in cerebellar learning and memory (Santamaria et al. 2007), further scrutiny will shed light on the physiological significance of the different types of PP-induced plasticity (namely, PPFamp and PPPdecay) at the GC–IN synapse and their contribution to neuronal information processing in the cerebellar cortex in vivo.
Acknowledgments
We thank A. Marty for comments on an early version of the manuscript, H. Ishihara and M. Tanaka for technical assistance, and M. Miyata and H. Furue for helpful discussion. This work was partly supported by Grants-in-Aid for Scientific Research (20056032, 21700417 and 23500457 to S.S.) from the Ministry of Education, Culture, Sports, Science and Technology of Japan, and Japan Society for the Promotion of Science.
Glossary
- AIDA
(RS)-1-aminoindan-1,5-dicarboxylic acid
- AMPAR
AMPA receptor
- CNQX
6-cyano-7-nitroquinoxaline-2,3-dione
- CV
coefficient of variation
- d-AP5
d-(−)-2-amino-5-phosphonopentanoic acid
- γ-DGG
γ-d-glutamylglycine
- GC
granule cell
- IN
interneurone
- IPSC
inhibitory postsynaptic current
- ISI
interstimulus interval
- MVR
multivesicular release
- PC
Purkinje cell
- PF
parallel fibre
- PPFamp
paired-pulse facilitation of the EPSC amplitude
- PPPdecay
paired-pulse prolongation of the EPSC decay
- PPR
paired-pulse ratio
- TBOA
dl-threo-β-benzyloxyaspartic acid
Author contributions
Conception and design of the experiments: S.S. and K.I.; collection, analysis and interpretation of data: S.S., T.I. and K.I.; drafting and revising the manuscript: S.S. and K.I. All authors approved the final version of the manuscript.
Supplementary material
Supporting Information
References
- Abdul-Ghani MA, Valiante TA, Pennefather PS. Sr2+ and quantal events at excitatory synapses between mouse hippocampal neurons in culture. J Physiol. 1996;495:113–125. doi: 10.1113/jphysiol.1996.sp021578. [DOI] [PMC free article] [PubMed] [Google Scholar]
- Asztely F, Erdemli G, Kullmann DM. Extrasynaptic glutamate spillover in the hippocampus: dependence on temperature and the role of active glutamate uptake. Neuron. 1997;18:281–293. doi: 10.1016/s0896-6273(00)80268-8. [DOI] [PubMed] [Google Scholar]
- Atluri PP, Regehr WG. Delayed release of neurotransmitter from cerebellar granule cells. J Neurosci. 1998;18:8214–8227. doi: 10.1523/JNEUROSCI.18-20-08214.1998. [DOI] [PMC free article] [PubMed] [Google Scholar]
- Auger C, Kondo S, Marty A. Multivesicular release at single functional synaptic sites in cerebellar stellate and basket cells. J Neurosci. 1998;18:4532–4547. doi: 10.1523/JNEUROSCI.18-12-04532.1998. [DOI] [PMC free article] [PubMed] [Google Scholar]
- Bao J, Reim K, Sakaba T. Target-dependent feedforward inhibition mediated by short-term synaptic plasticity in the cerebellum. J Neurosci. 2010;30:8171–8179. doi: 10.1523/JNEUROSCI.0276-10.2010. [DOI] [PMC free article] [PubMed] [Google Scholar]
- Carter AG, Regehr WG. Prolonged synaptic currents and glutamate spillover at the parallel fiber to stellate cell synapse. J Neurosci. 2000;20:4423–4434. doi: 10.1523/JNEUROSCI.20-12-04423.2000. [DOI] [PMC free article] [PubMed] [Google Scholar]
- Carter AG, Regehr WG. Quantal events shape cerebellar interneuron firing. Nat Neurosci. 2002;5:1309–1318. doi: 10.1038/nn970. [DOI] [PubMed] [Google Scholar]
- Castejón OJ, Castejón HV, Sims P. Light microscopy, confocal laser scanning microscopy, scanning and transmission electron microscopy of cerebellar basket cells. J Submicrosc Cytol Pathol. 2001;33:23–32. [PubMed] [Google Scholar]
- Chadderton P, Margrie TW, Häusser M. Integration of quanta in cerebellar granule cells during sensory processing. Nature. 2004;428:856–860. doi: 10.1038/nature02442. [DOI] [PubMed] [Google Scholar]
- Chaudhry FA, Lehre KP, van Lookeren Campagne M, Ottersen OP, Danbolt NC, Storm-Mathisen J. Glutamate transporters in glial plasma membranes: highly differentiated localizations revealed by quantitative ultrastructural immunocytochemistry. Neuron. 1995;15:711–720. doi: 10.1016/0896-6273(95)90158-2. [DOI] [PubMed] [Google Scholar]
- Chen C, Regehr WG. Contributions of residual calcium to fast synaptic transmission. J Neurosci. 1999;19:6257–6266. doi: 10.1523/JNEUROSCI.19-15-06257.1999. [DOI] [PMC free article] [PubMed] [Google Scholar]
- Clark BA, Cull-Candy SG. Activity-dependent recruitment of extrasynaptic NMDA receptor activation at an AMPA receptor-only synapse. J Neurosci. 2002;22:4428–4436. doi: 10.1523/JNEUROSCI.22-11-04428.2002. [DOI] [PMC free article] [PubMed] [Google Scholar]
- Crowley JJ, Carter AG, Regehr WG. Fast vesicle replenishment and rapid recovery from desensitization at a single synaptic release site. J Neurosci. 2007;27:5448–5460. doi: 10.1523/JNEUROSCI.1186-07.2007. [DOI] [PMC free article] [PubMed] [Google Scholar]
- Diamond JS, Jahr CE. Asynchronous release of synaptic vesicles determines the time course of the AMPA receptor-mediated EPSC. Neuron. 1995;15:1097–1107. doi: 10.1016/0896-6273(95)90098-5. [DOI] [PubMed] [Google Scholar]
- DiGregorio DA, Nusser Z, Silver RA. Spillover of glutamate onto synaptic AMPA receptors enhances fast transmission at a cerebellar synapse. Neuron. 2002;35:521–533. doi: 10.1016/s0896-6273(02)00787-0. [DOI] [PubMed] [Google Scholar]
- Dingledine R, Borges K, Bowie D, Traynelis SF. The glutamate receptor ion channels. Pharmacol Rev. 1999;51:7–61. [PubMed] [Google Scholar]
- Foster KA, Crowley JJ, Regehr WG. The influence of multivesicular release and postsynaptic receptor saturation on transmission at granule cell to Purkinje cell synapses. J Neurosci. 2005;25:11655–11665. doi: 10.1523/JNEUROSCI.4029-05.2005. [DOI] [PMC free article] [PubMed] [Google Scholar]
- Hámori J. Synaptic input to the axon hillock and initial segment of inhibitory interneurons in the cerebellar cortex of the rat. An electron microscopic study. Cell Tiss Res. 1981;217:553–562. doi: 10.1007/BF00219363. [DOI] [PubMed] [Google Scholar]
- Harrison J, Jahr CE. Receptor occupancy limits synaptic depression at climbing fiber synapses. J Neurosci. 2003;23:377–383. doi: 10.1523/JNEUROSCI.23-02-00377.2003. [DOI] [PMC free article] [PubMed] [Google Scholar]
- Häusser M, Roth A. Dendritic and somatic glutamate receptor channels in rat cerebellar Purkinje cells. J Physiol. 1997;501:77–95. doi: 10.1111/j.1469-7793.1997.077bo.x. [DOI] [PMC free article] [PubMed] [Google Scholar]
- Isaacson JS, Walmsley B. Counting quanta: direct measurements of transmitter release at a central synapse. Neuron. 1995;15:875–884. doi: 10.1016/0896-6273(95)90178-7. [DOI] [PubMed] [Google Scholar]
- Ishikawa T, Takahashi T. Mechanisms underlying presynaptic facilitatory effect of cyclothiazide at the calyx of Held of juvenile rats. J Physiol. 2001;533:423–431. doi: 10.1111/j.1469-7793.2001.0423a.x. [DOI] [PMC free article] [PubMed] [Google Scholar]
- Kodama T, Itsukaichi-Nishida Y, Fukazawa Y, Wakamori M, Miyata M, Molnar E, Mori Y, Shigemoto R, Imoto K. A Cav2.1 calcium channel mutation rocker reduces the number of postsynaptic AMPA receptors in parallel fiber-Purkinje cell synapses. Eur J Neurosci. 2006;24:2993–3007. doi: 10.1111/j.1460-9568.2006.05191.x. [DOI] [PubMed] [Google Scholar]
- Lou X, Scheuss V, Schneggenburger R. Allosteric modulation of the presynaptic Ca2+ sensor for vesicle fusion. Nature. 2005;435:497–501. doi: 10.1038/nature03568. [DOI] [PubMed] [Google Scholar]
- Matsui K, Jahr CE. Ectopic release of synaptic vesicles. Neuron. 2003;40:1173–1183. doi: 10.1016/s0896-6273(03)00788-8. [DOI] [PubMed] [Google Scholar]
- Matsui K, Jahr CE. Differential control of synaptic and ectopic vesicular release of glutamate. J Neurosci. 2004;24:8932–8939. doi: 10.1523/JNEUROSCI.2650-04.2004. [DOI] [PMC free article] [PubMed] [Google Scholar]
- Matsushita K, Wakamori M, Rhyu IM, Arii T, Oda S-I, Mori Y, Imoto K. Bidirectional alterations in cerebellar synaptic transmission of tottering and rolling Ca2+ channel mutant mice. J Neurosci. 2002;22:4388–4398. doi: 10.1523/JNEUROSCI.22-11-04388.2002. [DOI] [PMC free article] [PubMed] [Google Scholar]
- Mittmann W, Kock U, Häusser M. Feed-forward inhibition shapes the spike output of cerebellar Purkinje cells. J Physiol. 2005;563:369–378. doi: 10.1113/jphysiol.2004.075028. [DOI] [PMC free article] [PubMed] [Google Scholar]
- Neher E, Sakaba T. Multiple roles of calcium ions in the regulation of neurotransmitter release. Neuron. 2008;59:861–872. doi: 10.1016/j.neuron.2008.08.019. [DOI] [PubMed] [Google Scholar]
- Nielsen TA, DiGregorio DA, Silver RA. Modulation of glutamate mobility reveals the mechanism underlying slow-rising AMPAR EPSCs and the diffusion coefficient in the synaptic cleft. Neuron. 2004;42:757–771. doi: 10.1016/j.neuron.2004.04.003. [DOI] [PubMed] [Google Scholar]
- Ogita K, Hirata K, Bole DG, Yoshida S, Tamura Y, Leckenby AM, Ueda T. Inhibition of vesicular glutamate storage and exocytotic release by Rose Bengal. J Neurochem. 2001;77:34–42. doi: 10.1046/j.1471-4159.2001.t01-1-00200.x. [DOI] [PubMed] [Google Scholar]
- Oliet SHR, Malenka RC, Nicoll RA. Two distinct forms of long-term depression coexist in CA1 hippocampal pyramidal cells. Neuron. 1997;18:969–982. doi: 10.1016/s0896-6273(00)80336-0. [DOI] [PubMed] [Google Scholar]
- Santamaria F, Tripp PG, Bower JM. Feedforward inhibition controls the spread of granule cell-induced Purkinje cell activity in the cerebellar cortex. J Neurophysiol. 2007;97:248–263. doi: 10.1152/jn.01098.2005. [DOI] [PubMed] [Google Scholar]
- Satake S, Saitow F, Yamada J, Konishi S. Synaptic activation of AMPA receptors inhibits GABA release from cerebellar interneurons. Nat Neurosci. 2000;3:551–558. doi: 10.1038/75718. [DOI] [PubMed] [Google Scholar]
- Satake S, Song S-Y, Cao Q, Satoh H, Rusakov DA, Yanagawa Y, Ling E-A, Imoto K, Konishi S. Characterization of AMPA receptors targeted by the climbing fiber transmitter mediating presynaptic inhibition of GABAergic transmission at cerebellar interneuron-Purkinje cell synapses. J Neurosci. 2006;26:2278–2289. doi: 10.1523/JNEUROSCI.4894-05.2006. [DOI] [PMC free article] [PubMed] [Google Scholar]
- Satake S, Song S-Y, Konishi S, Imoto K. Glutamate transporter EAAT4 in Purkinje cells controls intersynaptic diffusion of climbing fiber transmitter mediating inhibition of GABA release from interneurons. Eur J Neurosci. 2010;32:1843–1853. doi: 10.1111/j.1460-9568.2010.07469.x. [DOI] [PubMed] [Google Scholar]
- Savtchenko LP, Rusakov DA. Extracellular diffusivity determines contribution of high-versus low-affinity receptors to neural signalling. Neuroimage. 2005;25:101–111. doi: 10.1016/j.neuroimage.2004.11.020. [DOI] [PubMed] [Google Scholar]
- Savtchouk I, Liu SJ. Remodeling of synaptic AMPA receptor subtype alters the probability and pattern of action potential firing. J Neurosci. 2011;31:501–511. doi: 10.1523/JNEUROSCI.2608-10.2011. [DOI] [PMC free article] [PubMed] [Google Scholar]
- Schneggenburger R, Neher E. Intracellular calcium dependence of transmitter release rates at a fast central synapse. Nature. 2000;406:889–893. doi: 10.1038/35022702. [DOI] [PubMed] [Google Scholar]
- Sharp AA, O’Neil MB, Abbott LF, Marder E. Dynamic clamp: computer-generated conductances in real neurons. J Neurophysiol. 1993;69:992–995. doi: 10.1152/jn.1993.69.3.992. [DOI] [PubMed] [Google Scholar]
- Shigeri Y, Seal RP, Shimamoto K. Molecular pharmacology of glutamate transporters, EAATs and VGLUTs. Brain Res Rev. 2004;45:250–265. doi: 10.1016/j.brainresrev.2004.04.004. [DOI] [PubMed] [Google Scholar]
- Shimamoto K, Lebrun B, Yasuda-Kamatani Y, Sakaitani M, Shigeri Y, Yumoto N, Nakajima T. dl-threo-β-benzyloxyaspartate, a potent blocker of excitatory amino acid transporters. Mol Pharmacol. 1998;53:195–201. doi: 10.1124/mol.53.2.195. [DOI] [PubMed] [Google Scholar]
- Sims RE, Hartell NA. Differences in transmission properties and susceptibility to long-term depression reveal functional specialization of ascending axon and parallel fiber synapses to Purkinje cells. J Neurosci. 2005;25:3246–3257. doi: 10.1523/JNEUROSCI.0073-05.2005. [DOI] [PMC free article] [PubMed] [Google Scholar]
- Stevens CF, Wang Y. Facilitation and depression at single central synapses. Neuron. 1995;14:795–802. doi: 10.1016/0896-6273(95)90223-6. [DOI] [PubMed] [Google Scholar]
- Thomson AM. Facilitation, augmentation and potentiation at central synapses. Trends Neurosci. 2000;23:305–312. doi: 10.1016/s0166-2236(00)01580-0. [DOI] [PubMed] [Google Scholar]
- Wadiche JI, Jahr CE. Multivesicular release at climbing fiber-Purkinje cell synapses. Neuron. 2001;32:301–313. doi: 10.1016/s0896-6273(01)00488-3. [DOI] [PubMed] [Google Scholar]
- Wall MJ, Usowicz MM. Development of the quantal properties of evoked and spontaneous synaptic currents at a brain synapse. Nat Neurosci. 1998;1:675–682. doi: 10.1038/3677. [DOI] [PubMed] [Google Scholar]
- Wilson NR, Kang J, Hueske EV, Leung T, Varoqui H, Murnick JG, Erickson JD, Liu G. Presynaptic regulation of quantal size by the vesicular glutamate transporter VGLUT1. J Neurosci. 2005;25:6221–6234. doi: 10.1523/JNEUROSCI.3003-04.2005. [DOI] [PMC free article] [PubMed] [Google Scholar]
- Xu-Friedman MA, Regehr WG. Presynaptic strontium dynamics and synaptic transmission. Biophys J. 1999;76:2029–2042. doi: 10.1016/S0006-3495(99)77360-1. [DOI] [PMC free article] [PubMed] [Google Scholar]
- Zhou Q, Petersen CCH, Nicoll RA. Effects of reduced vesicular filling on synaptic transmission in rat hippocampal neurons. J Physiol. 2000;525:195–206. doi: 10.1111/j.1469-7793.2000.t01-1-00195.x. [DOI] [PMC free article] [PubMed] [Google Scholar]
- Zucker RS, Regehr WG. Short-term synaptic plasticity. Annu Rev Physiol. 2002;64:355–405. doi: 10.1146/annurev.physiol.64.092501.114547. [DOI] [PubMed] [Google Scholar]
Associated Data
This section collects any data citations, data availability statements, or supplementary materials included in this article.