

Abstract
Homeostatic metaplasticity, a fundamental principle for maintaining overall synaptic weight in the physiological range in neuronal networks, was demonstrated at the cellular and systems level predominantly for excitatory synaptic neurotransmission. Although inhibitory networks are crucial for regulating excitability, it is largely unknown to what extent homeostatic metaplasticity of inhibition also exists. Here, we employed intermittent and continuous transcranial magnetic theta burst stimulation (iTBS, cTBS) of the primary motor cortex in healthy subjects for induction of long-term potentiation (LTP)-like and long-term depression (LTD)-like plasticity. We studied metaplasticity by testing the interactions of priming TBS with LTP/LTD-like plasticity induced by subsequent test TBS. Changes in excitatory neurotransmission were measured by the input–output curve of motor-evoked potentials (IO-MEP), and changes in GABAAergic inhibitory neurotransmission by the IO of short-interval intracortical inhibition (IO-SICI, four conditioning stimulus intensities of 70–100% active motor threshold, interstimulus interval 2.0 ms). Non-primed iTBS increased IO-MEP, while non-primed cTBS decreased IO-MEP. Pairing of identical protocols (iTBS→iTBS, cTBS→cTBS) resulted in suppression of the non-primed TBS effects on IO-MEP, and pairing of different protocols (cTBS→iTBS, iTBS→cTBS) enhanced the test TBS effects on IO-MEP. While non-primed TBS did not result in significant changes of IO-SICI, iTBS→iTBS resulted in IO-SICI decrease, and cTBS→cTBS in IO-SICI increase compared with the non-primed conditions. The changes in SICI induced by priming TBS correlated with the changes in MEP induced by subsequent test TBS. Findings demonstrate that plasticity in both excitatory and inhibitory circuits in the human motor cortex are regulated by homeostatic metaplasticity, and that priming effects on inhibition contribute to the homeostatic regulation of metaplasticity in excitatory circuits.
Key points
Homeostatic metaplasticity is an important mechanism for maintaining overall synaptic weight of a neuronal network in the physiological range.
Homeostatic metaplasticity has been demonstrated, so far largely exclusively, for excitatory synaptic neurotransmission.
New non-invasive transcranial magnetic theta burst stimulation (TBS) experiments at the systems level of human motor cortex demonstrate for the first time that homeostatic metaplasticity is also present in inhibitory intracortical circuits.
In addition, manipulation of intracortical inhibition by priming TBS contributes to the homeostatic regulation of metaplasticity in the corticospinal excitatory pathway.
Findings are important for therapeutic applications of non-invasive brain stimulation that aim at correcting excitatory or inhibitory neurotransmission outside the physiological range in humans with neuropsychiatric disorders.
Introduction
Maintaining the balance between excitation and inhibition is essential for long-term stability and function of dynamic neural networks (Abbott & Nelson, 2000; Abraham, 2008). As plasticity of excitatory and inhibitory synaptic input to a neuron will change its overall excitability in opposite directions, alterations in synaptic strength need to be tightly controlled to keep neuronal excitability within the physiological range. Homeostatic metaplasticity, as formalized in the Bienenstock–Cooper–Munro theory of bidirectional synaptic plasticity (Bienenstock et al. 1982), provides one influential conceptual framework to solve this problem. It states that plasticity at a given synapse is bidirectional, resulting in either long-term potentiation (LTP) or long-term depression (LTD), and that the threshold for induction of LTP versus LTD of synapses is not stable but varies as a function of the history of postsynaptic activity: the synaptic modification threshold decreases at low level of previous integrated postsynaptic activity, favouring induction of LTP over LTD. Conversely, the threshold increases at a high level of recent postsynaptic activity, thereby favouring the probability of subsequent LTD over LTP (Bienenstock et al. 1982). Similar to homeostatic metaplasticity in animal experiments (Abraham & Tate, 1997; Abraham, 2008), studies in human primary motor cortex (M1) demonstrated homeostatic metaplasticity for corticospinal excitatory neural circuits, as indexed by changes in motor-evoked potential (MEP) amplitude (Iyer et al. 2003; Lang et al. 2004; Siebner et al. 2004; Ziemann et al. 2004; Müller et al. 2007; Hamada et al. 2008; Todd et al. 2009; Fricke et al. 2011; Gamboa et al. 2011). In contrast, very little is known to what extent a similar homeostatic regulation of plasticity also exists in inhibitory cortical circuits in humans. To the best of our knowledge, this has only been sparsely addressed: Siebner and colleagues (2004) found homeostatic regulation of 1 Hz repetitive transcranial magnetic stimulation (rTMS) after-effects on MEP amplitude by priming with anodal versus cathodal transcranial direct current stimulation, but they did not find consistent changes in short-interval intracortical inhibition (SICI), an index of GABAAergic synaptic neurotransmission in M1 (Kujirai et al. 1993; Ziemann et al. 1996a; Di Lazzaro et al. 2000; Ilic et al. 2002). Those authors concluded: ‘…results favour a direct homeostatic effect in the corticospinal output neurons rather than a homeostatic mechanism within intracortical interneuronal circuits’ (Siebner et al. 2004). Another study investigated the interactions of two transcranial magnetic theta burst stimulation (TBS) protocols and also demonstrated homeostatic regulation of MEP amplitude, but found no SICI metaplasticity (Doeltgen & Ridding, 2011b). Also in basic experiments, the issue of metaplasticity at inhibitory synapses has only been sparsely studied (Fischer et al. 1997; Edwards et al. 2008).
To address the issue of metaplasticity of excitatory and inhibitory neural circuits, and their interrelation, at the systems level of the human M1, we applied two consecutive sessions of TBS in healthy subjects. We selected TBS because it is capable of inducing LTP-/LTD-like plasticity in both corticospinal excitatory and intracortical inhibitory neural circuits of the stimulated cortex (Di Lazzaro et al. 2005, 2008a; Huang et al. 2005, 2007; Murakami et al. 2008; Suppa et al. 2008; Ziemann et al. 2008; McAllister et al. 2009). We studied the effects of intermittent (iTBS) and continuous (cTBS) TBS alone, and the interactions between priming TBS and test TBS applied 15 min later, on input–output curves (IOs) of MEP amplitude and SICI. We decided to measure IO-MEP rather than intracortial facilitation or short-interval intracortical facilitation, putative paired-pulse TMS markers of intracortical excitatory circuitry (Ziemann et al. 1996c, 1998b) because MEP amplitude is the best studied excitability marker in TBS studies, and because TBS had only weak or no effects on intracortical facilitation (Huang et al. 2005; Hasan et al. 2012) and short-interval intracortical facilitation (Doeltgen & Ridding, 2011b).
Our results show that homeostatic metaplasticity is a general principle in both corticospinal excitatory and intracortical inhibitory neural circuits in human M1, and that metaplasticity in corticospinal excitatory circuits can be explained, at least in part, by priming modulation of inhibitory control of these circuits.
Methods
Subjects
We studied 14 strictly right-handed healthy volunteers (four women; 21–42 years old; mean age, 27.6 ± 6.0 years). Handedness was assessed by the Edinburgh Handedness Inventory (Oldfield, 1971), and the mean laterality score was 95.3 ± 8.3%. Written informed consent was obtained from all subjects prior to participation. None of the participants had a history of neuropsychiatric disease or was on CNS-active drugs at the time of the experiments. The study was approved by the ethics committee of the Medical Faculty of the Goethe-University Frankfurt, and conformed to the latest version of the Declaration of Helsinki.
Electromyography (EMG) recordings
Participants were seated on a comfortable reclining chair. MEPs were recorded from the right first dorsal interosseous muscle (FDI) by surface EMG. Pairs of Ag–AgCl surface electrodes were placed on the muscle belly and the metacarpophalangeal joint of the index finger. The EMG raw signal was amplified, band-pass filtered (20 Hz–2 kHz; Counterpoint Mk2 electromyograph, Dantec, Denmark), then digitized with an analog-to-digital converter (micro1401, CED, Cambridge, UK) at a sampling rate of 5 kHz and stored on a laboratory computer. Later, these data were transferred to a personal computer for offline analysis.
TMS
TMS was applied by using two Magstim 200 magnetic stimulators (Magstim Co., Whitland, Dyfed, UK) connected through a BiStim Module (Magstim Co.) with a figure-of-eight coil (external loop diameters, 70 mm). The current waveform was monophasic. The stimulating coil was held tangentially to the skull with the coil handle pointing backwards and laterally 45 deg away from the anterior–posterior axis. The centre of the coil junction was placed over the M1 hand area of the left hemisphere. The ‘motor hot spot’ was determined as the site where TMS consistently elicited the largest MEPs from the right FDI. This coil position was marked on the scalp by a felt pen to ensure constant coil placement throughout the experiment. At the hot spot, the intensity to produce MEPs of, on average, 1 mV peak-to-peak amplitude (SI1 mV), was determined. Thereafter, the active motor threshold (AMT) was determined, which was defined as the minimum stimulus intensity that elicited small MEP amplitudes ≥200 μV in at least 5 out of 10 consecutive trials during a weak voluntary contraction of the right FDI (Rossini et al. 1999). Stimulus intensities are indicated as a percentage of the maximum stimulator output.
IO-MEP were measured by stimulation at six intensity levels, ranging from 90% to 140% of SI1 mV in steps of 10% SI1 mV. Ten stimuli were recorded at each intensity level in a randomized order of stimulus intensities. The inter-trial interval for these and all other measurements varied between 4.5 s and 5.5 s to limit anticipation of the next trial.
IO-SICI were measured using an established paired-pulse TMS protocol (Kujirai et al. 1993; Ziemann et al. 1996b). SICI was tested at an interstimulus interval (ISI) of 2.0 ms to study true GABAAergic synaptic neurotransmission and limit contamination by short-interval intracortical facilitation (Ziemann et al. 1996b; Fisher et al. 2002; Peurala et al. 2008). The intensity of the conditioning stimulus was set to four intensity levels, ranging from 70% to 100% AMT, while test stimulus intensity was adjusted throughout the experiment to maintain unconditioned MEPs of on average 1 mV in peak-to-peak amplitude. This is important because variation in unconditioned test MEP amplitude may result in SICI change (Sanger et al. 2001; Müller-Dahlhaus et al. 2008). These adjustments in test stimulus intensity were in general small, and are presented in Table 1 together with the mean unconditioned MEP amplitudes.
Table 1.
Unconditioned test MEP amplitudes (in mV) and test stimulus intensity (SI, in % max. stimulator output) in the IO-SICI measurements (mean ± SEM)
| B0 | B1 | P1 | P2 | F | p | ||
|---|---|---|---|---|---|---|---|
| Experiment 1 (n= 9) | |||||||
| Condition 1 | MEP | 1.11 ± 0.10 | 1.14 ± 0.18 | 1.29 ± 0.23 | 0.64 | 0.54 | |
| SI | 55.1 ± 2.6 | 54.4 ± 2.7 | 54.7 ± 2.7 | 1.93 | 0.18 | ||
| Condition 2 | MEP | 1.21 ± 0.13 | 1.17 ± 0.14 | 1.26 ± 0.21 | 0.24 | 0.79 | |
| SI | 55.0 ± 2.6 | 55.0 ± 2.6 | 54.8 ± 2.5 | 1 | 0.39 | ||
| Condition 3 | MEP | 1.26 ± 0.18 | 1.14 ± 0.15 | 1.46 ± 0.21 | 1.27 ± 0.15 | 0.96 | 0.43 |
| SI | 55.2 ± 2.7 | 55.2 ± 2.7 | 54.8 ± 2.6 | 54.8 ± 2.7 | 1.16 | 0.34 | |
| Condition 4 | MEP | 1.18 ± 0.15 | 1.25 ± 0.19 | 1.11 ± 0.17 | 1.23 ± 0.23 | 0.34 | 0.80 |
| SI | 55.4 ± 2.5 | 55.2 ± 2.4 | 55.4 ± 2.5 | 55.4 ± 2.5 | 1 | 0.41 | |
| Condition 5 | MEP | 1.04 ± 0.10 | 1.07 ± 0.12 | 0.99 ± 0.12 | 1.23 ± 0.25 | 0.63 | 0.60 |
| SI | 54.9 ± 2.7 | 54.4 ± 2.8 | 54.6 ± 2.9 | 54.7 ± 2.8 | 1.35 | 0.28 | |
| Condition 6 | MEP | 1.20 ± 0.14 | 1.18 ± 0.14 | 1.08 ± 0.13 | 1.09 ± 0.08 | 0.54 | 0.66 |
| SI | 54.2 ± 2.6 | 54.2 ± 2.6 | 54.4 ± 2.7 | 54.4 ± 2.7 | 0.18 | 0.91 | |
| Experiment 2 (n= 8) | |||||||
| Condition 1 | MEP | 1.06 ± 0.09 | 0.99 ± 0.12 | 1.02 ± 0.10 | 0.37 | 0.67 | |
| SI | 52.4 ± 3.7 | 52.1 ± 3.8 | 52.4 ± 3.7 | 1 | 0.39 | ||
| Condition 2 | MEP | 1.23 ± 0.09 | 1.19 ± 0.07 | 1.15 ± 0.07 | 0.62 | 0.55 | |
| SI | 52.4 ± 3.7 | 52.4 ± 3.7 | 52.4 ± 3.7 | 0 | 1 | ||
| Condition 3 | MEP | 1.30 ± 0.10 | 1.32 ± 0.11 | 1.44 ± 0.13 | 1.36 ± 0.16 | 0.33 | 0.80 |
| SI | 52.4 ± 3.7 | 51.9 ± 3.9 | 51.5 ± 4.0 | 51.9 ± 3.9 | 1 | 0.41 | |
| Condition 4 | MEP | 1.21 ± 0.11 | 1.33 ± 0.13 | 1.33 ± 0.09 | 1.23 ± 0.08 | 0.21 | 0.89 |
| SI | 52.3 ± 3.8 | 51.0 ± 3.4 | 51.6 ± 3.7 | 51.9 ± 3.7 | 0.85 | 0.49 | |
| Condition 5 | MEP | 1.11 ± 0.16 | 1.09 ± 0.09 | 1.06 ± 0.07 | 1.13 ± 0.10 | 1,05 | 0.39 |
| SI | 52.3 ± 3.7 | 52.6 ± 3.8 | 52.4 ± 3.8 | 52.9 ± 3.7 | 0.46 | 0.77 | |
| Condition 6 | MEP | 1.05 ± 0.11 | 0.96 ± 0.07 | 1.18 ± 0.09 | 1.20 ± 0.09 | 2,35 | 0.10 |
| SI | 51.4 ± 3.5 | 51.4 ± 3.3 | 51.1 ± 3.2 | 50.9 ± 3.6 | 0.83 | 0.49 | |
For experimental conditions 1–6 and time points (B0, B1, P1, P2), see Fig. 1. Note, that the unconditioned test MEP amplitudes did not change post-TBS in any of the experimental conditions (all P > 0.1) due to small adjustments of test stimulus intensity.
MEP, motor-evoked potential; SI, stimulus intensity.
Ten trials of paired-pulses at each conditioning stimulus intensity level and test stimulus alone conditions were recorded in a random order. SICI was calculated as the ratio of the mean conditioned MEP over the mean unconditioned test MEP (Kujirai et al. 1993; Ziemann et al. 1996b).
TBS
TBS over the left M1 hand area was applied using a MagPro X100 magnetic stimulator connected to a 75 mm figure-of-eight coil (MagVenture, Farum, Denmark). The current had a biphasic waveform with a pulse width of 280 μs. The stimulating coil was held tangentially to the skull with the coil handle pointing backwards and laterally 45 deg away from the anterior–posterior axis, and the second phase of the biphasic current was directed from medial–anterior to lateral–posterior in M1. TBS was applied largely in accord with previous studies (Huang et al. 2005; Ziemann et al. 2008). In brief, TBS consisted of a burst of three pulses at 50 Hz (20 ms inter-pulse interval), which was repeated at 240 ms intervals (i.e. repetition rate, 4.2 Hz). This is a slight deviation from the original TBS protocol in which the 50 Hz bursts were repeated at 200 ms intervals (i.e. repetition rate, 5 Hz; Huang et al. 2005). However, the repetition rate still falls well within the theta range (4–7 Hz), and the non-primed iTBS and cTBS effects on MEP amplitude closely replicated previous findings (see Results). iTBS consisted of 10 bursts of TBS train (30 pulses) repeated every 10 s for a total of 600 pulses. In cTBS, the TBS train was applied without interruption for a total of 600 pulses. Stimulus intensity was set at 70% (TBS70%AMT) or 80% (TBS80%AMT) AMT.
Experiment 1
Nine subjects (two women, seven men; mean age, 29.2 ± 6.9 years) participated in this experiment. We studied the effects of non-primed iTBS80%AMT and cTBS80%AMT, and examined the priming effects of iTBS80%AMT and cTBS80%AMT on a subsequent iTBS80%AMT or cTBS80%AMT protocol on IO-MEP and IO-SICI (Fig. 1A). In the conditions of non-primed TBS protocols (Conditions 1 and 2, Fig. 1A), baseline IO-MEP amplitudes and IO-SICI were recorded (Baseline 1, B1). Then iTBS or cTBS was applied, and IO-MEP amplitudes and IO-SICI recordings were performed immediately (Post 1, P1) and 15 min (P2) after the TBS application. In the conditions of TBS-primed TBS protocols (Conditions 3–6, Fig. 1A), baseline IO-MEP amplitudes and IO-SICI were additionally recorded before priming TBS (Baseline 0, B0). We examined the interactions of opposite TBS–TBS protocols (cTBS80%AMT-primed iTBS80%AMT and iTBS80%AMT-primed cTBS80%AMT, Conditions 3 and 4) and of identical TBS–TBS protocols (iTBS80%AMT-primed iTBS80%AMT and cTBS80%AMT-primed cTBS80%AMT, Conditions 5 and 6). The interval between priming TBS and test TBS was set at 15 min to allow for the examination of priming TBS effects on IO-MEP and IO-SICI at time point B1 (cf. Fig. 1A), and because previous studies using transcranial direct current stimulation indicated strong interactions between successive protocols at intervals of 10–20 min (Monte-Silva et al. 2010; Fricke et al. 2011). The six experimental conditions were run in a balanced pseudo-randomized crossover design with at least 1 week between successive sessions. All experiments in a given individual were performed at the same time of day in order to avoid inter-session variability due to diurnal effects (Sale et al. 2007; Ridding & Ziemann, 2010)
Figure 1. Experimental design.
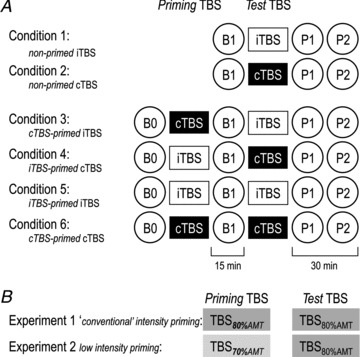
A, Experiments 1 and 2 each consisted of six experimental conditions: two non-primed theta burst stimulation (TBS) protocols (Conditions 1 and 2), and four TBS-primed TBS protocols (Conditions 3–6: white rectangles, intermittent TBS (iTBS); black rectangles, continuous TBS (cTBS)). IO-MEP amplitudes, a measure of corticospinal excitability, and IO-SICI, a measure of excitability of GABAAergic inhibitory neurons in motor cortex were recorded at each time point (circles, B0, B1, P1, P2). B, in Experiment 1, ‘conventional’ (Huang et al. 2005) priming and test TBS protocols (600 pulses at intensity of 80% AMT: TBS80%AMT) were used. In Experiment 2, low-intensity priming TBS (600 pulses at 70% AMT: TBS70%AMT) was followed by conventional test TBS (600 pulses at 80% AMT: TBS80%AMT).
Experiment 2
Eight subjects (three women, five men; mean age, 27.4 ± 4.7 years) participated in this experiment (three subjects had also participated in Experiment 1). The aim of this experiment was to investigate to what extent priming TBS that by itself does not induce overt change in corticospinal excitability has an influence on subsequent TBS-induced plasticity. The procedures and time lines of Experiment 2 were the same as in Experiment 1, except that a lower stimulus intensity of 70% AMT was used for the priming TBS protocols (Fig. 1B). This intensity was chosen because neither iTBS70%AMT nor cTBS70%AMT produced any change in MEP amplitude in a previous study (McAllister et al. 2009). We examined the interaction of opposite TBS–TBS protocols (cTBS70%AMT-primed iTBS80%AMT and iTBS70%AMT-primed cTBS80%AMT, Conditions 3 and 4) and of identical TBS–TBS protocols (iTBS70%AMT-primed iTBS80%AMT and cTBS70%AMT-primed cTBS80%AMT, Conditions 5 and 6). In addition, the effects of non-primed TBS80%AMT protocols (Conditions 1 and 2) were studied to compare the effects of the TBS70%AMT-primed TBS80%AMT protocols with those of non-primed ones. The interval between the priming and the second TBS was again set at 15 min, and the six experimental conditions were run in a balanced pseudo-randomized crossover design with at least 1 week between successive sessions.
Statistical analysis
Data were analysed using SPSS for Windows, version 20.0 (SPSS Inc., Chicago, IL 60606, USA). Generally, separate analyses were performed for the two different test TBS protocols (iTBS80%AMT, i.e. Conditions 1, 3 and 5 in Fig. 1A; cTBS80%AMT, i.e. Conditions 2, 4 and 6 in Fig. 1A) because we were interested in the interactions of a given test TBS protocol with different preceding priming TBS protocols.
To examine the effects of non-primed TBS80%AMT on IO-MEP and IO-SICI, absolute MEP amplitudes were analysed using two-way repeated-measures (rm)ANOVAs with time (B1, P1, P2: 3 levels) and intensity (IO-MEP: 6 levels; IO-SICI: 4 levels) as the within-subject factors.
To compare the primed with the non-primed TBS80%AMT effects on IO-MEP and IO-SICI, the individual MEP and SICI data at each level of stimulus intensity at time points P1 and P2 were normalized to those at B1 by calculating the ratios P1/B1 and P2/B1. The normalized data were analysed using three-way rmANOVAs with experimental condition (Conditions 1, 3 and 5 for iTBS80%AMT, Conditions 2, 4 and 6 for cTBS80%AMT: 3 levels), time (P1, P2: 2 levels) and intensity (IO-MEP: 6 levels; IO-SICI: 4 levels) as the within-subject factors.
In case of significant main effects or interactions, post hoc testing was performed using Fisher's PLSD test.
Metaplasticity was assessed further as follows: changes in SICI by priming TBS were indexed by averaging IO-SICI across the four intensities of the conditioning stimulus to get one SICI value per time point, experiment and subject, and then calculating the increment between time points B1 (after priming TBS) and B0 (before priming TBS): (SICIB1− SICIB0)/SICIB0. Similarly, changes in MEP were indexed by averaging IO-MEP across the six stimulation intensities to get one MEP value per time point, experiment and subject, and then calculating the increment between time points P1, P2 (after test TBS) and B1 (before test TBS): (MEPP1,P2– MEPB1)/MEPB1. Finally, to reveal the specific effects of priming TBS, ΔSICI and ΔMEP were calculated, i.e. the increments (SICIP1,P2– SICIB1)/SICIB1 and (MEPP1,P2– MEPB1)/MEPB1 induced by primed TBS minus non-primed TBS. The relation between ΔSICI and ΔMEP was tested by linear regression analyses. For this analysis, Conditions 3–6 in Fig. 1 were pooled.
IO-MEP amplitudes and IO-SICI at B1 (i.e. before test TBS80%AMT) were compared by two-way rmANOVAs with experimental condition (Conditions 1, 3 and 5 for iTBS80%AMT, Conditions 2, 4 and 6 for cTBS80%AMT: 3 levels) and intensity (IO-MEP: 6 levels, IO-SICI: 4 levels) as the within-subject effects, because differences in baseline excitability may contribute to any observed differential effects of priming TBS.
To study the effects of the low-intensity priming TBS protocols in Experiment 2, IO-MEP amplitudes and IO-SICI at B0 and B1 were also compared using three-way rmANOVAs with time (B0, B1: 2 levels), priming protocol (Conditions 4 and 5 in Fig. 1A for priming iTBS70%AMT, Conditions 3 and 6 in Fig. 1A for priming cTBS70%AMT: 2 levels) and intensity (IO-MEP: 6 levels; IO-SICI: 4 levels) as the within-subject factors.
Furthermore, the unconditioned test MEP amplitudes in the IO-SICI measurements at B0, B1, P1 and P2 were compared using one-way rmANOVAs with time as within-subject factor to ensure stable unconditioned MEPs throughout an experiment.
Finally, we investigated the influence of the priming TBS-induced changes in SICI on the test TBS effects on MEP amplitude by using correlation analyses to clarify the interrelation between intracortical inhibitory and corticospinal excitatory neural circuits. For this analysis, Conditions 3–6 in Fig. 1 were pooled. Changes in SICI by priming TBS were indexed by (SICIB1– SICIB0)/SICIB0, and changes in MEP by primed TBS were indexed by ΔMEP. Linear regression analyses were calculated for (SICIB1– SICIB0)/SICIB0 versusΔMEP. Additional linear regression analyses were performed for (MEPB1– MEPB0)/MEPB0 versusΔMEP to reveal any dependence of changes in MEP amplitude induced by primed TBS on those induced by priming TBS, and for (MEPB1– MEPB0)/MEPB0 versus (SICIB1– SICIB0)/SICIB0 to reveal concomitant changes in MEP amplitude and SICI induced by priming TBS. Indeed, we found significant correlations in these additional linear regression analyses (see Results). Therefore, a partial correlation was finally computed that removed the effects of (MEPB1– MEPB0)/MEPB0 from the correlation between (SICIB1– SICIB0)/SICIB0 and ΔMEP.
Mauchly's test was used to check for violation of sphericity in the rmANOVAs, and whenever Mauchly's W < 0.05 the degrees of freedom were adjusted using the Greenhouse–Geisser correction. In all tests, a value of P≤ 0.05 was considered to be statistically significant. All data were expressed as means ± standard error of the mean.
Results
No participant reported any adverse effects during or after the experiments.
Experiment 1 (TBS80%AMT-primed TBS80%AMT versus non-primed TBS80%AMT)
Baseline IO-MEP amplitudes at B1
A two-way rmANOVA of absolute IO-MEP amplitudes at B1 (iTBS Conditions 1, 3 and 5 in Fig. 1A) showed significant effects of experimental condition (F2,16= 5.73, P= 0.013; grand average MEP amplitude over all intensities, non-primed iTBS80%AMT= 2.08 ± 0.21 mV; cTBS80%AMT-primed iTBS80%AMT= 1.92 ± 0.20 mV; iTBS80%AMT-primed iTBS80%AMT= 2.60 ± 0.23 mV), but no interaction between experimental condition and intensity. Post hoc testing revealed significant differences between iTBS80%AMT-primed iTBS80%AMT and non-primed iTBS80%AMT (P= 0.023), but not between cTBS80%AMT-primed iTBS80%AMT and non-primed iTBS80%AMT (P= 0.48). Another two-way rmANOVA of absolute IO-MEP amplitudes at B1 (cTBS Conditions 2, 4 and 6 in Fig. 1A; grand average MEP amplitude over all intensities: non-primed cTBS80%AMT= 2.39 ± 0.22 mV; iTBS80%AMT-primed cTBS80%AMT= 2.76 ± 0.25 mV; cTBS80%AMT-primed cTBS80%AMT= 1.94 ± 0.23 mV) did not show significant effects of experimental condition (F2,16= 2.90, P= 0.08) or its interaction with intensity (F3.11,24.88= 1.48, P= 0.24).
These data provided part of the rationale for Experiment 2 (see below), which was designed to use low-intensity priming TBS in order to avoid significant changes in IO-MEP at B1 as a possible contaminating source for the priming TBS effects on the subsequent test TBS protocol.
Non-primed TBS effects on IO-MEP
A two-way rmANOVA of the non-primed iTBS80%AMT effects on IO-MEP showed a significant effect of time (F2,16= 5.58, P= 0.015). Post hoc comparisons revealed increased IO-MEP at both time points after non-primed iTBS80%AMT (P1 versus B1: P= 0.039; P2 versus B1: P= 0.005; Fig. 2A).
Figure 2. Effects of non-primed theta burst stimulation (TBS) on IO-motor-evoked potential (MEP; A and B, E and F) and IO-short-interval intracortical inhibition (SICI; C and D, G and H) in Experiment 1 (A–D) and Experiment 2 (E–H) at post-TBS time points P1 (black symbols) and P2 (grey symbols) versus baseline B1 (white symbols).
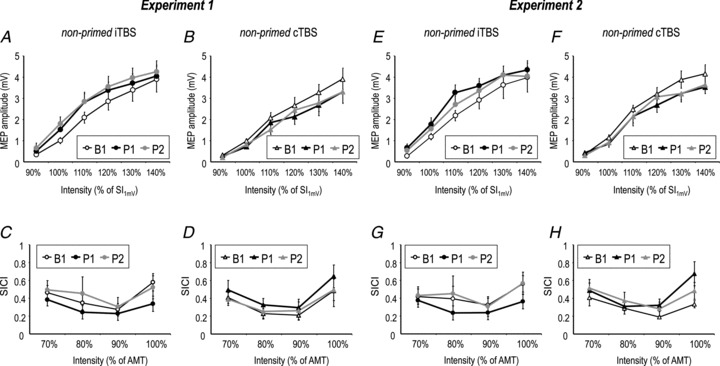
Note increase of IO-MEP after non-primed intermittent (i)TBS (A and E), decrease of IO-MEP after non-primed continuous (c)TBS (B and F), but no significant change of IO-SICI in any of the conditions (C and D, G and H). All data are means ± SEM. AMT. active motor threshold.
Similarly, a two-way rmANOVA of the non-primed cTBS80%AMT effects on IO-MEP revealed a significant effect of time (F2,16= 11.85, P < 0.001), and post hoc comparisons showed decreased IO-MEP at both time points after non-primed cTBS80%AMT (P1 versus B1: P < 0.001; P2 versus B1: P < 0.001; Fig. 2B).
These data replicate previous findings on the bidirectional change of MEP amplitude by iTBS versus cTBS (Huang et al. 2005; Suppa et al. 2008).
TBS-primed TBS effects on IO-MEP
A three-way rmANOVA on the comparison between TBS-primed iTBS effects and non-primed iTBS effects on IO-MEP demonstrated a significant effect of experimental condition (F2,16= 14.15, P < 0.001) and intensity (F2.28,11.4= 11.50, P < 0.001), and a significant interaction of experimental condition with intensity (F4.10,32.8= 5.40, P= 0.002), while time or any of its interactions were not significant (Fig. 3A). Post hoc comparisons revealed that cTBS80%AMT-primed iTBS resulted in significantly enhanced IO-MEP compared with non-primed iTBS (F1,8= 8.84, P= 0.018), while iTBS80%AMT-primed iTBS resulted in IO-MEP depression when compared with non-primed iTBS (F1,8= 9.62, P= 0.015). These differences were significant at several single stimulation intensities (indicated by asterisks in Fig. 3A).
Figure 3. Theta burst stimulation (TBS)-primed intermittent (i)TBS effects (A and C) and TBS-primed continuous (c)TBS effects (B and D) on IO-motor-evoked potential (MEP) in Experiment 1 (A and B) and Experiment 2 (C and D) expressed as IO-MEP averaged across time points P1 and P2 normalized to B1.
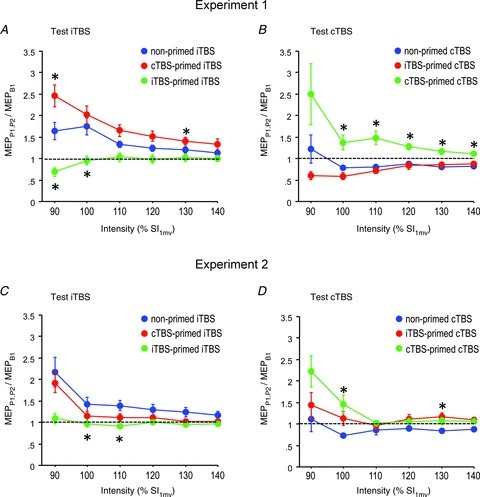
Red curves: opposite priming TBS and test TBS; green curves: identical priming and test TBS; blue curves: non-primed TBS (for comparison). Note homeostatic interactions with enhancement of non-primed TBS effects by opposite priming in Experiment 1, and suppression of non-primed TBS effects by identical priming in Experiments 1 and 2. All data are means ± SEM. Asterisks: P < 0.05 (comparison of TBS-primed TBS effects with non-primed TBS effects).
A three-way rmANOVA on the comparison between TBS-primed cTBS effects and non-primed cTBS effects on IO-MEP demonstrated a significant effect of Experimental condition (F2,16= 21.36, P < 0.001), while intensity (F1.22,9.76= 2.72, P= 0.13), the interaction of experimental condition with intensity (F1.62,12.96= 2.05, P= 0.17) and time or any of its interactions were not significant (Fig. 3B). cTBS80%AMT-primed cTBS versus non-primed cTBS resulted in a significant effect of experimental condition (F1,8= 25.88, P < 0.001), which was explained by a shift from MEP depression with non-primed cTBS to MEP potentiation with cTBS80%AMT-primed cTBS (Fig. 3B). In summary, the IO-MEP data are in accordance with homeostatic regulation of MEP amplitude in subsequent TBS protocols.
Baseline IO-SICI at B1
A two-way rmANOVA of IO-SICI at B1 (iTBS Conditions 1, 3 and 5 in Fig. 1A) did not show a significant effect of experimental condition (F2,16= 2.60, P= 0.11; grand average SICI over all intensities, non-primed iTBS80%AMT= 0.42 ± 0.04; cTBS80%AMT-primed iTBS80%AMT= 0.45 ± 0.06; iTBS80%AMT-primed iTBS80%AMT= 0.36 ± 0.05), or the interaction between experimental condition and intensity (F3.49,27.92= 0.87, P= 0.48). In contrast, the other two-way rmANOVA of IO-SICI at B1 (cTBS Conditions 2, 4 and 6 in Fig. 1A; grand average SICI over all intensities: non-primed cTBS80%AMT= 0.33 ± 0.05; iTBS80%AMT-primed cTBS80%AMT= 0.28 ± 0.04; cTBS80%AMT-primed cTBS80%AMT= 0.49 ± 0.07) showed a significant effect of experimental condition (F2,16= 6.84, P= 0.007) but not of its interaction with intensity (F1.86,14.88= 0.99, P= 0.39). Post hoc testing revealed a significant difference between non-primed cTBS80%AMT and cTBS80%AMT-primed cTBS80%AMT (P= 0.019), but not between non-primed cTBS80%AMT and iTBS80%AMT-primed cTBS80%AMT (P= 0.35).
Non-primed TBS effects on IO-SICI
A two-way rmANOVA of the effects of non-primed iTBS80%AMT on IO-SICI did not reveal significant effects of time (F2,16= 1.99, P= 0.17) or its interaction with intensity (F2.21,17.68= 1.26, P= 0.31; Fig. 2C). Similarly, non-primed cTBS80%AMT showed no effects of time (F2,16= 2.03, P= 0.16) or its interaction with intensity (F1.75,14= 0.20, P= 0.79; Fig. 2D).
TBS-primed TBS effects on IO-SICI
A three-way rmANOVA on TBS-primed iTBS versus non-primed iTBS effects (Conditions 1, 3 and 5 in Fig. 1A) on IO-SICI demonstrated a significant effect of experimental condition (F2,16= 5.71, P= 0.013), but not of its interactions with time or intensity (Fig. 4A). Post hoc comparisons revealed that iTBS80%AMT-primed iTBS resulted in significantly decreased IO-SICI compared with non-primed iTBS (P= 0.034), while cTBS80%AMT-primed iTBS was not significantly different from non-primed iTBS (P= 0.35). The other rmANOVA (Conditions 2, 4 and 6 in Fig. 1A) on IO-SICI also revealed a significant effect of experimental condition (F2,16= 6.54, P= 0.008), but not of its interactions with time or intensity (Fig. 4B). However, the post hoc tests did not show significant differences of IO-SICI after TBS80%AMT-primed cTBS compared with non-primed cTBS (cTBS-primed cTBS: P= 0.07; iTBS-primed cTBS: P= 0.10; Fig 4B).
Figure 4. Theta burst stimulation (TBS)-primed intermittent (i)TBS effects (A and C) and TBS-primed continuous (c)TBS effects (B and D) on IO-short-interval intracortical inhibition (SICI) in Experiment 1 (A and B) and Experiment 2 (C and D) expressed as IO-SICI averaged across time points P1 and P2 normalized to B1.
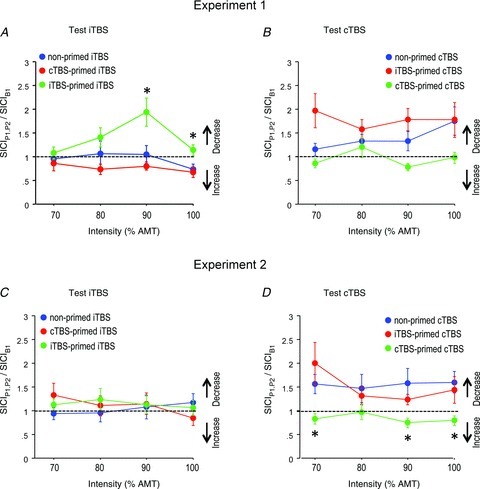
Red curves: opposite priming TBS and test TBS; green curves: identical priming and test TBS; blue curves: non-primed TBS (for comparison). Note homeostatic interactions with iTBS-primed iTBS leading to a decrease of IO-SICI when compared with non-primed iTBS in Experiment 1, and cTBS-primed cTBS leading to an increase in IO-SICI when compared with non-primed cTBS in Experiment 2. All data are means ± SEM. Asterisks: P < 0.05 (comparison of TBS-primed TBS effects with non-primed TBS effects).
Unconditioned MEPs in IO-SICI measurements of Experiments 1 and 2
Table 1 summarizes the unconditioned MEP amplitudes in all experimental conditions of Experiments 1 and 2. There were no effects of time in any of these experiments (all P > 0.10), and the targeted peak-to-peak amplitude of 1 mV was overall closely achieved. Thus, there was no variation of unconditioned MEP amplitude that could have contributed to the TBS-primed TBS effects on IO-SICI described above.
Correlation between ΔSICI and ΔMEP
Regression analysis revealed a significant negative linear correlation between ΔSICI and ΔMEP (Fig. 5; r=−0.46, P= 0.005), i.e. increases (decreases) in SICI (reflected by negative and positive ΔSICI, respectively) were associated with increases (decreases) in MEP. This provides additional evidence that there is parallel homeostatic regulation of excitability in a GABAAergic inhibitory intracortical circuit and in the excitatory corticospinal projection.
Figure 5. Negative linear correlation between Δshort-interval intracortical inhibition (SICI; x-axis) and Δmotor-evoked potential (MEP; y-axis) induced by primed TBS minus non-primed TBS in Experiment 1.
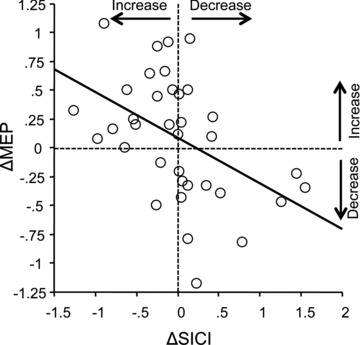
The thick line indicates the regression line.
Correlation of SICI change induced by priming TBS with ΔMEP induced by primed TBS
Linear regression of (SICIB1– SICIB0)/SICIB0 showed a significant positive correlation with ΔMEP (Fig. 6A; r= 0.61, P < 0.0001), i.e. a decrease (increase) in SICI by priming TBS80%AMT was associated with a positive (negative) ΔMEP.
Figure 6. Regression plots between changes in short-interval intracortical inhibition (SICI; x-axes) induced by priming TBS and changes in MEP amplitude (Δmotor-evoked potential (MEP), y-axes) induced by primed TBS minus non-primed TBS in Experiment 1 (A) and Experiment 2 (B).
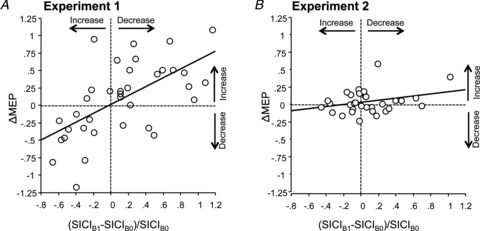
The thick lines indicate regression lines. Note the significant linear correlation between changes in SICI and ΔMEP in Experiment 1.
Linear regression analyses of (MEPB1– MEPB0)/MEPB0 versusΔMEP revealed a significant negative correlation (r=−0.64, P < 0.0001; data not shown). Similarly, linear regression analysis of (MEPB1– MEPB0)/MEPB0 versus (SICIB1– SICIB0)/SICIB0 also showed a significant negative correlation (r=−0.60, P < 0.0001; data not shown).
Finally, the partial correlation analysis that removed the effects of (MEPB1– MEPB0)/MEPB0 in the correlation of (SICIB1– SICIB0)/SICIB0 with ΔMEP still showed a significant positive correlation (r= 0.37, P= 0.027), strongly suggesting that changes in intracortical inhibitory circuits induced by priming TBS contribute to the control of homeostatic metaplasticity in the corticospinal excitatory pathway.
In contrast, the partial correlation analysis that removed the effects of (SICIB1– SICIB0)/SICIB0 in the correlation of (MEPB1– MEPB0)/MEPB0 with ΔSICI was not significant (P= 0.67). This nil result suggests that homeostatic metaplasticity of SICI is not a simple consequence of the changes in MEP amplitude induced by priming TBS.
Experiment 2 (TBS70%AMT-primed TBS80%AMT versus non-primed TBS80%AMT)
Baseline IO-MEP amplitudes at B1
A two-way rmANOVA of absolute IO-MEP amplitudes at B1 (iTBS Conditions 1, 3 and 5 in Fig. 1A; grand average MEP amplitudes across all intensities: non-primed iTBS80%AMT= 2.12 ± 0.23 mV; cTBS70%AMT-primed iTBS80%AMT= 2.61 ± 0.26 mV; iTBS70%AMT-primed iTBS80%AMT= 2.40 ± 0.23 mV) did not show significant main effects of experimental condition (F2,14= 0.94, P= 0.41) or its interaction with intensity (F2.09,14.63= 0.49, P= 0.63). Similarly, IO-MEP amplitudes at B1 (cTBS Conditions 2, 4 and 6 in Fig. 1A; grand average MEP amplitudes across all intensities: non-primed cTBS80%AMT= 2.57 ± 0.24 mV; iTBS70%AMT-primed cTBS80%AMT= 2.20 ± 0.20 mV; cTBS70%AMT-primed cTBS80%AMT= 2.24 ± 0.21 mV) did not show a significant effect of experimental condition (F2,14= 1.30, P= 0.30). The interaction of experimental condition with intensity was significant (F4.39,30.73= 3.42, P= 0.017), but there were no differences in MEP amplitude between experimental conditions at any single intensity (all P > 0.05). Therefore, Experiment 2 achieved the goal to avoid the significant IO-MEP baseline differences between experimental conditions in Experiment 1.
Effects of priming TBS70%AMT on IO-MEP (comparison of B1 with B0)
A three-way rmANOVA of priming iTBS70%AMT did not reveal an effect of time (B1 versus B0; grand average MEP amplitude over protocol and intensity, B1 = 2.30 ± 0.15 mV; B0 = 2.17 ± 0.14 mV), or the interactions of time with Protocol (iTBS70%AMT-primed cTBS80%AMT versus iTBS70%AMT-primed iTBS80%AMT) or intensity (all P > 0.3). Similarly, a three-way rmANOVA of priming cTBS70%AMT did not reveal an effect of time (B1 versus B0; grand average MEP amplitude over protocol and intensity, B1 = 2.42 ± 0.17 mV; B0 = 2.35 ± 0.16 mV), or the interactions of time with Protocol (cTBS70%AMT-primed iTBS80%AMT versus cTBS70%AMT-primed cTBS80%AMT) or intensity (all P > 0.4).
These nil findings confirm the data from one previous study that priming TBS70%AMT does not produce significant effects on MEP amplitude (McAllister et al. 2009) and indicate, in addition to the lack of difference of IO-MEP between experimental conditions at B1, that the observed effects of priming TBS70%AMT on subsequent TBS (see below) occurred in the absence of significant changes in corticospinal excitability induced by the priming protocol itself.
Non-primed TBS effects on IO-MEP
A two-way rmANOVA of the non-primed iTBS80%AMT effects on IO-MEP showed a significant effect of time (F2,14= 3.72, P= 0.05), and post hoc comparisons revealed increased IO-MEP at P1 after non-primed iTBS80%AMT (P1 versus B1: P= 0.017; P2 versus B1: P= 0.17; Fig. 2E).
Similarly, a two-way rmANOVA of the non-primed cTBS80%AMT effects on IO-MEP revealed a significant effect of time (F2,14= 4.02, P= 0.042), and post hoc comparisons showed decreased IO-MEP at both time points after non-primed cTBS80%AMT (P1 versus B1: P= 0.019; P2 versus B1: P= 0.047; Fig. 2F).
These data largely replicate the findings from Experiment 1.
TBS-primed TBS effects on IO-MEP
A three-way rmANOVA for the test iTBS protocols (Conditions 1, 3 and 5 in Fig. 1A) demonstrated significant effects of experimental condition (F2,14= 6.22, P= 0.012), intensity (F2.02,15.4= 11.81, P= 0.001), and the interaction between experimental condition, time and intensity (F3.58,25.03= 3.38, P= 0.043). Post hoc testing showed that IO-MEP between non-primed iTBS80%AMT and iTBS70%AMT-primed iTBS80%AMT were different (P= 0.003), while the difference between non-primed iTBS80%AMT and cTBS70%AMT-primed iTBS80%AMT was not significant (P= 0.11; Fig. 3C).
Another three-way rmANOVA for the test cTBS protocols (Conditions 2, 4 and 6 in Fig. 1A) demonstrated a significant effect of experimental condition (F2,14= 3.64, P= 0.05), but not of the interaction between experimental condition and intensity (F1.49,10.43= 2.31, P= 0.15). Post hoc testing showed that IO-MEP between non-primed cTBS80%AMT and cTBS70%AMT-primed cTBS80%AMT were different (P= 0.018), while the difference between non-primed cTBS80%AMT and iTBS70%AMT-primed cTBS80%AMT was not significant (P= 0.12; Fig. 3D).
In summary, these data are qualitatively different from Experiment 1 because the weaker priming TBS resulted only in suppression of the effects of a subsequent identical TBS protocol (iTBS70%AMT-primed iTBS80%AMT, cTBS70%AMT-primed cTBS80%AMT), but no longer in enhancement of the effects of a subsequent opposite TBS protocol (cTBS70%AMT-primed iTBS80%AMT, iTBS70%AMT-primed cTBS80%AMT).
Baseline IO-SICI at B1
A two-way rmANOVA of IO-SICI at B1 (iTBS Conditions 1, 3 and 5 in Fig. 1A) did not show a significant effect of experimental condition (F2,14= 0.27, P= 0.77; grand average SICI over all intensities, non-primed iTBS80%AMT= 0.43 ± 0.05; cTBS70%AMT-primed iTBS80%AMT= 0.38 ± 0.06; iTBS70%AMT-primed iTBS80%AMT= 0.41 ± 0.05), or the interaction between experimental condition and intensity (F2.71,18.97= 1.92, P= 0.17). Similarly, the other two-way rmANOVA of IO-SICI at B1 (cTBS Conditions 2, 4 and 6 in Fig. 1A; grand average SICI over all intensities: non-primed cTBS80%AMT= 0.32 ± 0.04; iTBS70%AMT-primed cTBS80%AMT= 0.34 ± 0.05; cTBS70%AMT-primed cTBS80%AMT= 0.49 ± 0.08) did not show a significant effect of experimental condition (F2,14= 2.67, P= 0.10) or of its interaction with intensity (F2.29,16.03= 0.57, P= 0.60). Therefore, there were no differences in IO-SICI at B1, which could have accounted for the TBS-primed TBS effects on IO-SICI (see below).
Effects of priming TBS70%AMT on IO-SICI (comparison of B1 with B0)
A three-way rmANOVA of priming iTBS70%AMT did not reveal an effect of time (B1 versus B0; grand average SICI over protocol and intensity, B1 = 0.38 ± 0.03; B0 = 0.41 ± 0.04), or of the interactions of time with Protocol (iTBS70%AMT-primed cTBS80%AMT versus iTBS70%AMT-primed iTBS80%AMT) or time with intensity (all P > 0.5). Similarly, a three-way rmANOVA of priming cTBS70%AMT did not reveal an effect of time (B1 versus B0; grand average SICI over protocol and intensity, B1 = 0.43 ± 0.03; B0 = 0.37 ± 0.04), or of the interactions of time with Protocol (cTBS70%AMT-primed iTBS80%AMT versus cTBS70%AMT-primed cTBS80%AMT) or time with intensity (all P > 0.15).
Non-primed TBS effects on IO-SICI
A two-way rmANOVA of the effects of non-primed iTBS80%AMT on IO-SICI did not reveal significant effects of time (F2,14= 3.52, P= 0.06) or its interaction with intensity (F6,42= 2.25, P= 0.06; Fig. 2G). Similarly, non-primed cTBS80%AMT showed no effects of time (F2,14= 2.53, P= 0.11) or its interaction with intensity (F3.06,21.42= 1.49, P= 0.25; Fig. 2H).
TBS-primed TBS effects on IO-SICI
A three-way rmANOVA on TBS-primed iTBS versus non-primed iTBS effects (Conditions 1, 3 and 5 in Fig. 1A) on IO-SICI did not show a significant effect of experimental condition (F2,14= 0.16, P= 0.86) or of its interactions with time or intensity (Fig. 4C). The other rmANOVA on TBS-primed cTBS versus non-primed cTBS effects (Conditions 2, 4 and 6 in Fig. 1A) on IO-SICI showed a significant effect of experimental condition (F2,14= 3.78, P= 0.049), but not of its interactions with time or intensity (Fig. 4D). Post hoc tests showed an increase of IO-SICI after cTBS70%AMT-primed cTBS80%AMT compared with non-primed cTBS80%AMT (P= 0.027), but no difference of IO-SICI after iTBS70%AMT-primed cTBS80%AMT compared with non-primed cTBS80%AMT (P= 0.85; Fig 4D).
Correlation between ΔSICI and ΔMEP
Regression analysis did not reveal a significant linear correlation between ΔSICI and ΔMEP (r=–0.14, P= 0.44).
Correlation of SICI change induced by priming TBS with ΔMEP induced by primed TBS
(SICIB1– SICIB0)/SICIB0 induced by priming TBS70%AMT did not correlate with ΔMEP induced by primed TBS minus non-primed TBS (Fig. 6B; r= 0.16, P= 0.37).
Discussion
This study provided two important novel findings at the systems level of human cerebral cortex. (1) Homeostatic metaplasticity regulates excitability not only of the excitatory corticospinal pathway but, in parallel, also of inhibitory intracortical neural circuits. Homeostatic metaplasticity could be demonstrated even in the absence of changes in IO-MEP or IO-SICI by priming TBS, suggesting true metaplasticity rather than, for example, depotentiation or de-depression (Abraham, 2008). (2) Changes in excitability of GABAAergic circuits by priming TBS correlated with the magnitude and direction of homeostatic metaplasticity of MEP amplitude, strongly suggesting a role of GABAAergic neurotransmission for controlling plasticity in excitatory corticospinal circuits.
Homeostatic regulation of excitatory plasticity (MEP amplitude)
MEP amplitude represents excitability of excitatory neurotransmission in the corticospinal projection (Hallett, 2007; Di Lazzaro et al. 2008b). Data in Experiment 1 are in full agreement with homeostatic regulation of MEP plasticity in two subsequent TBS protocols. This is in accord with several previous studies that demonstrated homeostatic regulation of MEP plasticity when using different plasticity-inducing non-invasive brain stimulation protocols or practice-dependent plasticity (Iyer et al. 2003; Lang et al. 2004; Siebner et al. 2004; Ziemann et al. 2004; Stefan et al. 2006; Müller et al. 2007; Hamada et al. 2008; Fricke et al. 2011). Gamboa and colleagues examined interactions of priming TBS – test TBS protocols at different intervals: two identical iTBS protocols at 5 and 20 min intervals resulted in significantly less MEP amplitude increase when compared with non-primed iTBS (Gamboa et al. 2011). Likewise, two identical cTBS protocols at 2 and 5 min intervals suppressed the MEP depression induced by non-primed cTBS or even resulted in a switch towards MEP potentiation (Gamboa et al. 2011). Another TBS study demonstrated that iTBS-primed cTBS results in a decrease of MEP amplitude, while non-primed cTBS did not alter MEP amplitude, also suggesting a homeostatic interaction between opposite priming TBS and test TBS protocols (Todd et al. 2009). At variance with those studies, one recent cTBS→cTBS study did not show any effect of non-primed cTBS80%AMT or cTBS80%AMT-primed cTBS80%AMT on MEP amplitude, and rather a non-homeostatic cTBS→cTBS interaction that resulted in a long-lasting MEP depression, if stimulus intensity was set to 70% resting motor threshold (Goldsworthy et al. 2012). That study suggested that voluntary activation of the target muscle for determination of AMT prior to TBS may be important for determining the quality of the TBS→TBS interaction. We always measured AMT prior to TBS and, with this setting, replicated and extended the findings of the majority of previous studies by demonstrating that interactions between identical TBS protocols are suppressive, whereas interactions of opposite TBS protocols enhance the non-primed TBS effects, supporting the idea of a general validity of homeostatic metaplasticity in regulating excitatory neuronal circuits in human M1.
The cellular mechanisms underlying these observations at the systems level naturally remain uncertain. Evidence in basic experiments supports a role for the NR2A/B subunit ratio in NMDA receptors with low ratios induced by low neuronal activity favouring LTP- over LTD-induction and vice versa (Philpot et al. 2007). NR2B-containing NMDA receptors carry more calcium charge per unit current than NR2A-containing NMDA receptors (Sobczyk et al. 2005). TBS-induced long-term changes in MEP amplitude can be prevented by NMDA receptor antagonists (Huang et al. 2007), and TBS-induced MEP potentiation switched to MEP depression under the influence of nimodipine, an L-type voltage-gated Ca2+ channel antagonist (Wankerl et al. 2010). Therefore, it is conceivable that priming iTBS increases the NR2A/B ratio and reduces calcium charge, leading to an increase of the threshold for induction of LTP-like plasticity (i.e. probability for LTP-induction decreases, probability for LTD-induction increases), while priming cTBS has the opposite effects. This line of thought will require further experimental testing, for example by pharmacological intervention with a Ca2+ channel antagonist, which is beyond the scope of this paper.
Homeostatic regulation of plasticity in intracortical inhibitory circuits
SICI at an ISI of 2.0 ms likely reflects excitability of GABAAergic synaptic neurotransmission (Ziemann et al. 1996b; Di Lazzaro et al. 2000; Peurala et al. 2008). Previous TBS studies showed that iTBS increases, whereas cTBS decreases SICI (Huang et al. 2005, 2008; Suppa et al. 2008), but these effects were not consistently found across all studies (Doeltgen & Ridding, 2011a,b; Hasan et al. 2012). To the best of our knowledge, only one study so far has tested the effects of priming TBS on primed TBS-induced changes in SICI, but did not find a significant interaction of iTBS-primed cTBS when compared with non-primed cTBS or non-primed iTBS (Doeltgen & Ridding, 2011b). Therefore, we describe here for the first time homeostatic metaplasticity of an inhibitory GABAAergic neuronal circuit of the human motor cortex. It should be noted that this homeostatic interaction was less expressed compared with homeostatic metaplasticity of MEP amplitude, as it was found only when testing the interaction of two identical but not two opposite TBS protocols (cf. Fig. 4). It could be argued that we did not describe homeostatic metaplasticity because priming TBS had no significant effect on IO-SICI. However, three important arguments are against this notion. (1) The study of metaplasticity is facilitated when the priming stimulation does not overtly alter the strength of synaptic transmission, but instead changes only the state of readiness of synapses to generate LTP or LTD later on (Abraham, 2008). If the priming resulted in overt change in synaptic strength (e.g. LTP), then it is difficult to sort out whether a lack of further LTP induction by test stimulation is caused by saturated LTP or mechanisms that generate LTP being actively inhibited. (2) Homeostatic metaplasticity of MEP amplitude occurs without effects of priming on MEP amplitude (see below). (3) The majority of previous studies showed an increase in SICI after iTBS, and a decrease by cTBS (Huang et al. 2005, 2008; Suppa et al. 2008). Therefore, it can be assumed that priming iTBS and cTBS in the present study were subthreshold for inducing a significant increase and decrease in IO-SICI, respectively. This is supported further by non-significant trends towards these results (cf. Fig. 4). In summary, it is very likely that the iTBS→iTBS and cTBS→cTBS interactions on IO-SICI represent homeostatic metaplasticity of GABAAergic neuronal circuitry in human M1. Finally, the significant correlation of ΔSICI with ΔMEP (Fig. 5) provides evidence that the homeostatic metaplasticity induced by two subsequent TBS protocols operates on excitability in the intracortical inhibitory circuit and the corticospinal projection in a parallel manner. This is consistent with previous findings that SICI and MEP amplitude also change in parallel after a single TBS train (Huang et al. 2005, 2008; Suppa et al. 2008).
The cellular and molecular mechanisms can only be speculated upon, and priming effects on LTP/LTD in inhibitory interneurons have only sparsely been studied. In rat hippocampus, LTD in inhibitory interneurons (inhibitory LTD, iLTD) was only elicited by high-frequency stimulation, if preceded by depolarization-induced suppression of inhibition (DSI; Edwards et al. 2008). The DSI priming effect is mediated by mobilization of the endocannabinoid system in postsynaptic pyramidal cells and a retrograde signalling mechanism acting on presynaptic CB1 receptors under conditions of sufficient intracellular Ca2+ concentration in the postsynaptic cells (Howlett et al. 2004). Whether or not such an interaction between excitatory postsynaptic cells and inhibitory presynaptic cells through retrograde signalling was responsible for the present findings is uncertain, but at least the iTBS-primed iTBS interaction on IO-SICI (cf. Fig. 4A) would be consistent with such a mechanism, by assuming that a priming iTBS-induced increase of activity in excitatory cells (Benali et al. 2011) resulted in enhanced iLTD-like plasticity by subsequent primed iTBS. Another possibility would certainly be homeostatic regulation of LTP-/LTD-like plasticity in inhibitory postsynaptic cells by their previous level of activity according to the Bienenstock–Cooper–Munro theory (Bienenstock et al. 1982).
In summary, the present findings strongly suggest for the first time that priming regulates plasticity in inhibitory interneurons in human M1 in accord with the principles of homeostatic metaplasticity.
Mechanisms of low- versus high-intensity priming TBS
Fundamental to the concept of metaplasticity is that the priming protocol by itself does not need to induce any changes in synaptic efficacy (Huang et al. 1992; Abraham & Tate, 1997; Wang & Wagner, 1999). Consistently, in human M1, plastic changes by the priming protocol are not necessary to induce homeostatic metaplasticity (Iyer et al. 2003; Hamada et al. 2008; Todd et al. 2009; Delvendahl et al. 2010). To address the question of metaplastic regulation of corticospinal and inhibitory intracortical circuits in the absence of any cortical excitability changes after the priming protocols, we used low-intensity priming at a stimulation intensity of 70%AMT in Experiment 2, which by itself did not alter the excitability of corticospinal excitatory or intracortical inhibitory circuits. Low-intensity 70%AMT TBS effects have been studied in only one other study, which, consistent with the present data, showed no effects of 70%AMT cTBS or iTBS on MEP amplitude, intracortical facilitation or short-interval intracortical facilitation (McAllister et al. 2009). In contrast with the present study, those authors found a rather selective short-lasting decrease of SICI after 70%AMT cTBS (but no change of SICI after 70%AMT iTBS). A lower excitation threshold of intracortical inhibitory circuits compared with the corticospinal system may explain this selective SICI modification (Kujirai et al. 1993; Ilic et al. 2002). Although the homeostatic interactions appeared more pronounced with the higher-intensity TBS80%AMT than low-intensity TBS70%AMT priming, this was not generally true, as the suppressive cTBS-primed cTBS interaction on IO-SICI was significant only with the lower-intensity TBS70%AMT priming (cf. Fig. 4B and D).
In addition, we observed that the homeostatic interactions on IO-MEP in Experiment 2 were only present when two identical TBS protocols were applied (cf. Fig. 3C and D), suggesting that homeostatic metaplasticity had a lower threshold in these conditions. This was not explained by any difference in the effects of priming TBS in experimental conditions with identical versus different TBS protocols (mean absolute (MEPB1-MEPB0)/MEPB0: 0.20 ± 0.06 versus 0.21 ± 0.05, P= 0.86). A parsimonious explanation may be given by the observation that iTBS increases the late I-waves but not the I1-wave (Di Lazzaro et al. 2008a), while cTBS suppresses predominantly the I1-wave (Di Lazzaro et al. 2005). If homeostatic metaplasticity as induced by subsequent TBS protocols occurs through homosynaptic mechanisms (Müller et al. 2007), then this would result in stronger interaction between identical protocols.
In summary, we provided evidence that homeostatic metaplasticity of corticospinal excitatory and intracortical inhibitory circuits in human cortex can be induced in the absence of any excitability changes in these circuits after priming TBS, thus supporting true metaplasticity, while other interactions between plasticity-inducing protocols, such as depotentiation or de-depression would require induction of LTP or LTD by the priming protocol (Abraham, 2008; Huang et al. 2010).
Inhibitory control of corticospinal plasticity
Excitability of inhibitory circuits is of significant importance for regulation of LTP/LTD in M1. In slices of rat motor cortex, LTP was significantly facilitated or could be induced only if the GABAAergic tone was reduced by local application of a GABAA receptor antagonist (Hess & Donoghue, 1994; Castro-Alamancos et al. 1995; Hess et al. 1996). In human M1, LTP-like plasticity induced by non-invasive brain stimulation was facilitated by disinhibition (Ziemann et al. 1998a), but reduced by GABAAergic drugs (Heidegger et al. 2010).
One previous study investigated the interactions between priming low-frequency (0.1 Hz) rTMS and subsequent paired associative stimulation (PAS; Delvendahl et al. 2010). Those authors showed that priming rTMS itself did not alter MEP amplitude but resulted in increased SICI. This effect was associated with occlusion of subsequent PAS-induced LTP-like and LTD-like plasticity and, therefore, provided supportive evidence for a critical role of GABAA-related excitability for controlling direction and amount of plasticity (Delvendahl et al. 2010). Our data significantly extend those observations by showing a linear correlation over the full range of changes in SICI induced by priming TBS80%AMT and changes in MEP amplitude induced by test TBS, i.e. decreases in SICI were associated with LTP-like increase in MEP amplitude by primed iTBS and even primed cTBS, while increases in SICI were associated with LTD-like decrease in MEP amplitude by primed cTBS and even primed iTBS (cf. Fig. 6A). These correlations were no longer significant with priming TBS70%AMT (Fig. 6B). This suggests a critical dependence of the expression of the controlling effect of inhibition on plasticity in the excitatory corticospinal projection on priming TBS intensity.
In conclusion, the present findings extend previous evidence of homeostatic metaplasticity in human M1 by demonstrating for the first time homeostatic metaplasticity of inhibitory intracortical circuits and corroborating the notion of a significant role for inhibitory mechanisms in controlling direction and magnitude of subsequent plasticity of the excitatory corticospinal projection. This opens up the opportunity to purposefully utilize priming to modify inhibitory control in order to direct metaplasticity in excitatory neural circuits to increase or decrease the probability of induction of LTP-/LTD-like plasticity.
Acknowledgments
T.M. is a fellow of the Alexander von Humboldt Foundation.
Glossary
- AMT
active motor threshold
- cTBS
continuous theta burst stimulation
- DSI
depolarization-induced suppression of inhibition
- EMG
electromyography
- FDI
first dorsal interosseous muscle
- iLTD
inhibitory long-term depression
- IO
input–output curve
- ISI
interstimulus interval
- iTBS
intermittent theta burst stimulation
- LTD
long-term depression
- LTP
long-term potentiation
- M1
primary motor cortex
- MEP
motor-evoked potential
- PAS
paired associative stimulation
- rTMS
repetitive transcranial magnetic stimulation
- SICI
short-interval intracortical inhibition
- TBS
theta burst stimulation
Author contributions
All experiments were performed in the motor cortex laboratory at the Department of Neurology, Goethe-University Frankfurt, Germany. T.M., F.M.D. and U.Z. contributed to conception and design of the experiments; all authors contributed to collection, analysis and interpretation of data, and to drafting the article or revising it critically for important intellectual content.
References
- Abbott LF, Nelson SB. Synaptic plasticity: taming the beast. Nat Neurosci. 2000;3:1178–1183. doi: 10.1038/81453. [DOI] [PubMed] [Google Scholar]
- Abraham WC. Metaplasticity: tuning synapses and networks for plasticity. Nat Rev Neurosci. 2008;9:387–399. doi: 10.1038/nrn2356. [DOI] [PubMed] [Google Scholar]
- Abraham WC, Tate WP. Metaplasticity: a new vista across the field of synaptic plasticity. Prog Neurobiol. 1997;52:303–323. doi: 10.1016/s0301-0082(97)00018-x. [DOI] [PubMed] [Google Scholar]
- Benali A, Trippe J, Weiler E, Mix A, Petrasch-Parwez E, Girzalsky W, Eysel UT, Erdmann R, Funke K. Theta-burst transcranial magnetic stimulation alters cortical inhibition. J Neurosci. 2011;31:1193–1203. doi: 10.1523/JNEUROSCI.1379-10.2011. [DOI] [PMC free article] [PubMed] [Google Scholar]
- Bienenstock EL, Cooper LN, Munro PW. Theory for the development of neuron selectivity: orientation specificity and binocular interaction in visual cortex. J Neurosci. 1982;2:32–48. doi: 10.1523/JNEUROSCI.02-01-00032.1982. [DOI] [PMC free article] [PubMed] [Google Scholar]
- Castro-Alamancos MA, Donoghue JP, Connors BW. Different forms of synaptic plasticity in somatosensory and motor areas of the neocortex. J Neurosci. 1995;15:5324–5333. doi: 10.1523/JNEUROSCI.15-07-05324.1995. [DOI] [PMC free article] [PubMed] [Google Scholar]
- Delvendahl I, Jung NH, Mainberger F, Kuhnke NG, Cronjaeger M, Mall V. Occlusion of bidirectional plasticity by preceding low-frequency stimulation in the human motor cortex. Clin Neurophysiol. 2010;121:594–602. doi: 10.1016/j.clinph.2009.09.034. [DOI] [PubMed] [Google Scholar]
- Di Lazzaro V, Oliviero A, Meglio M, Cioni B, Tamburrini G, Tonali P, Rothwell JC. Direct demonstration of the effect of lorazepam on the excitability of the human motor cortex. Clin Neurophysiol. 2000;111:794–799. doi: 10.1016/s1388-2457(99)00314-4. [DOI] [PubMed] [Google Scholar]
- Di Lazzaro V, Pilato F, Dileone M, Profice P, Oliviero A, Mazzone P, Insola A, Ranieri F, Meglio M, Tonali PA, Rothwell JC. The physiological basis of the effects of intermittent theta burst stimulation of the human motor cortex. J Physiol. 2008a;586:3871–3879. doi: 10.1113/jphysiol.2008.152736. [DOI] [PMC free article] [PubMed] [Google Scholar]
- Di Lazzaro V, Pilato F, Saturno E, Oliviero A, Dileone M, Mazzone P, Insola A, Tonali PA, Ranieri F, Huang YZ, Rothwell JC. Theta-burst repetitive transcranial magnetic stimulation suppresses specific excitatory circuits in the human motor cortex. J Physiol. 2005;565:945–950. doi: 10.1113/jphysiol.2005.087288. [DOI] [PMC free article] [PubMed] [Google Scholar]
- Di Lazzaro V, Ziemann U, Lemon RN. State of the art: physiology of transcranial motor cortex stimulation. Brain Stimul. 2008b;1:345–362. doi: 10.1016/j.brs.2008.07.004. [DOI] [PubMed] [Google Scholar]
- Doeltgen SH, Ridding MC. Low-intensity, short-interval theta burst stimulation modulates excitatory but not inhibitory motor networks. Clin Neurophysiol. 2011a;122:1411–1416. doi: 10.1016/j.clinph.2010.12.034. [DOI] [PubMed] [Google Scholar]
- Doeltgen SH, Ridding MC. Modulation of cortical motor networks following primed theta burst transcranial magnetic stimulation. Exp Brain Res. 2011b;215:199–206. doi: 10.1007/s00221-011-2886-6. [DOI] [PubMed] [Google Scholar]
- Edwards DA, Zhang L, Alger BE. Metaplastic control of the endocannabinoid system at inhibitory synapses in hippocampus. Proc Natl Acad Sci U S A. 2008;105:8142–8147. doi: 10.1073/pnas.0803558105. [DOI] [PMC free article] [PubMed] [Google Scholar]
- Fischer TM, Blazis DEJ, Priver NA, Carew TJ. Metaplasticity at identified inhibitory synapses in Aplysia. Nature. 1997;389:860–865. doi: 10.1038/39892. [DOI] [PubMed] [Google Scholar]
- Fisher RJ, Nakamura Y, Bestmann S, Rothwell JC, Bostock H. Two phases of intracortical inhibition revealed by transcranial magnetic threshold tracking. Exp Brain Res. 2002;143:240–248. doi: 10.1007/s00221-001-0988-2. [DOI] [PubMed] [Google Scholar]
- Fricke K, Seeber AA, Thirugnanasambandam N, Paulus W, Nitsche MA, Rothwell JC. Time course of the induction of homeostatic plasticity generated by repeated transcranial direct current stimulation (tDCS) of the human motor cortex. J Neurophysiol. 2011;105:1141–1149. doi: 10.1152/jn.00608.2009. [DOI] [PubMed] [Google Scholar]
- Gamboa OL, Antal A, Laczo B, Moliadze V, Nitsche MA, Paulus W. Impact of repetitive theta burst stimulation on motor cortex excitability. Brain Stimul. 2011;4:145–151. doi: 10.1016/j.brs.2010.09.008. [DOI] [PubMed] [Google Scholar]
- Goldsworthy MR, Pitcher JB, Ridding MC. The application of spaced theta burst protocols induces long-lasting neuroplastic changes in the human motor cortex. Eur J Neurosci. 2012;35:125–134. doi: 10.1111/j.1460-9568.2011.07924.x. [DOI] [PubMed] [Google Scholar]
- Hallett M. Transcranial magnetic stimulation: a primer. Neuron. 2007;55:187–199. doi: 10.1016/j.neuron.2007.06.026. [DOI] [PubMed] [Google Scholar]
- Hamada M, Terao Y, Hanajima R, Shirota Y, Nakatani-Enomoto S, Furubayashi T, Matsumoto H, Ugawa Y. Bidirectional long-term motor cortical plasticity and metaplasticity induced by quadripulse transcranial magnetic stimulation. J Physiol. 2008;586:3927–3947. doi: 10.1113/jphysiol.2008.152793. [DOI] [PMC free article] [PubMed] [Google Scholar]
- Hasan A, Hamada M, Nitsche MA, Ruge D, Galea JM, Wobrock T, Rothwell JC. Direct-current-dependent shift of theta-burst-induced plasticity in the human motor cortex. Exp Brain Res. 2012;217:15–23. doi: 10.1007/s00221-011-2968-5. [DOI] [PMC free article] [PubMed] [Google Scholar]
- Heidegger T, Krakow K, Ziemann U. Effects of antiepileptic drugs on associative LTP-like plasticity in human motor cortex. Eur J Neurosci. 2010;32:1215–1222. doi: 10.1111/j.1460-9568.2010.07375.x. [DOI] [PubMed] [Google Scholar]
- Hess G, Aizenman CD, Donoghue JP. Conditions for the induction of long-term potentiation in layer II/III horizontal connections of the rat motor cortex. J Neurophysiol. 1996;75:1765–1778. doi: 10.1152/jn.1996.75.5.1765. [DOI] [PubMed] [Google Scholar]
- Hess G, Donoghue JP. Long-term potentiation of horizontal connections provides a mechanism to reorganize cortical motor maps. J Neurophysiol. 1994;71:2543–2547. doi: 10.1152/jn.1994.71.6.2543. [DOI] [PubMed] [Google Scholar]
- Howlett AC, Breivogel CS, Childers SR, Deadwyler SA, Hampson RE, Porrino LJ. Cannabinoid physiology and pharmacology: 30 years of progress. Neuropharmacology. 2004;47(Suppl 1):345–358. doi: 10.1016/j.neuropharm.2004.07.030. [DOI] [PubMed] [Google Scholar]
- Huang Y-Z, Edwards MJ, Rounis E, Bhatia KP, Rothwell JC. Theta burst stimulation of the human motor cortex. Neuron. 2005;45:201–206. doi: 10.1016/j.neuron.2004.12.033. [DOI] [PubMed] [Google Scholar]
- Huang YY, Colino A, Selig DK, Malenka RC. The influence of prior synaptic activity on the induction of long-term potentiation. Science. 1992;255:730–733. doi: 10.1126/science.1346729. [DOI] [PubMed] [Google Scholar]
- Huang YZ, Chen RS, Rothwell JC, Wen HY. The after-effect of human theta burst stimulation is NMDA receptor dependent. Clin Neurophysiol. 2007;118:1028–1032. doi: 10.1016/j.clinph.2007.01.021. [DOI] [PubMed] [Google Scholar]
- Huang YZ, Rothwell JC, Edwards MJ, Chen RS. Effect of physiological activity on an NMDA-dependent form of cortical plasticity in human. Cereb Cortex. 2008;18:563–570. doi: 10.1093/cercor/bhm087. [DOI] [PubMed] [Google Scholar]
- Huang YZ, Rothwell JC, Lu CS, Chuang WL, Lin WY, Chen RS. Reversal of plasticity-like effects in the human motor cortex. J Physiol. 2010;588:3683–3693. doi: 10.1113/jphysiol.2010.191361. [DOI] [PMC free article] [PubMed] [Google Scholar]
- Ilic TV, Meintzschel F, Cleff U, Ruge D, Kessler KR, Ziemann U. Short-interval paired-pulse inhibition and facilitation of human motor cortex: the dimension of stimulus intensity. J Physiol. 2002;545.1:153–167. doi: 10.1113/jphysiol.2002.030122. [DOI] [PMC free article] [PubMed] [Google Scholar]
- Iyer MB, Schleper N, Wassermann EM. Priming stimulation enhances the depressant effect of low-frequency repetitive transcranial magnetic stimulation. J Neurosci. 2003;23:10867–10872. doi: 10.1523/JNEUROSCI.23-34-10867.2003. [DOI] [PMC free article] [PubMed] [Google Scholar]
- Kujirai T, Caramia MD, Rothwell JC, Day BL, Thompson PD, Ferbert A, Wroe S, Asselman P, Marsden CD. Corticocortical inhibition in human motor cortex. J Physiol. 1993;471:501–519. doi: 10.1113/jphysiol.1993.sp019912. [DOI] [PMC free article] [PubMed] [Google Scholar]
- Lang N, Siebner HR, Ernst D, Nitsche MA, Paulus W, Lemon RN, Rothwell JC. Preconditioning with transcranial direct current stimulation sensitizes the motor cortex to rapid-rate transcranial magnetic stimulation and controls the direction of after-effects. Biol Psychiatry. 2004;56:634–639. doi: 10.1016/j.biopsych.2004.07.017. [DOI] [PubMed] [Google Scholar]
- McAllister SM, Rothwell JC, Ridding MC. Selective modulation of intracortical inhibition by low-intensity theta burst stimulation. Clin Neurophysiol. 2009;120:820–826. doi: 10.1016/j.clinph.2009.02.003. [DOI] [PubMed] [Google Scholar]
- Monte-Silva K, Kuo MF, Liebetanz D, Paulus W, Nitsche MA. Shaping the optimal repetition interval for cathodal transcranial direct current stimulation (tDCS) J Neurophysiol. 2010;103:1735–1740. doi: 10.1152/jn.00924.2009. [DOI] [PubMed] [Google Scholar]
- Müller JFM, Orekhov Y, Liu Y, Ziemann U. Homeostatic plasticity in human motor cortex demonstrated by two consecutive sessions of paired associative stimulation. Eur J Neurosci. 2007;25:3461–3468. doi: 10.1111/j.1460-9568.2007.05603.x. [DOI] [PubMed] [Google Scholar]
- Müller-Dahlhaus JF, Liu Y, Ziemann U. Inhibitory circuits and the nature of their interactions in the human motor cortex: a pharmacological TMS study. J Physiol. 2008;586:495–514. doi: 10.1113/jphysiol.2007.142059. [DOI] [PMC free article] [PubMed] [Google Scholar]
- Murakami T, Sakuma K, Nomura T, Nakashima K, Hashimoto I. High-frequency oscillations change in parallel with short-interval intracortical inhibition after theta burst magnetic stimulation. Clin Neurophysiol. 2008;19:301–308. doi: 10.1016/j.clinph.2007.10.012. [DOI] [PubMed] [Google Scholar]
- Oldfield RC. The assessment and analysis of handedness: the Edinburgh inventory. Neuropsychologia. 1971;9:97–113. doi: 10.1016/0028-3932(71)90067-4. [DOI] [PubMed] [Google Scholar]
- Peurala SH, Müller-Dahlhaus JFM, Arai N, Ziemann U. Interference of short-interval intracortical inhibition (SICI) and short-interval intracortical facilitation (SICF) Clin Neurophysiol. 2008;119:2291–2297. doi: 10.1016/j.clinph.2008.05.031. [DOI] [PubMed] [Google Scholar]
- Philpot BD, Cho KK, Bear MF. Obligatory role of NR2A for metaplasticity in visual cortex. Neuron. 2007;53:495–502. doi: 10.1016/j.neuron.2007.01.027. [DOI] [PMC free article] [PubMed] [Google Scholar]
- Ridding MC, Ziemann U. Determinants of the induction of cortical plasticity by non-invasive brain stimulation in healthy subjects. J Physiol. 2010;588:2291–2304. doi: 10.1113/jphysiol.2010.190314. [DOI] [PMC free article] [PubMed] [Google Scholar]
- Rossini PM, Berardelli A, Deuschl G, Hallett M, Maertens de Noordhout AM, Paulus W, Pauri F. Applications of magnetic cortical stimulation. Electroencephalogr Clin Neurophysiol Suppl. 1999;52:171–185. [PubMed] [Google Scholar]
- Sale MV, Ridding MC, Nordstrom MA. Factors influencing the magnitude and reproducibility of corticomotor excitability changes induced by paired associative stimulation. Exp Brain Res. 2007;181:615–626. doi: 10.1007/s00221-007-0960-x. [DOI] [PubMed] [Google Scholar]
- Sanger TD, Garg RR, Chen R. Interactions between two different inhibitory systems in the human motor cortex. J Physiol. 2001;530.2:307–317. doi: 10.1111/j.1469-7793.2001.0307l.x. [DOI] [PMC free article] [PubMed] [Google Scholar]
- Siebner HR, Lang N, Rizzo V, Nitsche MA, Paulus W, Lemon RN, Rothwell JC. Preconditioning of low-frequency repetitive transcranial magnetic stimulation with transcranial direct current stimulation: evidence for homeostatic plasticity in the human motor cortex. J Neurosci. 2004;24:3379–3385. doi: 10.1523/JNEUROSCI.5316-03.2004. [DOI] [PMC free article] [PubMed] [Google Scholar]
- Sobczyk A, Scheuss V, Svoboda K. NMDA receptor subunit-dependent [Ca2+] signaling in individual hippocampal dendritic spines. J Neurosci. 2005;25:6037–6046. doi: 10.1523/JNEUROSCI.1221-05.2005. [DOI] [PMC free article] [PubMed] [Google Scholar]
- Stefan K, Wycislo M, Gentner R, Schramm A, Naumann M, Reiners K, Classen J. Temporary occlusion of associative motor cortical plasticity by prior dynamic motor training. Cereb Cortex. 2006;16:376–385. doi: 10.1093/cercor/bhi116. [DOI] [PubMed] [Google Scholar]
- Suppa A, Ortu E, Zafar N, Deriu F, Paulus W, Berardelli A, Rothwell JC. Theta burst stimulation induces after-effects on contralateral primary motor cortex excitability in humans. J Physiol. 2008;586:4489–4500. doi: 10.1113/jphysiol.2008.156596. [DOI] [PMC free article] [PubMed] [Google Scholar]
- Todd G, Flavel SC, Ridding MC. Priming theta-burst repetitive transcranial magnetic stimulation with low- and high-frequency stimulation. Exp Brain Res. 2009;195:307–315. doi: 10.1007/s00221-009-1791-8. [DOI] [PubMed] [Google Scholar]
- Wang H, Wagner JJ. Priming-induced shift in synaptic plasticity in the rat hippocampus. J Neurophysiol. 1999;82:2024–2028. doi: 10.1152/jn.1999.82.4.2024. [DOI] [PubMed] [Google Scholar]
- Wankerl K, Weise D, Gentner R, Rumpf JJ, Classen J. L-type voltage-gated Ca2+ channels: a single molecular switch for long-term potentiation/long-term depression-like plasticity and activity-dependent metaplasticity in humans. J Neurosci. 2010;30:6197–6204. doi: 10.1523/JNEUROSCI.4673-09.2010. [DOI] [PMC free article] [PubMed] [Google Scholar]
- Ziemann U, Corwell B, Cohen LG. Modulation of plasticity in human motor cortex after forearm ischemic nerve block. J Neurosci. 1998a;18:1115–1123. doi: 10.1523/JNEUROSCI.18-03-01115.1998. [DOI] [PMC free article] [PubMed] [Google Scholar]
- Ziemann U, Ilic TV, Pauli C, Meintzschel F, Ruge D. Learning modifies subsequent induction of LTP-like and LTD-like plasticity in human motor cortex. J Neurosci. 2004;24:1666–1672. doi: 10.1523/JNEUROSCI.5016-03.2004. [DOI] [PMC free article] [PubMed] [Google Scholar]
- Ziemann U, Lönnecker S, Steinhoff BJ, Paulus W. The effect of lorazepam on the motor cortical excitability in man. Exp Brain Res. 1996a;109:127–135. doi: 10.1007/BF00228633. [DOI] [PubMed] [Google Scholar]
- Ziemann U, Lönnecker S, Steinhoff BJ, Paulus W. Effects of antiepileptic drugs on motor cortex excitability in humans: a transcranial magnetic stimulation study. Ann Neurol. 1996b;40:367–378. doi: 10.1002/ana.410400306. [DOI] [PubMed] [Google Scholar]
- Ziemann U, Paulus W, Nitsche MA, Pascual-Leone A, Byblow WD, Berardelli A, Siebner HR, Classen J, Cohen LG, Rothwell JC. Consensus: motor cortex plasticity protocols. Brain Stimul. 2008;1:164–182. doi: 10.1016/j.brs.2008.06.006. [DOI] [PubMed] [Google Scholar]
- Ziemann U, Rothwell JC, Ridding MC. Interaction between intracortical inhibition and facilitation in human motor cortex. J Physiol. 1996c;496:873–881. doi: 10.1113/jphysiol.1996.sp021734. [DOI] [PMC free article] [PubMed] [Google Scholar]
- Ziemann U, Tergau F, Wassermann EM, Wischer S, Hildebrandt J, Paulus W. Demonstration of facilitatory I-wave interaction in the human motor cortex by paired transcranial magnetic stimulation. J Physiol. 1998b;511:181–190. doi: 10.1111/j.1469-7793.1998.181bi.x. [DOI] [PMC free article] [PubMed] [Google Scholar]