

Abstract
Spreading depolarizations (SDs) are slowly propagating waves of near-complete neuronal and glial depolarization. SDs have been recorded in patients with brain injury, and the incidence of SD significantly correlates with outcome severity. Although it is well accepted that the ionic dyshomeostasis of SD presents a severe metabolic burden, there is currently limited understanding of SD-induced injury processes at a cellular level. In the current study we characterized events accompanying SD in the hippocampal CA1 region of murine brain slices, using whole-cell recordings and single-cell Ca2+ imaging. We identified an excitatory phase that persisted for approximately 2 min following SD onset, and accompanied with delayed dendritic ionic dyshomeostasis. The excitatory phase coincided with a significant increase in presynaptic glutamate release, evidenced by a transient increase in spontaneous EPSC frequency and paired-pulse depression of evoked EPSCs. Activation of NMDA receptors (NMDARs) during this late excitatory phase contributed to the duration of individual neuronal depolarizations and delayed recovery of extracellular slow potential changes. Selectively targeting the NMDAR activation following SD onset (by delayed pressure application of a competitive NMDAR antagonist) significantly decreased the duration of cellular depolarizations. Recovery of dendritic Ca2+ elevations following SD were also sensitive to delayed NMDA antagonist application. Partial inhibition of neuronal energy metabolism converted SD into an irrecoverable event with persistent Ca2+ overload and membrane compromise. Delayed NMDAR block was sufficient to prevent these acute injurious events in metabolically compromised neurons. These results identify a significant contribution of a late component of SD that could underlie neuronal injury in pathological circumstances.
Key points
Spreading depolarization (SD) is a profound neuronal and glial depolarization implicated in the progression of acute brain injury.
In metabolically compromised tissue, SD can trigger irrecoverable injury; however, the underlying cellular mechanisms are not well established.
We investigated consequences of SD in hippocampal brain slices, using a combination of electrophysiological and single-cell imaging methods.
We characterized a brief period of prolonged NMDA receptor (NMDAR) activation after SD onset, which appeared to underlie extended Ca2+ elevations in dendrites.
Prolonged NMDAR activation was sufficient to cause injury after SD in metabolically compromised neurons, and therefore may contribute to deleterious consequences of SD in pathological conditions.
Introduction
Spreading depression was originally described as a slowly propagating suppression of electrocorticographic (ECoG) activity (Leao, 1944), and was subsequently characterized as a slowly propagating wave of near-complete cellular depolarization of neurons and glia (Somjen, 2001). Stimuli such as elevated potassium or ischaemia can cause localized depolarization of a volume of neurons and glia sufficient to trigger a propagating event, and result in a characteristic large slow-field potential shift. Accumulation of extracellular potassium and glutamate mediates the feedforward depolarization event as it spreads slowly (2–4 mm min−1) through grey matter (Somjen, 2001). Because suppression of ECoG activity is a consequence of the depolarizing event, the general term spreading depolarization (SD) is used in the current study to emphasize the underlying mechanism (see Dreier, 2011).
Recent clinical recordings confirm a relatively high incidence of SD in injured brain, and it is hypothesized that the cumulative metabolic burden of recovery from long-lasting depolarizations underlies neuronal injury in metabolically compromised tissue (Dreier, 2011; Lauritzen et al. 2011). Thus, SDs recorded from these tissue regions often show prolonged slow potential shifts (Shin et al. 2006; Oliveira-Ferreira et al. 2010; Takeda et al. 2011), the duration of which is correlated with the severity of injury (Oliveira-Ferreira et al. 2010; Hartings et al. 2011) and considered to be a useful parameter to assess damaging effects of SD. However, the cellular event(s) that contribute to pathologically long-lasting slow extracellular potential changes are not fully understood.
Previous studies have shown a significant contribution of NMDA-type glutamate receptors (NMDARs) to SD. Thus, NMDAR antagonists have been shown to inhibit initiation and/or propagation of SD in experimental models (Gill et al. 1992; Anderson & Andrew, 2002; Hartings et al. 2003; Faria & Mody, 2004; Peeters et al. 2007; Aiba et al. 2012), and a preliminary clinical study has suggested prevention of SD in injured brain with ketamine, a non-specific NMDAR antagonist (Sakowitz et al. 2009; Hertle et al. 2012). NMDAR antagonists have also been shown to reduce the duration of slow extracellular potential shifts, both in vitro and in vivo. The fact that NMDAR antagonists could selectively reduce the secondary phase of DC shifts without significantly affecting the initial phase has implied a role for NMDAR activation during the late-SD period (Marrannes et al. 1988; Herreras & Somjen, 1993a; Larrosa et al. 2006), but such activation has not been directly demonstrated.
Coordinated glutamate release and intracellular Ca2+ loading as a consequence of SD may be similar in many ways to excitotoxic events mediated by NMDAR stimulation. SD results in substantial intracellular neuronal Ca2+ transients, which recover fully in healthy tissue, but are irrecoverable when metabolic substrates are lacking (Kunkler & Kraig, 2004; Dietz et al. 2008; Gniel & Martin, 2010). However, the cellular events and Ca2+ sources responsible for conversion from recoverable to irrecoverable Ca2+ loading are not known. Previous studies identified dendritic compartments as likely initiation sites for excitotoxic injury in CA1 neurons (Connor et al. 1988; Wadman & Connor, 1992; Shuttleworth & Connor, 2001; Vander Jagt et al. 2008), and we examine here whether Ca2+ deregulation in dendrites may also be responsible for triggering NMDAR-dependent injury associated with SD.
In the current study we utilized whole-cell recordings to characterize a significant excitatory event following the initial depolarization of SD, generated in hippocampal area CA1 of murine brain slices. This excitatory period resulted in sustained NMDAR activation, and was responsible for prolonged Ca2+ elevations in dendrites. Suppression of this activity during the late phase of SD was sufficient to prevent neuronal injury in metabolically compromised neurons.
Methods
Ethical approval
All experimental protocols were approved by the Institutional Animal Care and Use Committee (IACUC) of the University of New Mexico.
Slice preparation
Brain slices were prepared from 53 adult (4- to 10-week-old) male C57BL/6 mice. For all experiments that involved pharmacological interventions, control and drug-treated slices from the same experimental animals were interleaved throughout the study. Animals were deeply anaesthetized by an injection (0.2 ml s.c.) of a ketamine–xylazine mixture (85 and 15 mg ml−1, respectively) and decapitated. Brains were quickly extracted into ice-cold cutting solution (in mm): KCl, 3; NaH2PO4, 1.25; MgSO4, 6; NaHCO3, 26; CaCl2, 0.2; glucose, 10; sucrose, 220; equilibrated with 95% O2–5% CO2, hemisected, and then 350 μm coronal corticohippocampal slices were prepared by using a vibratome. Slices were allowed to recover in artificial cerebrospinal fluid [ACSF; containing (in mm): NaCl, 126; KCl, 3; NaH2PO4, 1.25; MgSO4, 1; NaHCO3, 26; CaCl2, 2; glucose, 10; equilibrated with 95% O2–5% CO2] at 35°C for 1 h and then maintained in ACSF at room temperature until transfer to the recording chamber.
Generation of SD
Slices were maintained in a submerged chamber superfused with ACSF at 2 ml min−1 at 31–33°C. SD was generated in the hippocampal CA1 stratum radiatum subfield by local pressure ejection of 1 m KCl via micropipettes (1–5 μm tip diameter, 10–40 ms, 40 psi) using a picospritzer (Parker Hannifin, OH, USA). The ejection volume was estimated at ∼10 nl, based on CCD imaging and diameter measurements of ejected drops onto a glass coverslip. Such measurements could be reliably made from drops generated by 10 ejection pulses and comparison with a 1 μl standard. Electrophysiological recordings of SD were made from single CA1 pyramidal neurons and/or stratum radiatum for extracellular potentials, at locations > 200 μm from the KCl ejection site. Recording at this distance avoided contamination from the KCl microinjection, and ensured that recordings were of SD-associated events occurring > 3 s after propagation from the application site. In some experiments (Fig. 3), the effects of SD were assessed on responses evoked by stimulating Schaffer collateral inputs (0.1–0.4 mA, 70 μs) with a concentric bipolar electrode placed in stratum radiatum. Test stimuli that generated 30% of maximal amplitude responses were selected from input–output curves.
Figure 3. Increased release probability during the late-spreading depolarization (SD) phase as assessed from paired-pulse ratios (PPR).

A, representative trace of voltage-clamp recording during SD. Whole-cell current was recorded at −50 mV with bipolar stimulation of Shaffer-collaterals. Paired stimulation (100 ms interpulse interval) was delivered at 0.2 Hz, and evoked EPSCs appear as sharp vertical lines and are expanded in the insets (a–c). Note the reversed PPR and slow EPSC kinetics during the late-SD phase (b). B, quantitative analysis of PPR changes in control conditions (n= 8) and in the presence of dl-AP5 (20 μm, 10 min, n= 8). Data during the late-SD phase were collected from the initial three–five responses. dl-AP5 did not show any significant effects on PPR throughout the recordings. C, representative traces showing membrane responses to test pulses (−10 mV, 200 ms), and the waveform of single evoked EPSCs during baseline and in the late-SD phase. Note that the membrane response to the test pulse shows almost full recovery. On the other hand, kinetics of evoked EPSC was significantly slowed in the late-SD phase (see Results). sEPSCs occurring during the late-SD phase are indicated by arrowheads.
General recordings
Extracellular recordings were made from CA1 stratum radiatum, using glass microelectrodes filled with ACSF (0.5–1.0 MΩ) slowly advanced 50 μm below the slice surface. Extracellular DC potential was acquired at 2–10 kHz using a Multiclamp 700A amplifier, digitized (Digidata 1332) and analysed using pCLAMP 9.2 software (Molecular Devices, Sunnyvale, CA, USA).
Single-cell loading of fluorescent indicators and electrophysiological recordings were made using whole-cell clamp techniques and a Multiclamp 700A amplifier with CV-7B headstage (Molecular Devices). Single CA1 pyramidal neurons were visually identified and whole-cell access was established with low-resistance patch pipettes (1–2 MΩ) filled with a potassium gluconate-based internal solution containing (in mm): potassium gluconate, 135; NaCl, 8; MgCl2, 1; Na2ATP, 2; NaGTP, 0.3; Hepes, 10; EGTA, 0.05; pH 7.2 adjusted with KOH. Fluorescence indicators or blockers were supplemented to this standard solution depending on the specific experiments, as described in appropriate Methods and Results sections below. The quality of recordings was assessed by using the membrane test command of Clampex (Molecular Devices). Recorded CA1 pyramidal neurons had characteristic low input resistances (120.9 ± 6.6 MΩ), high capacitances (190.8 ± 8.3 pF) and Ih currents in response to hyperpolarizing voltage steps (n= 30).
Fluorescence imaging
Intracellular Ca2+ measurements were made from single CA1 pyramidal neurons as described previously with minor modifications (Vander Jagt et al. 2008). Indicator loading was via whole-cell pipettes filled with standard internal solution supplemented with low-affinity Ca2+ indicator, Fura-6F (0.5 mm; Life Technologies, Grand Island, NY, USA). Dialysis duration was strictly limited to either 3 or 5 min depending on the experiments (see Results), and electrodes were then carefully removed. The combination of high pipette indicator concentration and brief dialysis time typically resulted in a final intracellular indicator concentration of ∼100 μm, as determined by comparison with neurons extensively dialysed with test indicator concentrations. Because of its low affinity, the temporal and spatial dynamics of intracellular Ca2+ were unlikely perturbed by Fura-6F at this final intracellular concentration (Neher, 1995). Following indicator loading, neurons were allowed to recover for 10 min. During SD, Fura-6F fluorescence was monitored at its isobestic wavelength (360 nm), and focus was adjusted to maintain a segment of proximal apical dendrite in the focal plane. Fura-6F fluorescence also excited at 350, 380 nm for Ca2+ measurements, with the three excitation wavelengths each being delivered at 1 Hz from a monochromator (Polychrome V, Till Photonics GmbH, NY). Emission signals passed through a dichroic mirror (400 nm LP), band pass emission filter (510/35 nm) and were collected with a CCD camera (Till Imago), controlled by Till Vision software (Version 4.00). Intracellular Ca2+ dynamics were evaluated after generation of background-subtracted ratio images (350 nm/380 nm), and Ca2+ concentrations estimated by comparison with in vitro calibration standards (Life Technologies) and calculation using the equations described in (Grynkiewicz et al. 1985). Pseudo-colour images of estimated intracellular Ca2+ were prepared by applying a mask generated from filtered 380 or 350 nm fluorescence images to the raw pseudo-coloured ratio image. The kinetics of intracellular Ca2+ dynamics were obtained from regions of interest set within the soma and proximal apical dendrite (50–100 μm from soma).
In some experiments, neuronal morphology after SD was assessed in neurons loaded with Lucifer Yellow (Life Technologies). Internal solution was supplemented with 0.2% Lucifer Yellow, and fluorescence was excited at 410 nm excitation and long-pass filtered emission signals (> 420 nm) collected by CCD camera at 0.67 Hz. Loss of indicator was estimated by the relative change in fluorescence intensity from region within cell bodies.
Whole-cell electrophysiological recordings
Voltage-clamp recordings were made at −50 mV after liquid junction potential correction. The sodium channel blocker QX314 (5 mm) was included in the internal solution for all voltage-clamp recordings. A holding voltage of −50 mV (after 10 mV liquid junction potential correction) was chosen in order to enable simultaneous detection of spontaneous (s)EPSCs and SD currents. sEPSCs were detected with Mini analysis software (v. 6.0.3, Synaptosoft Inc., NJ, USA), using a high threshold (10 pA) in order to minimize detection of false positives. We excluded EPSCs detected during the initial 20 s following the onset of large SD currents, because input resistance and capacitance currents decreased to less than 10% of baseline levels, preventing reliable monitoring of recording quality. Except for this period, series resistance was maintained (< 20% variance) in successful recordings (see Fig. 3C). Recordings with >20% changes in series resistance or apparent voltage error during SD (as determined by readout of holding voltage and distortion of SD current waveform) were excluded from analysis.
All current-clamp recordings were made without any holding current applied (voltage-follower mode). In some recordings, test current pulses (−200 pA, 500 ms) were manually injected to monitor recovery of input resistance following SD. Current-clamp recordings with >20% changes in bridge balance or input resistance following recovery from SD were discarded.
Successful whole-cell recordings of SD required electrodes with relatively large tip diameters (>3 μm) and initial series resistances less than 20 MΩ, as determined by the membrane test in Clampex (Molecular Devices). SD involves tissue swelling, and therefore continuous fine adjustment of electrode position was needed throughout the whole-cell recordings. On the criteria described above, we obtained an overall success rate ∼50% for these whole-cell studies.
Extracellular potential changes during SD in our submerged slices (5–10 mV) were substantially smaller compared with previous reports from recordings from interface chambers, and were highly sensitive to the depth of electrodes. Thus, we did not apply any voltage correction to our recordings (whole-cell current and membrane potential), and acknowledge that cellular responses may be underestimated (Somjen, 2001). In addition, some voltage error also occurs during the large SD current (Hamann et al. 2002), and complicates absolute measurements of whole-cell currents. However, interpretation of the present data does not rely on absolute current and voltage changes, and series resistance and cellular capacitance measurements were similar between neurons throughout the study. For these reasons we did not apply any arithmetic corrections of data, and possible confounds are discussed in the appropriate Results section.
Drugs
All chemicals were obtained from Sigma-Aldrich (St Louis, MO, USA) unless otherwise noted. dl-AP5 was prepared as a 10 mm stock in water and stored at −20°C and used within 1 week of preparation.
Data analysis
Unless otherwise described, statistical analyses were made with Mann–Whitney U tests for two-group comparisons and Kruskal–Wallis tests with post hoc Dunn's multiple comparison test for additional group comparisons using GraphPad Prism version 4.03 (GraphPad Software, La Jolla, CA, USA) software. On bar graphs, individual data points are indicated by dots, together with mean ± SEM values. In experiments with repetitive measurements, data points from the same preparations are connected with dashed lines. A P value < 0.05 was considered statistically significant.
Results
NMDAR activation contributes to prolonged dendritic Ca2+ elevations following SD
Figure 1 shows intracellular Ca2+ dynamics in CA1 pyramidal neurons during and after SD. Single neurons were loaded with a low-affinity ratiometric Ca2+ indicator (Fura-6F, KD∼5 μm) via patch pipettes (final concentration approximately 100 μm following the brief loading period, see Methods). Following SD, large rises in intracellular Ca2+ concentration occurred initially in distal dendrites and then propagated toward the soma (Fig. 1A–C). Intracellular Ca2+ concentration returned first to baseline levels in soma, but Ca2+ remained at levels estimated above 10 μm in dendrites for significantly longer periods of time (∼2 min), before recovering to baseline levels (Fig. 1A and B show a representative example, and Fig. 1C shows mean data from eight neurons).
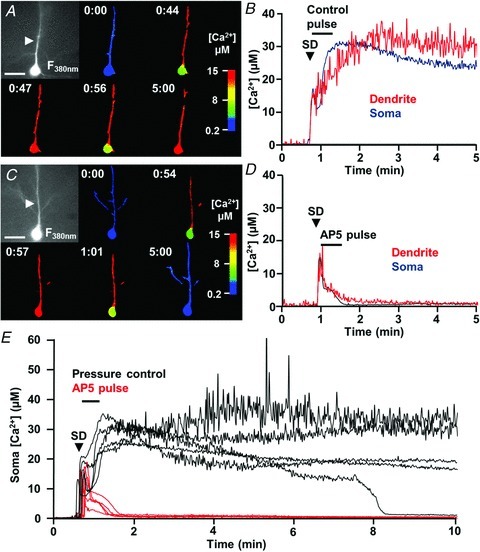
Figure 1. NMDAR activation contributes to prolonged dendritic Ca2+ loading after spreading depolarization (SD).

A–C, intracellular Ca2+ dynamics during SD monitored in single neurons loaded with Fura-6F in control conditions (n= 8). SD was generated by local microinjection of KCl (>200 μm from recorded neurons) and Fura-6F ratios were determined at 1 Hz. A, raw image of Fura-6F fluorescence (380 nm excitation, left panel, scale bar: 20 μm) and selected pseudo-coloured images representing intracellular Ca2+ levels at times indicated in minutes. Calculated Ca2+ concentrations from this neuron are shown in B (soma values in blue, dendrite values determined from region indicated by arrows are in red). C, mean data from eight such control experiments. D–F, as described above, except that slices were pre-exposed to 20 μm dl-AP5 for 10 min prior to SD (n= 7 for F). Note the rapid recovery of dendritic Ca2+ levels in AP5, despite the similar initial Ca2+ loading in soma and dendritic compartments.
The sustained dendritic Ca2+ elevations were highly sensitive to the competitive NMDAR antagonist dl-AP5. Figure 1D–F shows effects of bath application of a low concentration of dl-AP5 (20 μm). This concentration was chosen as it did not prevent the initiation and propagation of SD under these conditions (Aiba et al. 2012; see also Fig. 4). With bath application of dl-AP5, initial Ca2+ concentration increases at the soma were indistinguishable from those observed in control experiments [peak Ca2+ concentration, Control: 11.5 ± 0.8 μm (n= 8); dl-AP5: 12.5 ± 1.0 μm (n= 7), P > 0.1; Fig. 1C vs. 1F]; however, the durations of dendritic Ca2+ elevations were markedly shortened such that dendritic recovery was almost coincident with recovery in soma in the presence of dl-AP5 (Fig. 1E and F).
Figure 4. NMDAR antagonism accelerated repolarization and current decay of spreading depolarization (SD).
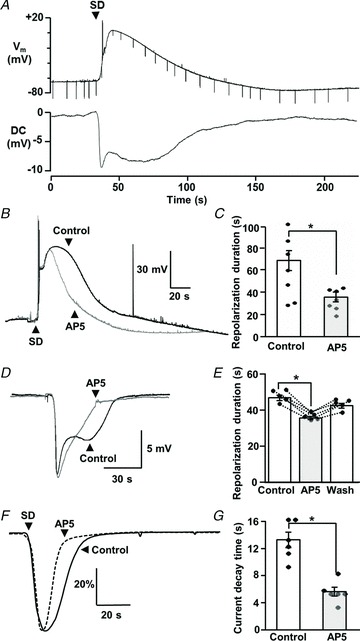
A, simultaneous recording of membrane potential (Vm) and extracellular DC potential changes associated with SD, demonstrating the extended neuronal depolarization during the late-SD phase. Test current pulses (−200 pA, 500 ms, downward deflections in Vm) were applied periodically throughout the recordings to monitor seal quality and assess input resistance changes. B, example traces from a single neuron, showing membrane depolarizations during a control SD and then during a second SD generated in dl-AP5 (20 μm, 10 min exposure, 20 min interval between SDs). dl-AP5 significantly decreased the duration of depolarization, and this effect was completely reversed following dl-AP5 washout in recordings from this neuron. C, mean data from similar experiments where the effects of dl-AP5 were tested in separate populations of control and AP5-treated preparations. Mean durations of 10–90% repolarization are presented (data pooled to give a total of seven recordings for each bar; two where repetitive SDs could be recorded from single neurons, and five from single SDs in each condition, *P < 0.05). D, example traces from a single slice, showing extracellular DC potential changes during a control SD and then during a second SD generated in dl-AP5 (20 μm, 10 min exposure, 20 min interval between SDs). E, mean data from five such experiments and showing reversibility after dl-AP5 washout. Duration was determined from the time to 70% recovery from the initial peak. *P < 0.05. F, dl-AP5 (20 μm, 10 min) also decreased the duration of large inward current during SD. SD currents were normalized to peak responses, and average waveforms from control (continuous line, n= 6) and dl-AP5 (dashed line, n= 6) are shown. Data were pooled to give a total of six recordings for each trace; three where repetitive SDs could be recorded from single neurons, and three from single SDs in each condition). G, mean data showing the time to 50% recovery from peak currents, in the population of neurons shown in F. *P < 0.05
Increased glutamate release during the repolarization phase of SD
To investigate the mechanism(s) underlying NMDAR-dependent dendritic Ca2+ loading, we first characterized excitatory synaptic inputs during the course of SD (Fig. 2). The baseline frequency of sEPSCs was low (0.9 ± 0.16 Hz, n= 9; Fig. 2Aa), and application of the SD stimulus resulted in an immediate increase in the frequency of sEPSCs that persisted until the arrival of SD at the recording electrode (20.4 ± 3.5 Hz, mean duration of prodromal period: 4.6 ± 0.9 s, n= 9; Fig. 2Ab). The arrival of SD was then detected as a large monophasic inward whole-cell current ∼3 s after stimulus application, with an accompanying initial rapid extracellular potential change. Input resistance decreased to ∼10% of baseline levels during the large inward current, preventing reliable measurements of sEPSCs during the early phase of SD.
Figure 2. Increased spontaneous (s)EPSC frequency following the initial depolarization of spreading depolarization (SD).
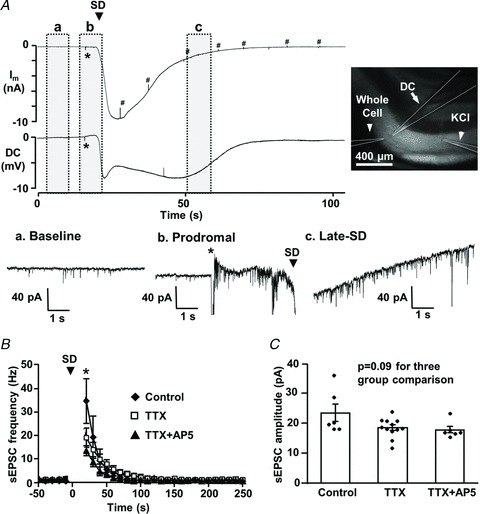
A, representative traces of simultaneous whole-cell current (Im: voltage-clamped at −50 mV) and extracellular DC potential recordings. SD was generated by local microinjection of KCl (> 200 μm from recording site, application time indicated by *), and was recorded from single pyramidal neuron and corresponding dendritic field. The image shows locations of the whole-cell patch pipette, extracellular DC recording electrode and KCl ejection pipette (highlighted by dashed lines). Traces in a–c show recordings from baseline (a), prodromal (b) and late-SD (c) phases of the whole-cell current at an expanded time base to show increases in sEPSC frequency associated with SD. Membrane responses to test pulses are marked by #. B, plot showing mean increases in sEPSC frequency associated with SD. In control conditions (closed diamonds, n= 6), sEPSC frequency to >30 Hz, and slowly recovered over the subsequent minute. Time was adjusted to the onset of SD (t= 0, indicated by arrowhead) and mean sEPSC frequency is shown in 10-s bins. sEPSC frequencies during the first 20 s after SD onset were excluded, because the quality of voltage-clamp could not be verified during the initial phase of the large SD current. TTX (open squares, n= 12) significantly reduced sEPSC frequency at time points indicated by asterisks (P < 0.05 compared with controls), but co-application of dl-AP5 did not further affect sEPSC frequency (closed triangles, n= 6, P >0.20). C, sEPSC mean amplitudes were not significantly altered when tested at the first time point shown after SD (asterisk in B).
sEPSCs reappeared during the decay of the SD current (Fig. 2Ac), and Fig. 2B emphasizes that the mean sEPSC frequency during the recovery from the large SD current was invariably greatly increased, before declining back to baseline levels. Figure 1B and C shows quantitative analyses of sEPSC frequency and amplitude during the late-SD phase. The increased sEPSC frequency was not due to the fact that sEPSC amplitudes were increased and allowed previously subthreshold events to be detected. In fact, the amplitudes of sEPSC were significantly decreased compared with baseline during the late-SD phase (baseline: 32.0 ± 3.6 pA; late-SD phase: 22.8 ± 2.8 pA, n= 9, P < 0.001), suggesting that the increased apparent EPSC frequency is largely attributable to increased presynaptic release.
In addition to increased sEPSC frequencies, we occasionally observed large (>1 nA) inward sEPSCs during the late-SD phase (data not shown). These events may be related to burst discharges reported following SD (see Discussion); however, these events were not reproducibly detected in the current study and were excluded from analysis.
Action potential-dependent release made a contribution to increased sEPSC frequencies. In a separate set of experiments, block of voltage-gated sodium channels with TTX (1 μm) prevented sEPSC frequency increases during the prodromal excitation phase (n= 12) and significantly reduced the frequency of events recorded immediately following the large SD current (Fig. 2B), with less effect on subsequent recovery to baseline. Activation of presynaptic NMDARs has been shown to increase release probability (Larsen et al. 2011; McGuinness et al. 2011); however, addition of dl-AP5 (20 μm) together with TTX did not significantly affect sEPSC frequency in the present study (Fig. 2B). TTX and dl-AP5 also had no significant effect on sEPSC amplitudes (Fig. 2C; P= 0.09). Thus, glutamate release during the late-SD phase appeared to be mediated by both action potential-dependent and -independent release mechanisms. The effect of dl-AP5 alone on sEPSC frequency was also analysed in a different set of experiments (used also to generate Fig. 4F and G, below) and was without effect (n= 6, P > 0.1). The lack of effect of dl-AP5 on sEPSC frequency also suggests that activation of postsynaptic NMDARs, rather than presynaptic NMDARs, are responsible for prolonged dendritic Ca2+ loading after SD.
Increased evoked release during the late-SD phase
Increased release probability following SD was confirmed from changes in paired-pulse ratio (PPR) of evoked EPSCs (Fig. 3). EPSCs could not be evoked during the SD inward current, but reappeared with greatly decreased PPR only after full recovery of the current (Fig. 3A and B). During this period, membrane responses to test pulses had recovered to control levels, but the rise times and decay time constants of evoked EPSCs were significantly increased (Fig. 3C; time to peak: 388.4 ± 33.5%; decay tau: 204.7 ± 20.0% of baseline, n= 8). Traces in the late-SD period were heavily contaminated with sEPSCs as discussed above (Fig. 3C). Bath application of dl-AP5 (20 μm) partially normalized the slow decay time constants of EPSCs during this period (151.7 ± 38.2%, n= 8, P < 0.05 vs. control), implying a role for NMDAR activation. Similar to lack of effects on sEPSC frequency, dl-AP5 did not affect changes in PPR associated with SD (Fig. 3B). Taken together with results of Fig. 2, these results suggest that both action potential-dependent and -independent release mechanisms can be enhanced during the late-SD phase.
Following the period of excitation, a prominent suppression of evoked activity occurred after SD (mean duration 5.14 ± 0.71 min, measured using 70% recovery as a threshold, n= 8). This secondary suppression is likely due to activation of adenosine A1 receptors (Lindquist & Shuttleworth, 2011). The present report concentrates only on consequences of increased NMDAR activation that occur earlier, immediately following the onset of SD.
NMDAR activation contributes to the duration of SDs
The relationship between single-cell membrane potential changes and extracellular DC potential shifts is shown in Fig. 4A. Similar to previous recordings with sharp electrodes (Canals et al. 2005), whole-cell recordings of KCl-induced SD in CA1 pyramidal neurons showed complete depolarization and full recovery took ∼1 min. The secondary phase of extracellular DC signals (i.e. the second maximum of the inverted saddle-like waveform) coincided with the slow single-neuron repolarization. Because no correction for extracellular voltage shifts was applied to single-cell recordings, neuronal depolarizations are likely underestimated (see Methods). Thus, during the late-SD phase, depolarization is expected to be sufficient to relieve Mg2+ block of NMDARs and, when coupled with increased glutamate release described above, should result in substantial NMDAR activation. This was confirmed in studies showing that bath application of dl-AP5 significantly decreased the duration of neuronal depolarization (Fig. 4B and C), without affecting peak depolarization (peak amplitudes: 0.79 ± 5.7 mV vs.−2.06 ± 6.6 mV, control and dl-AP5, respectively, P > 0.5, n= 7). Full washout of dl-AP5 effects was confirmed in two experiments where whole-cell recordings were maintained through three consecutive SDs. Furthermore, the duration of the secondary phase of extracellular DC shifts was also reversibly decreased by dl-AP5 application (Fig. 4D and E). Finally, the duration of the large inward current during SD was also significantly reduced by dl-AP5 (Fig. 4F and G). These experiments imply that NMDAR activation during the late-SD phase is an important contributor to the long-lasting neuronal depolarization.
Delayed antagonist applications confirmed a contribution of NMDAR activation during the late-SD phase
The results above suggested that increased release and consequent activation of NMDARs following the onset of SD could contribute to prolonged ionic deregulation. This possibility was first examined by testing the effects of localized application of dl-AP5 selectively in the period immediately following the onset of SD, when recording extracellular DC shifts (Fig. 5A–C). The antagonist was delivered with pressure pulses from glass micropipettes (5–10 μm diameter) placed close (< 20 μm) to the recording electrode. High pipette concentrations of NMDAR antagonists were used (500 μm dl-AP5 or 200 μm MK801) to obtain rapid onset and localized block, and in the first set of experiments the pulse application was initiated immediately following onset of the initial potential shift (Fig. 5A and B). In each experiment, a single SD (SD1) was first generated in the presence of the delivery electrode, but without drug ejection, and this was followed by a second SD (SD2) in which the antagonist was delivered with pressure pulses (20 ms, 10–15 repetitions at 1.5 Hz). Selective application of dl-AP5 immediately following SD significantly decreased the duration of extracellular potential changes, and similar results were obtained with MK801 (200 μm, duration SD2/SD1: 0.745 ± 0.004, P < 0.05 vs. vehicle, n= 5). Pressure pulses of vehicle solution (ACSF with 0.1% DMSO) showed no significant effect (Fig. 5A and C), indicating that any mechanical stress induced by the pressure pulses did not contribute to these effects. These results imply that NMDAR activation during the late-SD phase is a significant contributor to the secondary extracellular potential change.
Figure 5. NMDAR activation during the late-spreading depolarization (SD) period underlies prolonged ionic loads.

A–C, delayed pressure application of dl-AP5 (after the passage of SD) significantly decreased the duration of extracellular DC potentials. A, time control showing that the duration of DC shifts was reproducible when repetitive SDs were generated in a single slice. Localized pressure application of vehicle (0.1% DMSO, during time indicated by horizontal bar) during the second SD (grey trace) did not cause any reduction on DC response compared with the initial SD (black trace). B, in contrast, delayed dl-AP5 application significantly decreased the duration of the DC shift (grey trace), compared with the initial control response in the same slice (black trace). C, Mean data from five such vehicle and AP5 studies (**P < 0.01) D–F, delayed NMDAR block prevented prolonged dendritic Ca2+ loading after SD. D, raw image of Fura-6F fluorescence (380 nm excitation, left panel, scale bar: 20 μm) and selected pseudo-coloured images representing intracellular Ca2+ levels at times indicated in minutes. Calculated Ca2+ concentrations from this neuron are shown in E (soma values in blue, dendrite values determined from region indicated by arrows are in red). F, mean data from five such experiments. Horizontal bars indicate the duration of localized dl-AP5 applications.
We next tested the possibility that prolonged Ca2+ elevations described in Fig. 1 could be a consequence of NMDAR activation following SD, using the same localized dl-AP5 applications described above. This possibility was tested by localized pressure application of dl-AP5 only during the period of dendritic Ca2+ overload immediately following the onset of SD. As shown in Fig. 5D–F, sustained dendritic Ca2+ elevations were completely prevented by this approach. No effect was observed in control studies with ACSF-filled ejection electrodes (n= 3). These data suggest that NMDAR activation during the late-SD phase could underlie sustained dendritic Ca2+ loading.
NMDAR inhibition during the late-SD phase is protective against SD in energy-depleted neurons
We have previously reported that sustained dendritic Ca2+ elevations can be a key contributor to excitotoxic injury of neurons in slice (Shuttleworth & Connor, 2001), and in a model of NMDAR overactivation this can be due to energy depletion in these vulnerable compartments (Vander Jagt et al. 2008). We tested here whether the late-SD NMDAR activation could cause neuronal injury by a similar mechanism. We tested this hypothesis by increasing the vulnerability to SD-induced injury in single cells without changing the population response (and thereby the initiation or propagation of SD). This was done by dialysing single neurons with an internal solution containing an inhibitor of mitochondrial respiration (NaN3, sodium azide, in dialysis pipette) and reduced ATP. The composition of the pipette solution and dialysis duration was determined from a series of pilot experiments modifying both ATP and sodium azide concentrations during brief (3–5 min) application, to obtain conditions that induced metabolic stress, but did not alone cause acute injury. Dialysis (5 min) with internal solution containing 1 mm sodium azide and lacking any added ATP resulted in a significantly decreased input resistance (% change: −40.4 ± 5.0%vs.+1.1 ± 5.2%, azide vs. control, n= 5, P < 0.01), likely due to the activation of ATP-sensitive potassium currents (Sun et al. 2006). It is noted that equilibration of the pipette content and the cytosol would be incomplete with these short dialysis periods. No progressive depolarization or action potential bursts were observed with this dialysis and, in addition, basal Ca2+ concentrations were maintained at physiological levels until SD challenge (estimated Ca2+ concentration in soma: 0.170 ± 0.041 μm, n= 10).
Dialysis with the metabolic inhibitor greatly impaired recoverability from Ca2+ elevations after SD (Fig. 6). Thus, in control experiments, dendritic Ca2+ concentrations were sustained at high levels following initial Ca2+ increases (Fig. 6A and B), with no signs of recovery throughout the duration of recordings. Ca2+ levels in the soma showed some transient recovery after SD, but invariably increased again to very prolonged Ca2+ elevations above 10 μm (Fig. 6A and B). Under these conditions, four out of five neurons showed no recovery of soma or dendrite Ca2+ levels within 10 min (Fig. 6E). It is emphasized here that such prolonged Ca2+ deregulation was never observed in the neurons dialysed with a control internal solution (see Fig. 1A–C). Delayed application of dl-AP5 was very effective at preventing loss of Ca2+ homeostasis in these metabolically compromised neurons (Fig. 6C–E). Thus, in neurons dialysed with the metabolic inhibitor, late dl-AP5 exposure resulted in prompt and complete recovery of Ca2+ levels in both soma and dendrites (n= 5). When the same neurons were then challenged with another SD following dl-AP5 washout (>15 min), all cells generated sustained Ca2+ overloading similar to the pressure controls (n= 5).
Figure 6. Prolonged NMDAR activation contributes to neuronal injury in metabolically compromised neurons.
Energy metabolism of single neurons was partially inhibited by brief dialysis with sodium azide-containing internal solution, and Ca2+ responses during spreading depolarization (SD) were then evaluated. A, raw image of Fura-6F fluorescence (380 nm excitation, left panel, scale bar: 20 μm) and selected pseudo-coloured images representing intracellular Ca2+ levels at times indicated in minutes. Calculated Ca2+ concentrations from this neuron are shown in B (soma values in blue, dendrite values determined from region indicated by arrows are in red). Note that even though there was an initial transient recovery of somatic Ca2+ responses after the initial peak, sustained Ca2+ deregulation rapidly developed throughout the neuron after SD. C and D, same as described above for A and B, with the exception that dl-AP5 was applied locally to this selectively vulnerable neuron after the passage of SD. Note the prompt recovery of Ca2+ levels throughout the neuron. E, population data from control (black traces, n= 5) and dl-AP5-treated preparations (red traces, n= 5), showing the effectiveness of delayed dl-AP5 applications on neuronal Ca2+ overload, measured in somatic compartments of sodium azide-loaded neurons. Arrowhead indicates SD onset and the horizontal bar indicates the duration of vehicle (ACSF) or dl-AP5 pressure pulse applications.
Ca2+ deregulation following SD was associated with significant loss of the Ca2+ indicator, (Fura-6F), and this was suggestive of acute injury as discussed previously (Vander Jagt et al. 2008). However, reliable analyses of membrane permeability were difficult because of poor signal-to-noise ratio with the low Fura-6F concentrations used here, and background autofluorescence changes during SD. Therefore, a parallel set of studies was conducted with neurons loaded with the membrane-impermeable fluorescent indicator Lucifer Yellow (0.2% in NaN3 containing internal solution, hereafter termed LY). Indictor leak was assessed from fluorescence intensity in soma, and showed that profound loss of intracellular LY always occurred after SD in metabolically compromised neurons (Fig. 7A and C). This fluorescence loss was attributable to acute increase in membrane permeability, caused by NMDAR activation during the late-SD phase, rather than photobleaching or other detection artifact. Thus, indicator levels were well maintained by delayed NMDAR block after SD (localized pressure application of dl-AP5, as described above; Fig. 7B and C), and profound indicator loss was then observed in the same neurons after dl-AP5 washout and subsequent challenge with a second SD (Fig. 7C). These results suggest that the NMDAR activation that occurs specifically in the late phase of SD contributed to the development of Ca2+ overload and decreased membrane integrity in metabolically compromised neurons.
Figure 7. Prolonged NMDAR activation triggered significant membrane compromise in metabolically stressed neurons.

Single neurons were loaded with 0.2% Lucifer Yellow (LY) in sodium azide-containing internal solution, prior to spreading depolarization (SD) challenge. These neurons showed profound loss of intracellular LY following SD (A), but such loss was almost completely prevented by delayed dl-AP5 application (B). Localized dl-AP5 applications were as described above in Figs 5 and 6. A and B show representative fluorescence images from single neurons. C shows mean indicator loss measured 10 min after SD. Responses of four control neurons (white bar) are compared with four neurons that were protected with delayed dl-AP5 pulses, and then subjected to a second SD after dl-AP5 washout (grey bars, **P < 0.01 vs. control).
NMDAR activation contributes to extended depolarization of SD in energy-depleted preparations
We first examined the effect of partial metabolic inhibition on the duration of extracellular DC shifts and sensitivity to delayed NMDAR block. In each experiment, a pair of SDs was generated and slices were exposed to sodium azide prior to the second SD. The effects of delayed dl-AP5 application (or saline control) were tested on the second SD, using the localized pressure application method described above (Fig. 5). A series of pilot experiments was conducted, and determined that exposure to 1 mm sodium azide for 5 min prior to SD (and maintained throughout the experiment) was the maximum that could be tolerated without disrupting the initiation of SD. Under these conditions, the duration of extracellular potential shift was increased by sodium azide pre-exposure in all preparations tested with the saline control pulse (n= 5, 32.6 ± 3.6% increase from control, P < 0.005, paired t test; Fig. 8A and B). In contrast, delayed dl-AP5 pressure application prevented the prolongation of DC duration in sodium azide. The smaller effect of NaN3 on the duration of extracellular potential (compared with Ca2+ deregulation in Fig. 6) may be due in part to less severe metabolic inhibition compared with direct intracellular dialysis of azide without added ATP.
Figure 8. NMDAR activation contributes to extended depolarization of spreading depolarization (SD) in energy-depleted preparations.
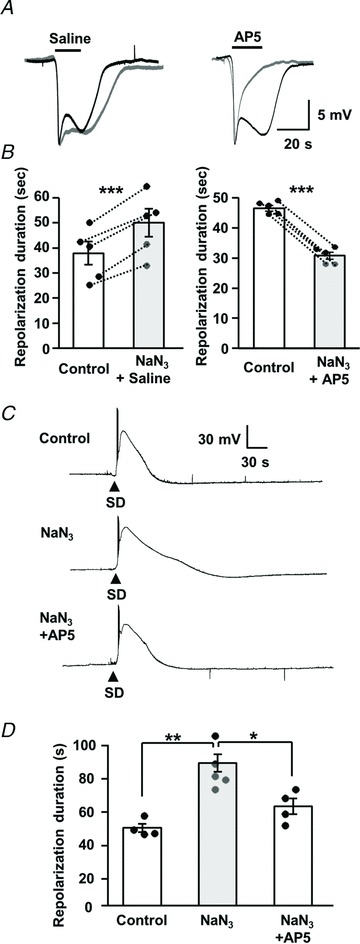
A and B, effects on extracellular DC potential shifts. A, in each panel, a pair of SDs was generated in a single slice. The first SD was without drug applications (black trace), and the second was in the presence of sodium azide (1 mm, 5 min pre-exposure, grey trace) and also included localized pressure application of either saline (left panels) or dl-AP5 (right panels, applications indicated by horizontal bars). B, mean data from five sets of each experiment shown in A, with DC durations measured at 70% recovery ***P < 0.005, paired t test. C and D, effects on single-cell depolarizations. C, representative traces under control conditions (top), in a neuron dialysed with sodium azide (middle; 300 μm, NaN3 in intracellular solution lacking ATP) and in an azide-loaded neuron with dl-AP5 bath application (bottom; 20 μm, 10 min exposure). Responses in each panel are from different preparations, recorded in consecutive experiments. D, mean durations of neuronal depolarization (10–90% repolarization) from experiments shown in C. The duration of neuronal depolarization was significantly extended by sodium azide dialysis (n= 5) compared with control (n= 4), and the effect was reversed by dl-AP5 (n= 4). *P < 0.01, *P < 0.05, one-way ANOVA with post hoc Turkey's multiple comparison test.
We next examined the effects of metabolic compromise and NMDAR activation on the duration of single-neuron depolarizations. We used a similar intracellular dialysis approach as described above (Figs 6 and 7), but with lower sodium azide concentrations so that whole-cell configuration could be maintained during dialysis and subsequent SD challenge (total ∼30 min recording). The composition of the pipette solution was determined from a series of pilot experiments modifying sodium azide concentrations (20 μm–1 mm) in ATP-free internal solution. From these studies, 300 μm was the maximal sodium azide concentration that could be used. Under these conditions, the durations of single-cell depolarizations were significantly increased (Fig. 8C and D). Delayed applications of high dl-AP5 concentrations could not be tested in these experiments, because of sensitivity to movement caused by pressure pulses. However, bath application of a moderate concentration of dl-AP5 (20 μm, 10 min, which was not sufficient to prevent SD; see above) significantly reduced the prolongation of depolarization in energy-depleted neurons (Fig. 8C and D). Together, these data are consistent with a role for NMDAR activation in prolonged depolarization and extracellular DC shifts in the context of metabolic compromise.
Discussion
General
The present study characterized an excitatory event during the recovery phase of SD that could contribute to neuronal injury. Our recordings of sEPSC frequency and PPR suggest that presynaptic glutamate release is enhanced during the late-SD phase, while neurons are still repolarizing. Both action potential-dependent and -independent mechanisms can contribute to enhanced release, and NMDAR activation during the late-SD phase contributed to extended neuronal depolarization. This excitatory event during the late-SD phase contributed to prolonged intracellular Ca2+ elevations in neuronal dendrites and (when combined with metabolic compromise) was sufficient to lead to neuronal injury. These findings identify a link between SD and excitotoxic signalling at the cellular level, and could suggest novel approaches to prevent conversion of SD to a damaging event in metabolically compromised tissue.
Characterization of a late excitatory phase of SD
sEPSC frequency was initially elevated during the brief prodromal excitation phase. During the large inward current of SD, a large reduction in membrane resistance hindered EPSC detection, but enhanced EPSCs were detected as soon as membrane resistance recovered (Fig. 2A). Thus, although not directly tested, these data leave open the possibility that presynaptic release probability was continuously elevated throughout the SD event. Significant NMDAR-dependent cation loading should be dependent on both release probability and the level of postsynaptic depolarization, and a substantial contribution would be expected during the late-SD phase when neurons remain partly depolarized and with significant gradients for ion influx.
The recorded increases in EPSC frequency likely reflect increased presynaptic release, rather than increased sensitivity of event detection due to changes in either input resistance or extracellular glutamate accumulation. Thus, in addition to increased EPSC frequencies observed after complete recovery of membrane resistance (see Fig. 3C), significant decreases in PPR (consistent with increased initial presynaptic release probability) were also demonstrated throughout the late-SD phase. It is noted that evoked synaptic transmission (requiring TTX-sensitive channels) was beginning to recover at an early time point (∼35 s in the example shown in Fig. 3A), when postsynaptic repolarizations were likely incomplete (see Figs 3 and 4; see also Canals et al. 2005). This early presynaptic recovery likely underlies the TTX sensitivity of sEPSCs seen in Fig. 2B. The mechanism(s) underlying increased release probability will be important to identify, and could include a combination of factors including presynaptic Ca2+ elevations and saturation of presynaptic Ca2+ buffers, as well as changes in extracellular osmolarity and potassium concentrations (Sara et al. 2002; Somjen, 2002; Blatow et al. 2003).
There have been several prior voltage-clamp recordings of SD, but none appeared to report an increase in release during the late-SD phase (Czeh et al. 1993; Zhou et al. 2010). It is possible that different experimental methods (including age of animals, and the use of local microinjection of KCl rather than bath applications to generate SD) might have made it easier to detect excitation during the late-SD phase in the present study. In addition, the lower recording temperatures required for these whole-cell recordings (31–33°C) may have made SD less intense, and thus facilitated recording of the late excitatory phase.
Spiking activity in the late-SD period has been observed in previous recordings using either extracellular or intracellular sharp microelectrode recordings from brain slices (e.g. Pomper et al. 2006), and also in vivo. Indeed, in his initial description of spreading depression of cortical activity, Leao (1944) noted a ‘burst of spikes following a slow negative wave’ and a burst of high-frequency electrical activity was also illustrated during the decay of extracellular potential in a study of cortical spreading depression in rodents (Takano et al. 2007). Bursting activity during the late-SD phase was also reported in a recent clinical study, detected as epileptic discharges occurring on the slow extracellular potential shift (Dreier et al. 2011). Residual postsynaptic depolarization alone could facilitate conversion of subthreshold postsynaptic potentials into spikes in the late-SD phase; however, coincident increases in presynaptic release probability could be a significant contributor in these other studies.
Prolonged NMDAR activation during the late-SD phase
NMDAR activation is well established to contribute to the initiation and/or spread of SD (see Introduction); however, it has not previously been clarified whether ongoing NMDAR activation can also contribute significantly to consequences of SD. This was investigated in the present study by using two approaches: (1) bath applications of a low concentration of NMDAR antagonist, that itself had no effect on SD initiation and propagation (see Aiba et al. 2012); and (2) focal delivery of NMDA antagonists, applied by pressure pulses only after the passage of SD past the recording site. These present studies revealed a brief (∼2 min), but important, period of NMDAR activation during the late-SD phase.
A persistent phase of NMDAR activation was also demonstrated during anoxic depolarizations generated by simulated ischaemia in hippocampal slices, although in that case reverse transport of glutamate under anoxic conditions appeared to be a major contributor (Rossi et al. 2000), rather than the increased synaptic glutamate release observed here with normoxic SD.
Recent work has shown that extended duration of DC shifts correlates with poor outcomes of brain trauma patients (Hartings et al. 2011). The present studies raise the possibility that NMDAR activation during the late-SD phase could contribute to these long events, based on the sensitivity to delayed antagonist application of secondary extracellular potential shifts. Interestingly, in the clinical recordings, it was noted that long-duration events were often accompanied by saddle-like waveforms (Hartings et al. 2011). The present results are consistent with the idea that activation of NMDARs during the late-SD phase could underlie saddle-like waveforms (see also Introduction). The simultaneous measurements of extracellular potential shifts and membrane potential (see Fig. 4A) suggest that the secondary phase of slow potential changes occurs during the repolarization phase of neuronal membrane potentials. Due to its non-selective cationic nature and voltage-dependent magnesium block (Spruston et al. 1995), charge transfer through NMDARs is expected to be minimal during complete depolarizations immediately following the arrival of SD, and then increase as neurons begin to repolarize (see Fig. 4A).
Extracellular potential shifts of SD are larger and are also more sensitive to NMDAR antagonists when recorded in hippocampal dendritic fields, when compared with recordings from the cell body layer (Herreras & Somjen, 1993b). Thus, NMDAR contributions to DC recordings in the neocortex may be complicated by the complexity of signal sources. Further studies are therefore needed to address the association of injurious NMDAR activation with extracellular potential durations and waveforms in clinical recordings.
Cellular mechanisms of injury
Large intracellular Ca2+ elevations during SD have been inferred from extracellular measurements of Ca2+ decreases following SD (Somjen, 2001), and are confirmed by more recent intracellular measurements (Kunkler & Kraig, 2004; Dietz et al. 2008; Gniel & Martin, 2010). Using the low-affinity indicator Fura-6F, it was shown that under normoxic conditions, recovery of intracellular Ca2+ elevations in CA1 neurons took substantially longer in dendritic compartments than in somata (Dietz et al. 2008). In the present work, it is shown that these sustained Ca2+ elevations are due to persistent NMDAR activation in the late-SD period.
Excessive cytosolic Ca2+ elevations are well established to lead to some forms of neuronal death, and small dendritic compartments may be important injury initiation sites (Connor et al. 1988, Shuttleworth & Connor 2001). Brief intensive glutamate receptor activation has been shown to trigger dendritic Ca2+ deregulation that propagates from dendrites, even in the absence of continued agonist stimulation (Wadman & Connor, 1992; Shuttleworth & Connor, 2001). A dendritic initiation site for excitotoxic injury was also observed with continuous NMDA exposures (Vander Jagt et al. 2008), and in that case propagation of dendritic Ca2+ overload was due to depletion of metabolic reserves and reversed by delayed NMDAR block (Vander Jagt et al. 2008). In other studies with glutamate microstimulation, a transition was observed between rapid recovery of dendritic Ca2+ elevations with single stimuli, and very prolonged or irrecoverable increases following repetitive stimulation (Connor & Cormier, 2000). SD shares some similarities with these prior excitotoxicity studies, as there was substantial glutamate release during the late-SD period, resulting in NMDAR activation and sustained dendritic Ca2+ elevations. These sustained dendritic Ca2+ elevations peaked ∼1 min following the onset of SD (Fig. 1A–C), during the period of neuronal repolarization.
When metabolic capacity was selectively reduced in a single cell (while permitting normal SD propagation), dendritic Ca2+ and somatic Ca2+ levels remained very high following SD, and neurons showed signs of acute neuronal injury (Figs 6 and 7). Severe increases in membrane permeability were verified by loss of the fluorophore Lucifer Yellow, and were almost completely prevented by selective application of an NMDAR antagonist during the late-SD phase. At least part of the effect is likely due to extended depolarization and additional Ca2+ influx, as metabolic inhibition also prolonged depolarization in an NMDA-dependent manner (Fig. 8). However, it is noteworthy that the durations of Ca2+ elevations were more severely prolonged than were the neuronal and extracellular depolarizations (compare Figs 6 and 8). Part of the reason for this mismatch could be a technical limitation, as it was not possible to achieve the same level of metabolic inhibition in the experiments in Fig. 8 (see Results). However, the duration of sustained Ca2+ elevations is also determined by Ca2+ extrusion rates. Reduction of extrusion rates is expected in metabolically compromised tissues, and this may contribute significantly to the duration of Ca2+ deregulation and neuronal injury demonstrated in Figs 6 and 7. These results suggest that consequences of NMDAR activation during the late-SD period could be a significant contributor to conversion of normally irrecoverable SD to irrecoverable injury observed in metabolically compromised tissue.
Conclusions
The present study provides a link between SD and cellular mechanisms of excitotoxic neuronal injury. Characterization of enhanced glutamate release during a period of postsynaptic vulnerability suggests temporal NMDAR targeting, and/or approaches other than NMDAR antagonists (e.g. targeting presynaptic release) may be considered to limit deleterious effects of SD in the injured brain.
Acknowledgments
We thank Drs J. A. Connor, D. L. Partridge and C. F. Valenzuela for critical feedback on an earlier version of this study. This research was supported by National Institutes of Health grant NS051288 (C.W.S) and American Heart Association grant 11PRE4870002 (I.A.).
Glossary
- ACSF
artificial cerebrospinal fluid
- ECoG
electrocorticographic
- Im
whole-cell current
- NMDAR
NMDA receptor
- PPR
paired-pulse ratio
- SD
spreading depolarization
- sEPSC
spontaneous EPSC
- Vm
membrane potential
Author contributions
I.A. and C.W.S. conceived and designed the experiments, and wrote the paper. I.A. performed the experiments and analysis.
References
- Aiba I, Carlson AP, Sheline CT, Shuttleworth CW. Synaptic release and extracellular actions of Zn2+ limit propagation of spreading depression and related events in vitro and in vivo. J Neurophysiol. 2012;107:1032–1041. doi: 10.1152/jn.00453.2011. [DOI] [PMC free article] [PubMed] [Google Scholar]
- Anderson TR, Andrew RD. Spreading depression: imaging and blockade in the rat neocortical brain slice. J Neurophysiol. 2002;88:2713–2725. doi: 10.1152/jn.00321.2002. [DOI] [PubMed] [Google Scholar]
- Blatow M, Caputi A, Burnashev N, Monyer H, Rozov A. Ca2+ buffer saturation underlies paired pulse facilitation in calbindin-D28k-containing terminals. Neuron. 2003;38:79–88. doi: 10.1016/s0896-6273(03)00196-x. [DOI] [PubMed] [Google Scholar]
- Canals S, Makarova I, Lopez-Aguado L, Largo C, Ibarz JM, Herreras O. Longitudinal depolarization gradients along the somatodendritic axis of CA1 pyramidal cells: a novel feature of spreading depression. J Neurophysiol. 2005;94:943–951. doi: 10.1152/jn.01145.2004. [DOI] [PubMed] [Google Scholar]
- Connor JA, Cormier RJ. Cumulative effects of glutamate microstimulation on Ca2+ responses of CA1 hippocampal pyramidal neurons in slice. J Neurophysiol. 2000;83:90–98. doi: 10.1152/jn.2000.83.1.90. [DOI] [PubMed] [Google Scholar]
- Connor JA, Wadman WJ, Hockberger PE, Wong RK. Sustained dendritic gradients of Ca2+ induced by excitatory amino acids in CA1 hippocampal neurons. Science. 1988;240:649–653. doi: 10.1126/science.2452481. [DOI] [PubMed] [Google Scholar]
- Czeh G, Aitken PG, Somjen GG. Membrane currents in CA1 pyramidal cells during spreading depression (SD) and SD-like hypoxic depolarization. Brain Res. 1993;632:195–208. doi: 10.1016/0006-8993(93)91154-k. [DOI] [PubMed] [Google Scholar]
- Dietz RM, Weiss JH, Shuttleworth CW. Zn2+ influx is critical for some forms of spreading depression in brain slices. J Neurosci. 2008;28:8014–8024. doi: 10.1523/JNEUROSCI.0765-08.2008. [DOI] [PMC free article] [PubMed] [Google Scholar]
- Dreier JP. The role of spreading depression, spreading depolarization and spreading ischemia in neurological disease. Nat Med. 2011;17:439–447. doi: 10.1038/nm.2333. [DOI] [PubMed] [Google Scholar]
- Dreier JP, Major S, Pannek HW, Woitzik J, Scheel M, Wiesenthal D, Martus P, Winkler MK, Hartings JA, Fabricius M, Speckmann EJ, Gorji A. Spreading convulsions, spreading depolarization and epileptogenesis in human cerebral cortex. Brain. 2011;135:259–275. doi: 10.1093/brain/awr303. [DOI] [PMC free article] [PubMed] [Google Scholar]
- Faria LC, Mody I. Protective effect of ifenprodil against spreading depression in the mouse entorhinal cortex. J Neurophysiol. 2004;92:2610–2614. doi: 10.1152/jn.00466.2004. [DOI] [PubMed] [Google Scholar]
- Gill R, Andine P, Hillered L, Persson L, Hagberg H. The effect of MK-801 on cortical spreading depression in the penumbral zone following focal ischaemia in the rat. J Cereb Blood Flow Metab. 1992;12:371–379. doi: 10.1038/jcbfm.1992.54. [DOI] [PubMed] [Google Scholar]
- Gniel HM, Martin RL. Changes in membrane potential and the intracellular calcium concentration during CSD and OGD in layer V and layer II/III mouse cortical neurons. J Neurophysiol. 2010;104:3203–3212. doi: 10.1152/jn.00922.2009. [DOI] [PubMed] [Google Scholar]
- Grynkiewicz G, Poenie M, Tsien RY. A new generation of Ca2+ indicators with greatly improved fluorescence properties. J Biol Chem. 1985;260:3440–3450. [PubMed] [Google Scholar]
- Hamann M, Rossi DJ, Marie H, Attwell D. Knocking out the glial glutamate transporter GLT-1 reduces glutamate uptake but does not affect hippocampal glutamate dynamics in early simulated ischaemia. Eur J Neurosci. 2002;15:308–314. doi: 10.1046/j.0953-816x.2001.01861.x. [DOI] [PubMed] [Google Scholar]
- Hartings JA, Rolli ML, Lu XC, Tortella FC. Delayed secondary phase of peri-infarct depolarizations after focal cerebral ischemia: relation to infarct growth and neuroprotection. J Neurosci. 2003;23:11602–11610. doi: 10.1523/JNEUROSCI.23-37-11602.2003. [DOI] [PMC free article] [PubMed] [Google Scholar]
- Hartings JA, Watanabe T, Bullock MR, Okonkwo DO, Fabricius M, Woitzik J, Dreier JP, Puccio A, Shutter LA, Pahl C, Strong AJ. Spreading depolarizations have prolonged direct current shifts and are associated with poor outcome in brain trauma. Brain. 2011;134:1529–1540. doi: 10.1093/brain/awr048. [DOI] [PubMed] [Google Scholar]
- Herreras O, Somjen GG. Analysis of potential shifts associated with recurrent spreading depression and prolonged unstable spreading depression induced by microdialysis of elevated K+ in hippocampus of anaesthetized rats. Brain Res. 1993a;610:283–294. doi: 10.1016/0006-8993(93)91412-l. [DOI] [PubMed] [Google Scholar]
- Herreras O, Somjen GG. Propagation of spreading depression among dendrites and somata of the same cell population. Brain Res. 1993b;610:276–282. doi: 10.1016/0006-8993(93)91411-k. [DOI] [PubMed] [Google Scholar]
- Hertle DN, Dreier JP, Woitzik J, Hartings JA, Bullock R, Okonkwo DO, Shutter LA, Vidgeon S, Strong AJ, Kowoll C, Dohmen C, Diedler J, Veltkamp R, Bruckner T, Unterberg AW, Sakowitz OW. Effect of analgesics and sedatives on the occurrence of spreading depolarizations accompanying acute brain injury. Brain. 2012;135:2390–2398. doi: 10.1093/brain/aws152. [DOI] [PubMed] [Google Scholar]
- Kunkler PE, Kraig RP. P/Q Ca2+ channel blockade stops spreading depression and related pyramidal neuronal Ca2+ rise in hippocampal organ culture. Hippocampus. 2004;14:356–367. doi: 10.1002/hipo.10181. [DOI] [PMC free article] [PubMed] [Google Scholar]
- Larrosa B, Pastor J, Lopez-Aguado L, Herreras O. A role for glutamate and glia in the fast network oscillations preceding spreading depression. Neuroscience. 2006;141:1057–1068. doi: 10.1016/j.neuroscience.2006.04.005. [DOI] [PubMed] [Google Scholar]
- Larsen RS, Corlew RJ, Henson MA, Roberts AC, Mishina M, Watanabe M, Lipton SA, Nakanishi N, Perez-Otano I, Weinberg RJ, Philpot BD. NR3A-containing NMDARs promote neurotransmitter release and spike timing-dependent plasticity. Nat Neurosci. 2011;14:338–344. doi: 10.1038/nn.2750. [DOI] [PMC free article] [PubMed] [Google Scholar]
- Lauritzen M, Dreier JP, Fabricius M, Hartings JA, Graf R, Strong AJ. Clinical relevance of cortical spreading depression in neurological disorders: migraine, malignant stroke, subarachnoid and intracranial hemorrhage, and traumatic brain injury. J Cereb Blood Flow Metab. 2011;31:17–35. doi: 10.1038/jcbfm.2010.191. [DOI] [PMC free article] [PubMed] [Google Scholar]
- Leao. Spreading depression of activity in the cerebral cortex. J Neurophysiol. 1944;7:359–390. doi: 10.1152/jn.1947.10.6.409. [DOI] [PubMed] [Google Scholar]
- Lindquist BS, Shuttleworth CW. 2011 Abstract Viewer/Itinerary Planner. Washington, DC: Society for Neuroscience; 2011. Adenosine activation of A1 receptors depresses synaptic activity after spreading depolarization. Programme No. 780.02. [Google Scholar]
- Marrannes R, Willems R, De Prins E, Wauquier A. Evidence for a role of the N-methyl-D-aspartate (NMDA) receptor in cortical spreading depression in the rat. Brain Res. 1988;457:226–240. doi: 10.1016/0006-8993(88)90690-7. [DOI] [PubMed] [Google Scholar]
- McGuinness L, Taylor C, Taylor RD, Yau C, Langenhan T, Hart ML, Christian H, Tynan PW, Donnelly P, Emptage NJ. Presynaptic NMDARs in the hippocampus facilitate transmitter release at theta frequency. Neuron. 2011;68:1109–1127. doi: 10.1016/j.neuron.2010.11.023. [DOI] [PubMed] [Google Scholar]
- Neher E. The use of fura-2 for estimating Ca buffers and Ca fluxes. Neuropharmacology. 1995;34:1423–1442. doi: 10.1016/0028-3908(95)00144-u. [DOI] [PubMed] [Google Scholar]
- Oliveira-Ferreira AI, Milakara D, Alam M, Jorks D, Major S, Hartings JA, Luckl J, Martus P, Graf R, Dohmen C, Bohner G, Woitzik J, Dreier JP. Experimental and preliminary clinical evidence of an ischemic zone with prolonged negative DC shifts surrounded by a normally perfused tissue belt with persistent electrocorticographic depression. J Cereb Blood Flow Metab. 2010;30:1504–1519. doi: 10.1038/jcbfm.2010.40. [DOI] [PMC free article] [PubMed] [Google Scholar]
- Peeters M, Gunthorpe MJ, Strijbos PJ, Goldsmith P, Upton N, James MF. Effects of pan- and subtype-selective N-methyl-D-aspartate receptor antagonists on cortical spreading depression in the rat: therapeutic potential for migraine. J Pharmacol Exp Ther. 2007;321:564–572. doi: 10.1124/jpet.106.117101. [DOI] [PubMed] [Google Scholar]
- Pomper JK, Haack S, Petzold GC, Buchheim K, Gabriel S, Hoffmann U, Heinemann U. Repetitive spreading depression-like events result in cell damage in juvenile hippocampal slice cultures maintained in normoxia. J Neurophysiol. 2006;95:355–368. doi: 10.1152/jn.00186.2005. [DOI] [PubMed] [Google Scholar]
- Rossi DJ, Oshima T, Attwell D. Glutamate release in severe brain ischaemia is mainly by reversed uptake. Nature. 2000;403:316–321. doi: 10.1038/35002090. [DOI] [PubMed] [Google Scholar]
- Sakowitz OW, Kiening KL, Krajewski KL, Sarrafzadeh AS, Fabricius M, Strong AJ, Unterberg AW, Dreier JP. Preliminary evidence that ketamine inhibits spreading depolarizations in acute human brain injury. Stroke. 2009;40:e519–e522. doi: 10.1161/STROKEAHA.109.549303. [DOI] [PubMed] [Google Scholar]
- Sara Y, Mozhayeva MG, Liu X, Kavalali ET. Fast vesicle recycling supports neurotransmission during sustained stimulation at hippocampal synapses. J Neurosci. 2002;22:1608–1617. doi: 10.1523/JNEUROSCI.22-05-01608.2002. [DOI] [PMC free article] [PubMed] [Google Scholar]
- Shin HK, Dunn AK, Jones PB, Boas DA, Moskowitz MA, Ayata C. Vasoconstrictive neurovascular coupling during focal ischemic depolarizations. J Cereb Blood Flow Metab. 2006;26:1018–1030. doi: 10.1038/sj.jcbfm.9600252. [DOI] [PubMed] [Google Scholar]
- Shuttleworth CW, Connor JA. Strain-dependent differences in calcium signalling predict excitotoxicity in murine hippocampal neurons. J Neurosci. 2001;21:4225–4236. doi: 10.1523/JNEUROSCI.21-12-04225.2001. [DOI] [PMC free article] [PubMed] [Google Scholar]
- Somjen GG. Mechanisms of spreading depression and hypoxic spreading depression-like depolarization. Physiol Rev. 2001;81:1065–1096. doi: 10.1152/physrev.2001.81.3.1065. [DOI] [PubMed] [Google Scholar]
- Somjen GG. Ion regulation in the brain: implications for pathophysiology. Neuroscientist. 2002;8:254–267. doi: 10.1177/1073858402008003011. [DOI] [PubMed] [Google Scholar]
- Spruston N, Jonas P, Sakmann B. Dendritic glutamate receptor channels in rat hippocampal CA3 and CA1 pyramidal neurons. J Physiol. 1995;482:325–352. doi: 10.1113/jphysiol.1995.sp020521. [DOI] [PMC free article] [PubMed] [Google Scholar]
- Sun HS, Feng ZP, Miki T, Seino S, French RJ. Enhanced neuronal damage after ischemic insults in mice lacking Kir6.2-containing ATP-sensitive K+ channels. J Neurophysiol. 2006;95:2590–2601. doi: 10.1152/jn.00970.2005. [DOI] [PubMed] [Google Scholar]
- Takano T, Tian GF, Peng W, Lou N, Lovatt D, Hansen AJ, Kasischke KA, Nedergaard M. Cortical spreading depression causes and coincides with tissue hypoxia. Nat Neurosci. 2007;10:754–762. doi: 10.1038/nn1902. [DOI] [PubMed] [Google Scholar]
- Takeda Y, Zhao L, Jacewicz M, Pulsinelli WA, Nowak TS., Jr Metabolic and perfusion responses to recurrent peri-infarct depolarization during focal ischemia in the Spontaneously Hypertensive Rat: dominant contribution of sporadic CBF decrements to infarct expansion. J Cereb Blood Flow Metab. 2011;31:1863–1873. doi: 10.1038/jcbfm.2011.62. [DOI] [PMC free article] [PubMed] [Google Scholar]
- Vander Jagt TA, Connor JA, Shuttleworth CW. Localized loss of Ca2+ homeostasis in neuronal dendrites is a downstream consequence of metabolic compromise during extended NMDA exposures. J Neurosci. 2008;28:5029–5039. doi: 10.1523/JNEUROSCI.5069-07.2008. [DOI] [PMC free article] [PubMed] [Google Scholar]
- Wadman WJ, Connor JA. Persisting modification of dendritic calcium influx by excitatory amino acid stimulation in isolated Ca1 neurons. Neuroscience. 1992;48:293–305. doi: 10.1016/0306-4522(92)90491-j. [DOI] [PubMed] [Google Scholar]
- Zhou N, Gordon GR, Feighan D, MacVicar BA. Transient swelling, acidification, and mitochondrial depolarization occurs in neurons but not astrocytes during spreading depression. Cereb Cortex. 2010;20:2614–2624. doi: 10.1093/cercor/bhq018. [DOI] [PubMed] [Google Scholar]