

Abstract
Extracellular zinc can induce numerous acute and persistent physiological and toxic effects in neurons by acting at their plasma membrane or intracellularly following permeation or uptake into them. Zinc acutely and reversibly blocks T-type voltage-gated calcium current (ICaT), but the long-term effect of zinc on this current has not been studied. Because chemically induced status epilepticus (SE) results in the release of zinc into the extracellular space, as well as in a long-lasting increase in ICaT in CA1 pyramidal cells, we hypothesized that zinc may play a causative role in ICaT upregulation. We tested this hypothesis by monitoring for 18 days the effects of zinc and ibotenic acid (a neurotoxic agent serving as control for zinc), injected into the right lateral ventricle, on ICaT in rat CA1 pyramidal cells. Both zinc and ibotenic acid caused marked hippocampal lesions on the side of injection, but only minor damage to contralateral hippocampi. Zinc, but not ibotenic acid, caused upregulation of a nickel-sensitive ICaT in a subset of contralateral CA1 pyramidal cells, appearing 2 days after injection and lasting for about 2 weeks thereafter. In contrast, acute application of zinc to CA1 pyramidal cells promptly blocked ICaT. These data indicate that extracellular zinc has a dual effect on ICaT, blocking it acutely while causing its long-term upregulation. Through the latter effect, zinc may regulate the intrinsic excitability of principal neurons, particularly in pathological conditions associated with enhanced release of zinc, such as SE.
Key points
Zinc induces various acute and persistent effects in neurons and it acutely blocks T-type voltage-gated calcium current (ICaT).
ICaT contributes to pilocarpine status epilepticus (SE)-induced epileptogenesis (transformation of normal brain into epileptic) by mediating the increase in intrinsic excitability of CA1 hippocampal neurons. Therefore, since SE causes both zinc release into the extracellular space and long-lasting increase in ICaT, zinc may actually upregulate ICaT on the long-term.
We demonstrated that when injected into the lateral ventricles of rats zinc upregulated ICaT in a subset of CA1 hippocampal neurons for about 2 weeks.
This shows that zinc has a dual effect on ICaT, blocking it acutely while causing its long-term upregulation.
This finding provides a possible explanation to the mechanism of epileptogenesis induced by pathological conditions associated with enhanced release of zinc, such as SE.
Introduction
Brain neurons contain large amounts of loosely and tightly bound zinc contributing to their normal function (Frederickson et al. 2005; Sensi et al. 2009). Several studies have suggested that loosely bound zinc present in a subset of glutamatergic nerve terminals is co-released with glutamate into the synaptic cleft. Although the amount of released zinc that actually reaches postsynaptic membranes is not known, its binding to neuronal plasma membrane receptors and ion channels may modulate numerous neuronal and synaptic functions (Vogt et al. 2000; Molnar & Nadler, 2001; Besser et al. 2009; Sensi et al. 2009; but see Kay & Toth, 2006; Evstratova & Toth, 2011). Furthermore, increase in the concentration of intracellular zinc by either penetration of extracellular zinc or release from internal binding sites (Cuajungco & Lees, 1998) can modify cellular metabolism, inducing neuronal cell death at toxic levels (Choi & Koh, 1998; Park et al. 2000), but also mediating neuroprotection in other cases (Lee et al. 2008). Additionally, it can affect transcription of many cellular proteins, mainly through its binding to metal transcription factor 1 (MTF-1; Cousins et al. 2006). Through these multiple acute and persistent effects, zinc likely plays a role in normal and pathological brain plasticity (Nakashima & Dyck, 2009; Sensi et al. 2009).
Zinc has also been shown to regulate conductivity through both native (Nelson et al. 2007) and recombinant T-type voltage-gated calcium channels (Traboulsie et al. 2007). The native T-type calcium channels ubiquitously expressed in brain neurons, as well as in many peripheral tissues, comprise three isoforms, namely, CaV3.1, CaV3.2 and CaV3.3, which generate low threshold-activated, inactivating calcium currents (ICaT; Perez-Reyes, 2003). In particular, zinc potently blocks CaV3.2 channels (IC50 0.8 μm; Traboulsie et al. 2007) by binding to the same site that is responsible for their potent inhibition by low concentrations of nickel (Kang et al. 2010). Zinc also has a blocking effect on CaV3.1 and CaV3.3 channels, albeit less potent than on CaV3.2 (IC50 100- and 200-fold higher, respectively). In addition, it slows the deactivation of CaV3.3 channels. These effects of zinc are acute and reversible upon wash (Traboulsie et al. 2007). Whether zinc also exerts long-term effects on neuronal T-type calcium channels has not been investigated to date. It is interesting to note, however, that chemically induced status epilepticus (SE) causes accumulation of free zinc in somata of CA1 pyramidal cells (Suh et al. 2001) and induces neurodegeneration (Qian et al. 2011). Shortly thereafter, CaV3.2 expression and ICaT amplitude in these neurons are strongly upregulated for several weeks (Su et al. 2002; Becker et al. 2008). These observations prompted us to test whether the increase in ICaT is causally related to exposure of these neurons to zinc. Here we have tested this hypothesis by monitoring the properties of ICaT in CA1 pyramidal cells during 18 days that follow intracerebroventricular (i.c.v.) zinc administration. Our data suggest that exposing neurons to zinc can induce a long-term increase in ICaT.
Methods
i.c.v. injections
All animal experiments were conducted in accordance with the guidelines of the Animal Care Committee of the Hebrew University. Adult male Sabra rats (Lutsky et al. 1984; 150–250 g), under intraperitoneally administered pentobarbital anaesthesia (40 mg kg−1), were positioned in a stereotactic frame (TSE Systems, Bad Homburg, Germany). Injections into the right ventricles were made at the following coordinates in relation to Bregma: 0.8 mm posterior; 1.4 mm to the right; and 5 mm beneath the calvarium using a continuous cycle syringe pump (TSE Systems). We used three injection protocols modified to obtain comparable hippocampal damage with zinc and ibotenic acid (see Results): 15 μl of normal saline over 90 min (saline-injected animals); 15 μl of normal saline containing 45 μg ZnCl2 (22 mm) over 90 min (zinc-injected animals); and 10 μl of normal saline containing 2 μg ibotenic acid (1.3 mm) over 30 min (ibotenic acid (ibotenate)-injected animals).
Histological analyses
Rats were decapitated under deep isofluorane anaesthesia, and their brains were quickly removed and stored in 4% paraformaldehyde. Coronal paraffin sections, 4 μm, were deparaffinized in xylene, rehydrated in graded alcohols, and washed in Tris-buffer. The extent of hippocampal neuronal cell loss was assessed in slices immunolabeled with antibodies against neuronal nuclei (NeuN), as previously described (Becker et al. 2008). For immunolabeling, endogenous peroxidase activity was quenched by incubation in phosphate-buffered saline (PBS) containing 1% hydrogen peroxide. Heat treatment resulted in antigen unmasking, followed by blocking of non-specific binding performed with 0.5% normal goat serum for 2 h at 37°C. Primary antibodies were added before incubation of slides overnight at room temperature. Sections were washed in PBS, covered with diluted biotinylated secondary antibody, and incubated for 2 h at 37°C. An avidin–biotin complex was applied (Vector Laboratories, Burlingame, CA, USA) and visualized using a diaminobenzidine solution (1 : 50 DAB, containing 0.05% H2O2). Haematoxylin-counterstained sections were mounted in aqueous media and analysed by standard light microscopy. Neurons were counted by an investigator blinded to the initial intervention. The mean neuronal densities were calculated for each rat from counts in at least 10 hippocampal sections in high-power fields of 2500 μm2, located in the CA1b area of the hippocampus. Images were captured with a Zeiss Axiocam (Carl Zeiss, Jena, Germany) and Axiovision software (Carl Zeiss).
Hippocampal slices
For whole-cell patch-clamp recordings, animals were perfused through the heart with 1–3°C cold sucrose-based artificial cerebrospinal fluid (aCSF) containing (in mm): NaCl, 56; sucrose, 100; KCl, 2.5; NaH2PO4, 1.25; NaHCO3, 30; CaCl2, 1; MgCl2, 5; glucose, 20 (95% CO2/5% O2) under deep anaesthesia with ketamine (100 mg kg−1) and xylazine (15 mg kg−1). After complete perfusion rats were decapitated, the brain was quickly removed and 300 μm-thick transverse hippocampal slices were prepared with a vibrating blade microtome (Leica VT 1200 S, Solms, Germany) and gradually warmed to 34°C over 30 min in a storage chamber perfused with sucrose–aCSF identical to the one above, but with 26 mm NaHCO3 and 60 mm NaCl (95% CO2–5% O2). Slices were then transferred to a holding chamber and equilibrated at room temperature (21°C) for at least 60 min with aCSF containing (in mm): NaCl, 125; KCl, 3.5; NaH2PO4, 1.25; MgCl2, 2; CaCl2, 2; NaHCO3, 26; glucose, 15 (pH 7.4; 310 mosmol l−1). In addition, μ-conotoxin MVIIC (3 μm) and μ-agatoxin GIVA (200 nm) were added to irreversibly block high voltage-activated N- and P/Q-type calcium currents (Su et al. 2002).
Whole-cell patch-clamp recordings
Hippocampal slices were placed in a submerged recording chamber at 34°C and continuously perfused with oxygenated aCSF containing (in mm): TEA-Cl, 20; sodium methanesulfonate, 115; KCl, 3.5; Hepes, 10; CaCl2, 2; MgCl2, 2; 4-aminopyridine, 4; glucose, 25 (pH 7.4, osmolarity 310 mosmol l−1). In addition, nifedipine (10 μm) was added to block L-type calcium currents. For recording pure ICaT, a possible overlap with R-type calcium current was circumvented by measuring tail currents following the voltage steps at 3 ms after the end of the depolarization pulse (Becker et al. 2008). Pyramidal cells in the CA1 field were visualized at 60× magnification using a Nikon FN1 microscope and an infra-red video camera (Hamamatsu, Japan). Recording patch pipettes (2–4 MΩ) were pulled from borosilicate glass on a vertical puller (Narishige, Tokyo, Japan). Intracellular (pipette) solution contained (in mm): caesium methanesulfonate, 105; TEA-Cl, 20; Hepes, 10; BAPTA, 10; MgCl2, 2; CaCl2, 2; sucrose, 25; Na2-ATP, 4; GTP, 0.3 (pH 7.4). Tight-seal whole-cell recordings were obtained using a patch-clamp amplifier (Axopatch 200A, Molecular Devices, Sunnyvale, CA, USA). The signals were filtered on-line at 5 kHz, digitized at a sampling rate of 10 kHz and stored on hard disk (TL-1 DMA and pCLAMP, Molecular Devices). Series resistance compensation was employed to improve the voltage-clamp control (>70%) so that the maximal residual voltage error did not exceed 5 mV. A liquid junction potential of 5 mV was measured between the intra- and extracellular solutions, and corrected off-line.
Data analysis
ICaT amplitudes were determined from the size of the slow deactivating component of tail currents elicited by 20 ms-long depolarizing step potentials and fitted with a biexponential equation using a Levenberg–Marquard non-linear curve-fitting procedure (Becker et al. 2008). ICaT activation curves were constructed from current–voltage (I–V) relationships, normalized, and then fitted by Boltzmann's equation. Steady-state inactivation of ICaT was measured by the use of conventional double-pulse method with VH of −100 mV and was also fitted by Boltzmann's equation:
where I is the peak current, Imax is the peak current when the conditioning pulse was −100 mV, Vm and V0.5 are the conditioning potentials and the half-inactivation potentials, respectively, and k is the inactivation slope. The 10–90% rise times of ICaT were measured from current traces evoked by 200 ms-long depolarizing steps. The inactivation time course of ICaT was obtained from these traces by fitting the current decay with a bi-exponential equation of the form:
where I(t) is the current amplitude at the time point t after onset of the voltage command, τf and τs are the fast and slow decay time constants, respectively, and A is the amplitude contribution of the different time constants.
The dose–response curve for nickel block of ICaT was obtained by fitting the data points with a modified Hill function of the form:
where E is the fraction of current blocked, Emax is the maximal block, c is the concentration of nickel, n is the Hill coefficient, and IC50 is the nickel concentration causing half-maximal block.
All curve fittings were done using a Levenberg–Marquard non-linear curve-fitting procedure.
Statistical analyses
Paired or unpaired Student's t tests were used, as required, for two-sample comparisons. ANOVA was used for comparison of multiple samples. Chi2 was used for comparison of proportions. Kolmogorov–Smirnov test for normal distribution was used to assess the fitting of values to a normal distribution curve. Values were considered significantly different at P < 0.05. All results are plotted as mean ± SEM.
Results
Zinc and ibotenic acid induce loss of hippocampal pyramidal neurons
For histological evaluation, brains were removed and sliced 7–10 days after the i.c.v. injections. Slices were immunolabeled with antibodies against NeuN (see Methods). In saline-injected animals (n= 11), both right (ipsilateral to injection) and left hippocampi (contralateral to injection) were intact, without signs of pyramidal cell loss (Fig. 1Aab, D and E). No differences in the average densities of CA1 pyramidal cells between ipsilateral and contralateral hippocampi were found (ipsilateral: 10.7 ± 0.09 neurons (2500 μm)−2; contralateral: 10.8 ± 0.15 neurons (2500 μm)−2; P= 0.5).
Figure 1. i.c.v. zinc injection induces hippocampal neuronal cell loss, similarly to injection of ibotenic acid.
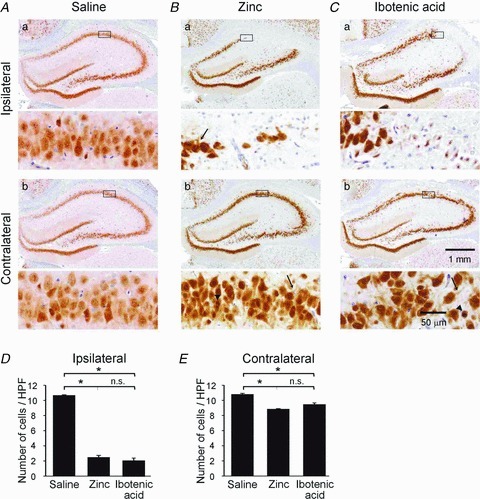
A–C, hippocampal slices immunolabeled for NeuN from rats injected i.c.v. with saline (A), zinc (B) and ibotenic acid (C). Each panel shows at low (top) and at high magnification (bottom) immunolabeled slices from the ipsilateral (a) and contralateral hippocampi (b) of the same animal. For each slice, the rectangular area shown with high magnification is labeled at the top. Neurons from zinc- and ibotenic acid-injected rats show signs of damage, such as pyknotic nuclei (arrowheads) and shrunken cytoplasms (arrows). D and E, bar graphs depicting the mean neuronal density in ipsilateral (D) and contralateral (E) CA1 areas from rats injected with saline, zinc and ibotenic acid. HPF, high power field (2500 mm2).
It was previously reported that unilaterally i.c.v. injected zinc spreads to all ventricles within an hour and permeates the parenchyma of both hemispheres, accumulating in both hippocampi, though the concentration attained is higher on the ipsilateral side (Takeda et al. 1994). In congruency with this finding and with the well-known neurotoxicity of zinc (Choi & Koh, 1998), a severe necrotic lesion extending from the ventricle to the hippocampus was found in the ipsilateral hemisphere of zinc-injected animals (n= 5; Fig. 1Ba). Maximal damage was observed in the CA1 and CA3 fields. The necrotic lesions induced by zinc did not spread to contralateral hippocampi (Fig. 1Bb). However, sporadic pyramidal cell loss and appearance of neurons with shrunken cytoplasm and pyknotic nuclei were evident on that side (Fig. 1Bb detail). Compared with CA1 pyramidal cell densities in the saline-injected group, zinc injections caused death of ∼75% of neurons in ipsilateral hippocampi and ∼20% of neurons in the contralateral hippocampi (average densities of cells were 2.5 ± 0.22 and 8.8 ± 0.09 neurons (2500 μm)−2, respectively; P < 0.01 for both; Fig. 1D and E).
Expectedly, areas of extensive injury were found within the CA1 and CA3 regions in ipsilateral hippocampi following injection of ibotenic acid (n= 7; Fig. 1Ca). As in zinc-injected animals, sporadic pyramidal cell loss and damage were evident on the contralateral side (Fig. 1Cb). The mean densities of CA1 pyramidal cells in the ipsilateral (2.06 ± 0.34 neurons (2500 μm)−2) and contralateral (9.06 ± 0.23 neurons (2500 μm)−2) hippocampi were significantly lower than in saline-injected rats (P < 0.01 for both) and similar to those in zinc-injected animals (P= 0.3 and 0.1, respectively; Fig. 1D and E).
Zinc causes upregulation of ICaT
We next assessed the magnitude of ICaT in CA1 pyramidal cells in slices removed from saline-injected (n= 6), zinc-injected (n= 31) and ibotenate-injected rats (n= 8), obtained 2–12 days after injections. To that end, we performed whole-cell patch-clamp recordings in conditions of blocked Na+ and K+ currents. Likewise, the contribution of high-threshold L-, N- and P/Q-type calcium currents was minimized by adding selective antagonists of the respective calcium channels to the aCSFs (see Methods), and by applying small depolarizing current pulses. The neurons were maintained at a holding potential of −95 mV (to maximize the availability of T-type calcium channels; see below) and subjected to a series of 20 ms-long depolarizing voltage steps from −75 to −35 mV in increments of 5 mV (Fig. 2A, left panel). The measured capacitance of neurons in the saline-, zinc- and ibotenic acid-injected animals did not differ significantly (24.8 ± 1.4; 24.2 ± 0.9; 23.9 ± 1.7 pF, respectively), indicating that zinc and ibotenic acid injections did not affect cell size. Thus, for comparative purposes, ICaT are displayed as current size (pA), not as current densities (pA pF−1). Illustrative recordings of ICaT in neurons from the three groups are shown in Fig. 2A. To eliminate the putative contribution of the fast deactivating Ni2+-sensitive R-type calcium current to the measured currents (Zamponi et al. 1996), amplitudes of ICaT were derived from the slow component of the tail currents following depolarizing steps to −45 mV (Sochivko et al. 2002; Su et al. 2002; Becker et al. 2008; see Methods). ICaT averaged 196.7 ± 25.0 pA in the saline-injected group (n= 12), 323.0 ± 26.7 pA in the zinc-injected group (n= 57) and 176.4 ± 14.0 pA in the ibotenate-injected group (n= 14). These data, summarized in Fig. 2C, show that in neurons from zinc-injected rats, ICaT was 1.6-fold larger than ICaT in neurons from saline-injected rats (P < 0.01), and 1.8-fold larger than ICaT in neurons from ibotenate-injected rats (P < 0.01). No significant difference in amplitudes of ICaT was found between neurons from saline-injected rats and those from ibotenate-injected rats (P= 0.24; Fig. 2C).
Figure 2. i.c.v. zinc injection upregulates ICaT in CA1 pyramidal cells.
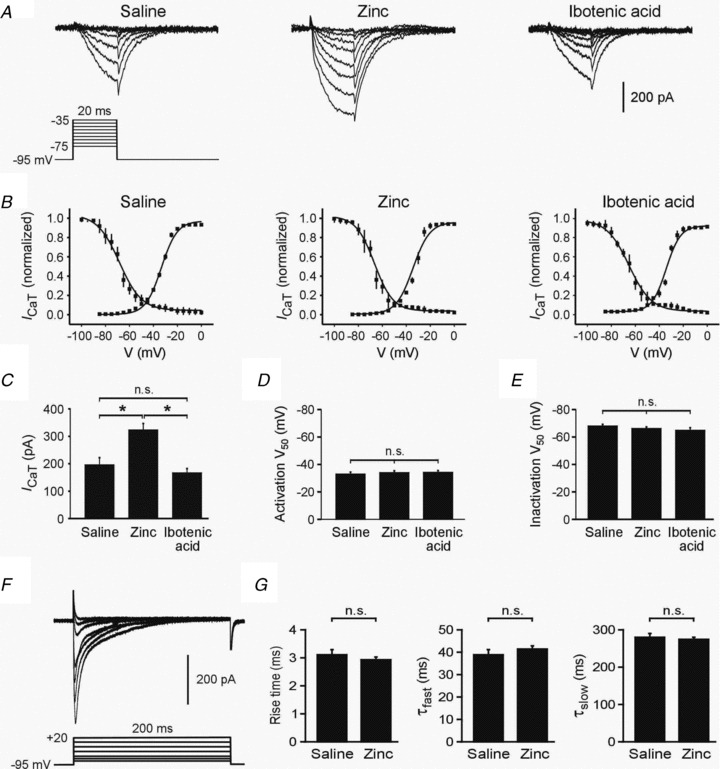
A, representative examples of ICaT from saline- (left panel), zinc- (middle panel) and ibotenic acid-injected rats (right panel). Tail currents were measured at −95 mV following 20 ms depolarization steps to different potentials. B, normalized ICaT activation and inactivation curves for saline- (left panel), zinc- (middle panel) and ibotenic acid-injected rats (right panel). C. Bar graph comparing mean ICaT amplitudes measured at a test pulse potential of −45 mV in saline-, zinc- and ibotenic acid-injected rats. D, bar graph showing V50 values for ICaT activation in the three groups of neurons. E, bar graph showing V50 values for ICaT steady-state inactivation in the three groups of neurons. F, representative traces of ICaT recorded in response to long command steps from a holding potential of −90 mV to test potentials from −80 to +20 mV in a cell from a zinc-injected rats. G, bar graphs comparing rise time values and fast and slow decay time constants between neurons from saline- and zinc-injected rats.
The curves depicting ICaT activation and steady-state inactivation versus voltage were similar in all three groups of animals (Fig. 2B). The V0.5 values of activation for the saline-, zinc- and ibotenate-injected rats were −33.4 ± 0.8, −34.4 ± 0.7 and −34.2 ± 0.8 mV, respectively (P= 0.5; Fig. 2D). The V0.5 values of steady-state inactivation were 68.3 ± 1.1, −66.5 ± 1.2 and −65.3 ± 1.0 mV, respectively (P= 0.4; Fig. 2E). We further compared the activating and deactivating kinetics of ICaT in neurons from saline-injected versus zinc-injected rats. To that end, we elicited ICaT values by 200 ms-long depolarizing voltage steps (Fig. 2F) and measured their 10–90% rise time values, as well as the fast (τf) and slow (τs) decay time constants (see Methods). For voltage pulses to −40 mV (which would minimize activation of residual high voltage-activated calcium currents), the ICaT rise time values in neurons from saline-injected (n= 5) and zinc-injected animals (n= 6) were similar (7.8 ± 0.1 and 7.3 ± 0.1 ms, respectively; P= 0.17; Fig. 2G). Likewise, their τf (97.3 ± 1.2 and 104.0 ± 1.1 ms, respectively; P= 0.19) and τs (696.2 ± 5.1 and 678.7 ± 4.8 ms, respectively; P= 0.28) were the same (Fig. 2G).
Together, these results suggest that zinc-induced upregulation of ICaT in CA1 pyramidal cells is underlain by an increase in the density of T-type calcium channels, rather than by changes in their voltage sensitivity or kinetics.
The amplitude distribution of ICaT values recorded in neurons from saline-injected rats disclosed a normal distribution (P= 0.9; mean = 196.7 pA; SD = 86.7 pA; Fig. 3A, left panel), with only 8.3% of these neurons expressing ICaT larger than two SDs from the mean (370.1 pA; Fig. 3B). The amplitudes of ICaT in neurons from ibotenic acid-injected rats were also normally distributed (P > 0.05; Fig. 3A, right panel). No neurons expressing ICaT larger than 370.1 pA were encountered in the latter group (Fig. 3B). In contrast, the distribution of ICaT amplitudes in neurons from zinc-injected rats was not normal (Fig. 3A, middle panel), with a significant fraction of these neurons expressing currents larger than 370.1 pA (P < 0.001; Fig. 3B). The latter distribution comprised two slightly overlapping normal distributions (P= 0.9 and P= 1; Fig. 3A, middle panel). One distribution had a mean ICaT of 225.0 ± 11.3 pA (n= 41; 71.9% of all neurons), which did not differ from the mean ICaT in both control groups (P= 0.3; Fig. 3C). The second distribution had a mean ICaT of 574.1 ± 25.8 pA (n= 16; 28.1% of all neurons), differing significantly from ICaT in both control groups (P < 0.01; Fig. 3C). The neurons having large ICaTs were similar to the other neurons from zinc-injected rats with respect to cell capacitance (Fig. 3D) and series resistance (Fig. 3E).
Figure 3. Variation in ICaT amplitudes in zinc-injected CA1 pyramidal cells.
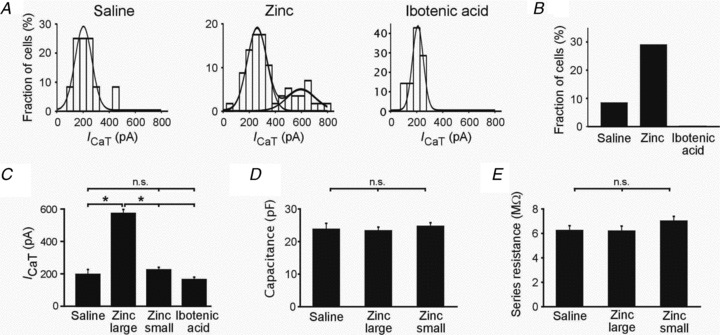
A, amplitude distribution histograms of ICaT amplitudes in CA1 pyramidal cells from saline-, zinc- and ibotenic acid-injected animals. The histograms were fitted with Gaussian curves and show the appearance of a subpopulation of cells with larger ICaT in zinc-injected animals. B, bar graph showing fraction of neurons in the three groups of animals manifesting ICaT larger than 370.1 pA (mean + 2SDs of ICaT in the saline-injected group). C, bar graph comparing ICaT amplitudes (recorded at a test pulse potential of −45 mV) in the two neuron subgroups from zinc-injected animals versus ICaT amplitudes in neurons from saline- and ibotenic acid-injected animals. D, bar graph showing similar capacitance of the two neuron subgroups from zinc-injected animals and saline-injected animals. E, bar graph showing similar series resistance of the two neuron subgroups from zinc-injected animals and saline-injected animals.
Nickel sensitivity of ICaT
To further characterize ICaT in CA1 pyramidal cells from zinc-injected rats, we studied its sensitivity to blockade by nickel. Nickel has been shown to much more potently block the recombinently expressed CaV3.2 isoform of T-type calcium channels (EC50= 13 μm) than the two other isoforms, CaV3.1 (EC50= 216 μm) and CaV3.3 (EC50= 250 μm; Lee et al. 1999). In neurons from zinc-injected animals, Ni2+ reduced ICaT in both subgroups (large and small ICaT) by 71.5% (from 544.27 ± 57.7 pA to 157.1 ± 34.2 pA; n= 4; P= 0.0054) and 75.0% (from 206.5 ± 22.14 pA to 50.4 ± 4.4 pA; n= 4; P= 0.0037), respectively, similar to the reduction in neurons from saline-injected rats (Fig. 4A and B). Figure 4C depicts the dose–response curves for nickel blockade of ICaT in neurons from saline- and zinc-injected rats. The estimated EC50 values were 40.45 ± 8.1 μm (n= 3) and 35.7 ± 9.5 μm (n= 5), respectively, and did not significantly differ from each other (P= 0.21; F test comparison). These values are consistent with ICaT being predominantly generated by CaV3.2 channels in both groups of neurons (Lee et al. 1999).
Figure 4. Blockade of ICaT by nickel.
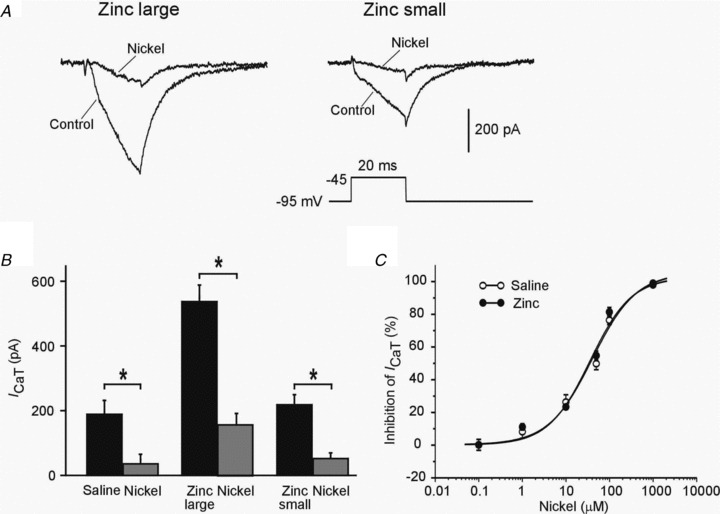
A, representative traces of ICaT before (Control) and 5 min after adding 100 μm nickel to the aCSF (Nickel) in the two neuron subgroups from zinc-injected animals. B, bar graph showing the similar blocking effect of 100 μm nickel on ICaT in the two neuron subgroups from zinc-injected animals (n= 4 for each subgroup) and saline-injected rats (n= 3). C, concentration–response curve for nickel on ICaT in cells from saline-injected rats (n= 3; open circles) and zinc-injected rats (n= 5; filled circles). Data were fitted with a Hill equation using a Levenberg–Marquard non-linear curve-fitting procedure. The fitted lines are shown superimposed on the data points for saline- and zinc-injected rats, and are almost indistinguishable.
Day-by-day time course of zinc-induced ICaT upregulation
Given that ICaT was markedly upregulated in zinc-injected animals, we sought to determine the precise time course and persistence of this alteration. Figure 5 shows a plot of average ICaT measured in animals killed 1, 2, 3, 4, 6, 9, 12 and 18 days after zinc injection (n≥ 5 for each subgroup of neurons; total n= 71). The increase in ICaT was evident from day 2 and remained elevated without increasing further for about 2 weeks, after which it returned to baseline.
Figure 5. Time course of zinc-induced ICaT increase.
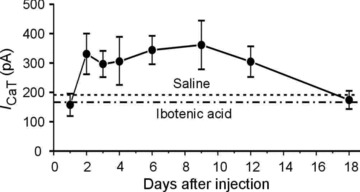
Each data point is the mean ICaT amplitude of 5–12 cells from 5–8 animals. The dashed lines represent the mean ICaT amplitudes in neurons from saline- and ibotenic-acid injected rats.
Acute effect of zinc on ICaT
Finally, we examined the effects of acutely applied zinc on ICaT in CA1 pyramidal cells (n= 6) in hippocampal slices obtained from naive rats. Adding 300 μm of zinc to the aCSF rapidly and markedly suppressed ICaT by 94.3 ± 0.5% (from 238.3 ± 15.7 to 13.6 ± 1.3 pA; n= 6; P < 0.05; Fig. 6A–C). This effect was readily reversible upon zinc washout (data not shown; Traboulsie et al. 2007). These data show that zinc exerts a dual action on ICaT, blocking it acutely, but also triggering processes leading to its eventual upregulation.
Figure 6. Acute effects of zinc on ICaT in ordinary CA1 pyramidal cells.
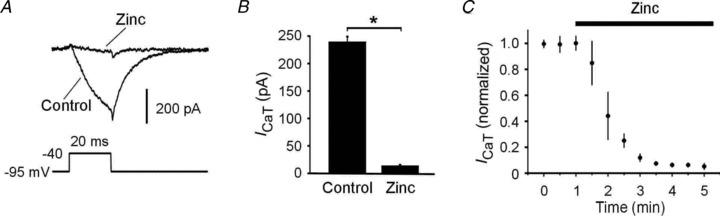
A, representative traces of ICaT before (Control) and 5 min after adding 300 μm zinc to the aCSF (Zinc). B, bar graph showing the marked suppression of ICaT (recorded at a test pulse potential of −45 mV) by 300 μm zinc (n= 6). C, graph showing the rapid time course of ICaT block by 300 μm zinc (application marked by bar). ICaT amplitudes were normalized to initial amplitude (n= 6).
Discussion
In this study we show that exposing rat hippocampi in vivo to zinc or ibotenic acid causes comparable pyramidal cell loss. Despite the similarity in neuronal damage, zinc, but not ibotenic acid, induces a long-term upregulation of ICaT in a substantial subset of surviving CA1 pyramidal cells. These findings suggest that the increase in ICaT in zinc-injected animals is due to a unique action of zinc itself, rather than reflecting a non-specific alteration associated with neurotoxicity.
Intriguingly, we found that only a subset of neurons from zinc-injected rats, comprising ∼28% of the sampled population, displayed an augmented ICaT. The reasons for this differential modulation remain unclear. Although there was no apparent clustering of neurons manifesting a large ICaT in particular slices, it is possible that following i.c.v. injection some neurons are exposed to larger concentrations of zinc than others or are more vulnerable to its action, as is also indicated by the sporadic death of neurons on the contralateral side of injection.
The upregulation of ICaT became evident only during the second day after zinc i.c.v. injection, after which ICaT remained elevated for another 2 weeks without increasing further and then declined to baseline level (Fig. 5). The latency period likely is due to the time required for zinc to exert its modulatory action. This action may be exerted intracellularly, as zinc readily enters neurons through multiple receptor-operated and voltage-gated channels and via carrier-mediated transport (Colvin et al. 2003).
The potent suppression of ICaT by 100 μm nickel (Fig. 4A and B) in neurons expressing either large or small ICaT indicates that CaV3.2 is the predominant T-type calcium channel subunit in CA1 pyramidal cells from zinc-treated rats, as is likely the case in normal CA1 pyramidal cells. Though further experiments are necessary to characterize the mechanism underlying the modulation of ICaT by zinc, we speculate that it involves transcriptional upregulation of CaV3.2. Indeed, we have recently found that cytosolic zinc enhances transcription of CaV3.2 in NG108–15 cells via its binding to MTF-1 (A. J. Becker, K. M. J. van Loo, Y. Yaari and S. Schoch, unpublished observations). Whatever the mechanism, the long-term upregulation of ICaT in CA1 pyramidal cells exposed to zinc contrasts markedly with the fact that zinc applied acutely is a potent blocker of ICaT in these neurons (Fig. 6), similar to its reported effect in other preparations (Nelson et al. 2007; Traboulsie et al. 2007; Kang et al. 2010).
We have previously shown in both rats and mice that a single episode of SE induced by the convulsant pilocarpine leads to a marked upregulation of ICaT induced by CaV3.2 promoter activation (Su et al. 2002; Becker et al. 2008). The mechanism coupling SE to CaV3.2 transcription has not been clarified, but our study suggests that involvement of zinc is a likely option. In line with this hypothesis, it was shown that pilocarpine-induced SE causes accumulation of free zinc in CA1 pyramidal cell somata within 24 h (Suh et al. 2001). The somatic zinc may originate from the enhanced release of vesicular zinc during seizure discharges (Suh et al. 2001). Alternatively, or in addition, zinc may be released locally in the soma from metallothioneins by nitric oxide or other free radicals (Cuajungco & Lees, 1998) that are produced in excess during SE (Milatovic et al. 2002). Given that ICaT upregulation is likely a critical step in epileptogenesis following pilocarpine-induced SE (Becker et al. 2008), it would be of utmost importance to clarify further the molecular mechanisms by which zinc upregulates ICaT.
Acknowledgments
This study was supported by SFB TR3, the German-Israeli Foundation for Scientific Research and Development (GIF), the Humboldt Foundation (F.B.), and the Henri J. and Erna D. Leir Chair for Research in Neurodegenerative Diseases (Y.Y.).
Glossary
- aCSF
artificial cerebrospinal fluid
- ICaT
T-type calcium current
- i.c.v.
intracerebroventricular
- MTF-1
metal transcription factor 1
- NeuN
neuronal nuclei
- PBS
phosphate-buffered saline
- SE
status epilepticus
Author contributions
The experiments were performed in the laboratories of Y.Y. in the Faculty of Medicine of the Hebrew University, Jerusalem, Israel; and of A.J.B. in the Department of Neuropathology, University of Bonn Medical Center, Bonn, Germany. D.E. and F.B. contributed to the conception and design of experiments, collection, analysis and interpretation of data, and drafting and revision of the paper. M.D., J.P. and K.V. contributed to the collection, analysis and interpretation of data. A.J.B. contributed to the conception and design of experiments, analysis and interpretation of data, and drafting of the paper. Y.Y. contributed to the conception and design of experiments, interpretation of data, and drafting and revision of the article. All authors approved the final version of the manuscript.
References
- Becker AJ, Pitsch J, Sochivko D, Opitz T, Staniek M, Chen CC, Campbell KP, Schoch S, Yaari Y, Beck H. Transcriptional upregulation of Cav3.2 mediates epileptogenesis in the pilocarpine model of epilepsy. J Neurosci. 2008;28:13,341–13,353. doi: 10.1523/JNEUROSCI.1421-08.2008. [DOI] [PMC free article] [PubMed] [Google Scholar]
- Besser L, Chorin E, Sekler I, Silverman WF, Atkin S, Russell JT, Hershfinkel M. Synaptically released zinc triggers metabotropic signaling via a zinc-sensing receptor in the hippocampus. J Neurosci. 2009;29:2890–2901. doi: 10.1523/JNEUROSCI.5093-08.2009. [DOI] [PMC free article] [PubMed] [Google Scholar]
- Choi DW, Koh JY. Zinc and brain injury. Annu Rev Neurosci. 1998;21:347–375. doi: 10.1146/annurev.neuro.21.1.347. [DOI] [PubMed] [Google Scholar]
- Colvin RA, Fontaine CP, Laskowski M, Thomas D. Zn2+ transporters and Zn2+ homeostasis in neurons. Eur J Pharmacol. 2003;479:171–185. doi: 10.1016/j.ejphar.2003.08.067. [DOI] [PubMed] [Google Scholar]
- Cousins RJ, Liuzzi JP, Lichten LA. Mammalian zinc transport, trafficking, and signals. J Biol Chem. 2006;281:24,085–24,089. doi: 10.1074/jbc.R600011200. [DOI] [PubMed] [Google Scholar]
- Cuajungco MP, Lees GJ. Nitric oxide generators produce accumulation of chelatable zinc in hippocampal neuronal perikarya. Brain Res. 1998;799:118–129. doi: 10.1016/s0006-8993(98)00463-6. [DOI] [PubMed] [Google Scholar]
- Evstratova A, Toth K. Synaptically evoked Ca2+ release from intracellular stores is not influenced by vesicular zinc in CA3 hippocampal pyramidal neurons. J Physiol. 2011;589:5677–5689. doi: 10.1113/jphysiol.2011.216598. [DOI] [PMC free article] [PubMed] [Google Scholar]
- Frederickson CJ, Koh JY, Bush AI. The neurobiology of zinc in health and disease. Nat Rev Neurosci. 2005;6:449–462. doi: 10.1038/nrn1671. [DOI] [PubMed] [Google Scholar]
- Kang HW, Vitko I, Lee SS, Perez-Reyes E, Lee JH. Structural determinants of the high affinity extracellular zinc binding site on CaV3.2 T-type calcium channels. J Biol Chem. 2010;285:3271–3281. doi: 10.1074/jbc.M109.067660. [DOI] [PMC free article] [PubMed] [Google Scholar]
- Kay AR, Toth K. Influence of location of a fluorescent zinc probe in brain slices on its response to synaptic activation. J Neurophysiol. 2006;95:1949–1956. doi: 10.1152/jn.00959.2005. [DOI] [PubMed] [Google Scholar]
- Lee JH, Gomora JC, Cribbs LL, Perez-Reyes E. Nickel block of three cloned T-type calcium channels: low concentrations selectively block α1H. Biophys J. 1999;77:3034–3042. doi: 10.1016/S0006-3495(99)77134-1. [DOI] [PMC free article] [PubMed] [Google Scholar]
- Lee JY, Kim YJ, Kim TY, Koh JY, Kim YH. Essential role for zinc-triggered p75NTR activation in preconditioning neuroprotection. J Neurosci. 2008;28:10,919–10,927. doi: 10.1523/JNEUROSCI.3421-08.2008. [DOI] [PMC free article] [PubMed] [Google Scholar]
- Lutsky I, Aizer F, Mor N. The Sabra rat: definition of a laboratory animal. Isr J Med Sci. 1984;20:603–612. [PubMed] [Google Scholar]
- Milatovic D, Gupta RC, Dettbarn WD. Involvement of nitric oxide in kainic acid-induced excitotoxicity in rat brain. Brain Res. 2002;957:330–337. doi: 10.1016/s0006-8993(02)03669-7. [DOI] [PubMed] [Google Scholar]
- Molnar P, Nadler JV. Synaptically-released zinc inhibits N-methyl-D-aspartate receptor activation at recurrent mossy fiber synapses. Brain Res. 2001;910:205–207. doi: 10.1016/s0006-8993(01)02720-2. [DOI] [PubMed] [Google Scholar]
- Nakashima AS, Dyck RH. Zinc and cortical plasticity. Brain Res Rev. 2009;59:347–373. doi: 10.1016/j.brainresrev.2008.10.003. [DOI] [PubMed] [Google Scholar]
- Nelson MT, Woo J, Kang HW, Vitko I, Barrett PQ, Perez-Reyes E, Lee JH, Shin HS, Todorovic SM. Reducing agents sensitize C-type nociceptors by relieving high-affinity zinc inhibition of T-type calcium channels. J Neurosci. 2007;27:8250–8260. doi: 10.1523/JNEUROSCI.1800-07.2007. [DOI] [PMC free article] [PubMed] [Google Scholar]
- Park JA, Lee JY, Sato TA, Koh JY. Co-induction of p75NTR and p75NTR-associated death executor in neurons after zinc exposure in cortical culture or transient ischemia in the rat. J Neurosci. 2000;20:9096–9103. doi: 10.1523/JNEUROSCI.20-24-09096.2000. [DOI] [PMC free article] [PubMed] [Google Scholar]
- Perez-Reyes E. Molecular physiology of low-voltage-activated t-type calcium channels. Physiol Rev. 2003;83:117–161. doi: 10.1152/physrev.00018.2002. [DOI] [PubMed] [Google Scholar]
- Qian J, Xu K, Yoo J, Chen TT, Andrews G, Noebels JL. Knockout of Zn transporters Zip-1 and Zip-3 attenuates seizure-induced CA1 neurodegeneration. J Neurosci. 2011;31:97–104. doi: 10.1523/JNEUROSCI.5162-10.2011. [DOI] [PMC free article] [PubMed] [Google Scholar]
- Sensi SL, Paoletti P, Bush AI, Sekler I. Zinc in the physiology and pathology of the CNS. Nat Rev Neurosci. 2009;10:780–791. doi: 10.1038/nrn2734. [DOI] [PubMed] [Google Scholar]
- Sochivko D, Pereverzev A, Smyth N, Gissel C, Schneider T, Beck H. The CaV2.3 Ca2+ channel subunit contributes to R-type Ca2+ currents in murine hippocampal and neocortical neurones. J Physiol. 2002;542:699–710. doi: 10.1113/jphysiol.2002.020677. [DOI] [PMC free article] [PubMed] [Google Scholar]
- Su H, Sochivko D, Becker A, Chen J, Jiang Y, Yaari Y, Beck H. Upregulation of a T-type Ca2+ channel causes a long-lasting modification of neuronal firing mode after status epilepticus. J Neurosci. 2002;22:3645–3655. doi: 10.1523/JNEUROSCI.22-09-03645.2002. [DOI] [PMC free article] [PubMed] [Google Scholar]
- Suh SW, Thompson RB, Frederickson CJ. Loss of vesicular zinc and appearance of perikaryal zinc after seizures induced by pilocarpine. Neuroreport. 2001;12:1523–1525. doi: 10.1097/00001756-200105250-00044. [DOI] [PubMed] [Google Scholar]
- Takeda A, Sawashita J, Okada S. Localization in rat brain of the trace metals, zinc and manganese, after intracerebroventricular injection. Brain Res. 1994;658:252–254. doi: 10.1016/s0006-8993(09)90032-4. [DOI] [PubMed] [Google Scholar]
- Traboulsie A, Chemin J, Chevalier M, Quignard JF, Nargeot J, Lory P. Subunit-specific modulation of T-type calcium channels by zinc. J Physiol. 2007;578:159–171. doi: 10.1113/jphysiol.2006.114496. [DOI] [PMC free article] [PubMed] [Google Scholar]
- Vogt K, Mellor J, Tong G, Nicoll R. The actions of synaptically released zinc at hippocampal mossy fiber synapses. Neuron. 2000;26:187–196. doi: 10.1016/s0896-6273(00)81149-6. [DOI] [PubMed] [Google Scholar]
- Zamponi GW, Bourinet E, Snutch TP. Nickel block of a family of neuronal calcium channels: subtype- and subunit-dependent action at multiple sites. J Membr Biol. 1996;151:77–90. doi: 10.1007/s002329900059. [DOI] [PubMed] [Google Scholar]